

Identification of m5C-related lncRNAs signature to predict prognosis and therapeutic responses in esophageal squamous cell carcinoma patients
- PMID: 37666951
- PMCID: PMC10477299
- DOI: 10.1038/s41598-023-41495-6
Identification of m5C-related lncRNAs signature to predict prognosis and therapeutic responses in esophageal squamous cell carcinoma patients
Abstract
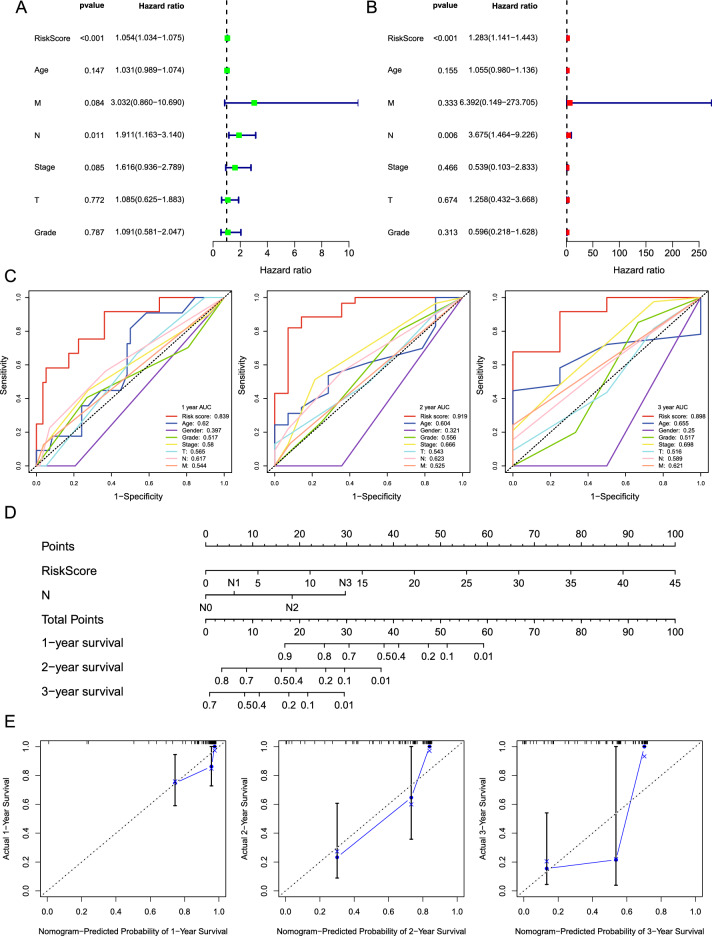
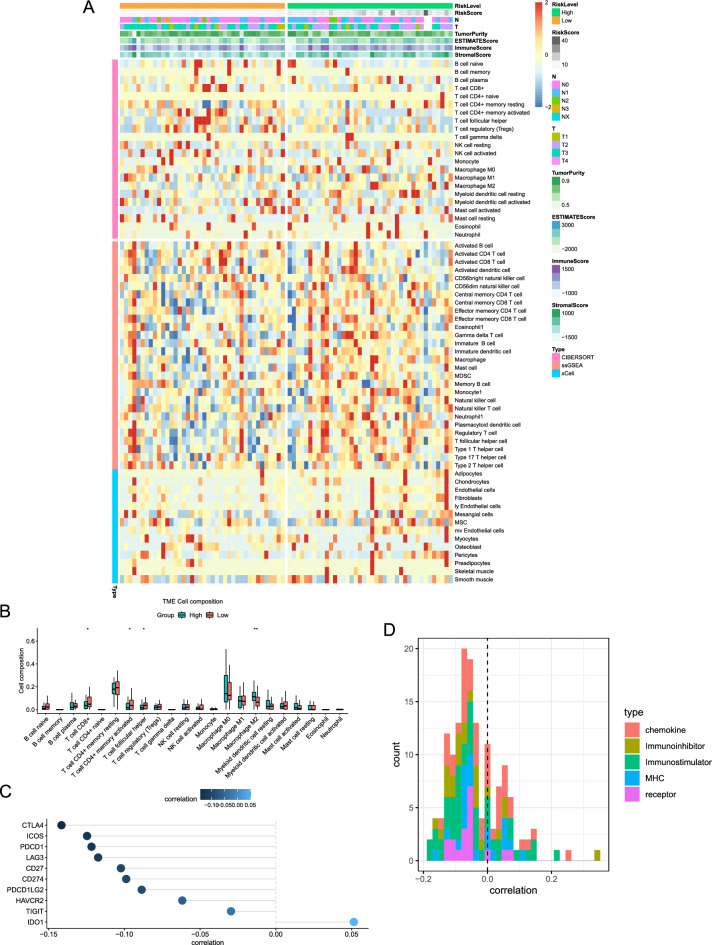
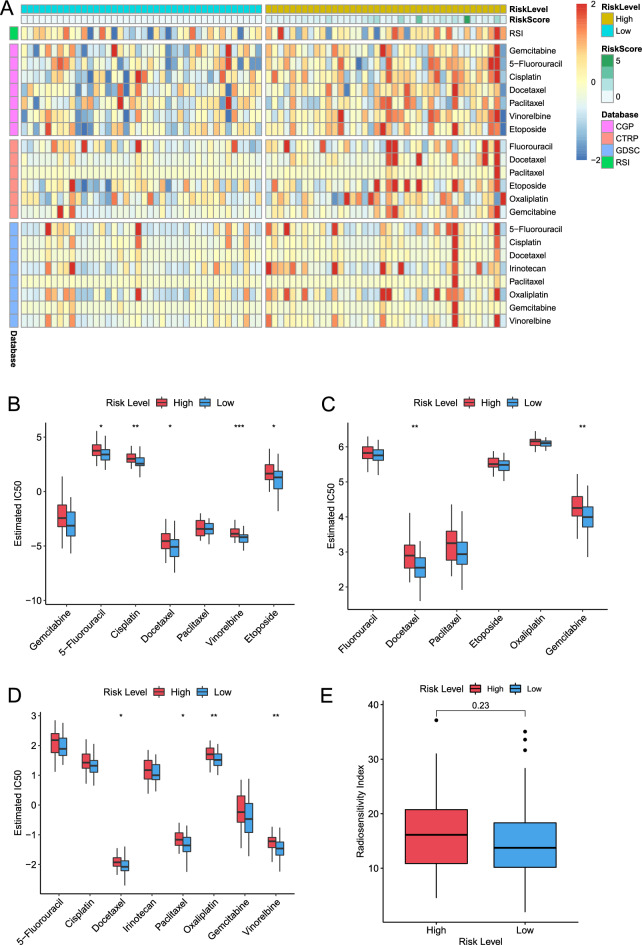
Esophageal squamous cell carcinoma (ESCC) has a dismal prognosis because of atypical early symptoms and heterogeneous therapeutic responses. 5-methylcytosine (m5C) modification plays an important role in the onset and development of many tumors and is widespread in long non-coding RNA (lncRNA) transcripts. However, the functions of m5C and lncRNAs in ESCC have not been completely elucidated. Herein, this study aimed to explore the role of m5C-related lncRNAs in ESCC. The RNA-seq transcriptome profiles and clinical information were downloaded from the TCGA-ESCC database. Pearson analysis was used to identify m5C-related lncRNAs. Then we established the m5C-related lncRNAs prognostic signature (m5C-LPS) using univariate Cox and least absolute shrinkage and selection operator (LASSO) regression analysis. Then, the prognostic value of m5C-LPS was evaluated internally and externally using the TCGA-ESCC and GSE53622 databases through multiple methods. We also detected the expression of these lncRNAs in ESCC cell lines and patient tissues. Fluorescence in situ hybridization (FISH) was used to detect the prognostic value of specific lncRNA. In addition, clinical parameters, immune status, genomic variants, oncogenic pathways, enrichment pathways, and therapeutic response features associated with m5C-LPS were explored using bioinformatics methods. We constructed and validated a prognostic signature based on 9 m5C-related lncRNAs (AC002091.2, AC009275.1, CAHM, LINC02057.1, AC0006329.1, AC037459.3, AC064807.1, ATP2B1-AS1, and UBAC2-AS1). The quantitative real-time polymerase chain reaction (qRT-PCR) revealed that most lncRNAs were upregulated in ESCC cell lines and patient tissues. And AC002091.2 was validated to have significant prognostic value in ESCC patients. A composite nomogram was generated to facilitate clinical practice by integrating this signature with the N stage. Besides, patients in the low-risk group were characterized by good clinical outcomes, favorable immune status, and low oncogenic alteration. Function enrichment analysis indicated that the risk score was associated with mRNA splicing, ncRNA processing, and DNA damage repair response. At the same time, we found significant differences in the responses to chemoradiotherapy between the two groups, proving the value of m5C-LPS in treatment decision-making in ESCC. This study established a novel prognostic signature based on 9 m5C-related lncRNAs, which is a promising biomarker for predicting clinical outcomes and therapeutic response in ESCC.
© 2023. Springer Nature Limited.
Conflict of interest statement
The authors declare no competing interests.
Figures


Similar articles
-
Novel chemokine related LncRNA signature correlates with the prognosis, immune landscape, and therapeutic sensitivity of esophageal squamous cell cancer.BMC Gastroenterol. 2023 Apr 20;23(1):132. doi: 10.1186/s12876-023-02688-5. BMC Gastroenterol. 2023. PMID: 37081402 Free PMC article.
-
Identification of a nomogram based on long non-coding RNA to improve prognosis prediction of esophageal squamous cell carcinoma.Aging (Albany NY). 2020 Jan 24;12(2):1512-1526. doi: 10.18632/aging.102697. Epub 2020 Jan 24. Aging (Albany NY). 2020. PMID: 31978896 Free PMC article.
-
A novel disulfidptosis-related LncRNA prognostic risk model: predicts the prognosis, tumor microenvironment and drug sensitivity in esophageal squamous cell carcinoma.BMC Gastroenterol. 2024 Nov 27;24(1):437. doi: 10.1186/s12876-024-03530-2. BMC Gastroenterol. 2024. PMID: 39604874 Free PMC article.
-
Current advances in the functional role of long non-coding RNAs in the oncogenesis and metastasis of esophageal squamous cell carcinoma: a narrative review.Transl Cancer Res. 2025 Mar 30;14(3):2150-2167. doi: 10.21037/tcr-24-1048. Epub 2025 Mar 27. Transl Cancer Res. 2025. PMID: 40224968 Free PMC article. Review.
-
Non‑coding RNA: A promising diagnostic biomarker and therapeutic target for esophageal squamous cell carcinoma (Review).Oncol Lett. 2024 Apr 9;27(6):255. doi: 10.3892/ol.2024.14388. eCollection 2024 Jun. Oncol Lett. 2024. PMID: 38646493 Free PMC article. Review.
Cited by
-
A Prognostic Model for Senescence-Related LncRNA in a Novel Colon Adenocarcinoma Based on WGCNA and LASSO Regression.Biomedicines. 2025 Apr 30;13(5):1088. doi: 10.3390/biomedicines13051088. Biomedicines. 2025. PMID: 40426916 Free PMC article.
-
A novel prognostic signature based on m5C‑related LncRNAs and its immunological characteristics in colon adenocarcinoma.Discov Oncol. 2025 Mar 17;16(1):332. doi: 10.1007/s12672-025-02081-6. Discov Oncol. 2025. PMID: 40095128 Free PMC article.
-
The role of m5C RNA modification in cancer development and therapy.Heliyon. 2024 Sep 27;10(19):e38660. doi: 10.1016/j.heliyon.2024.e38660. eCollection 2024 Oct 15. Heliyon. 2024. PMID: 39444404 Free PMC article. Review.
-
Identification of a novel cellular senescence-related lncRNA signature for prognosis and immune response in osteosarcoma.Transl Cancer Res. 2024 Jul 31;13(7):3742-3759. doi: 10.21037/tcr-24-163. Epub 2024 Jul 8. Transl Cancer Res. 2024. PMID: 39145087 Free PMC article.
References
Publication types
MeSH terms
Substances
LinkOut - more resources
Full Text Sources
Medical
