. 2023 Sep;55(9):1567-1578.
doi: 10.1038/s41588-023-01476-x. Epub 2023 Sep 4.

Symmetric inheritance of parental histones governs epigenome maintenance and embryonic stem cell identity

Affiliations

Symmetric inheritance of parental histones governs epigenome maintenance and embryonic stem cell identity

Alice Wenger et al. Nat Genet. 2023 Sep.

Abstract

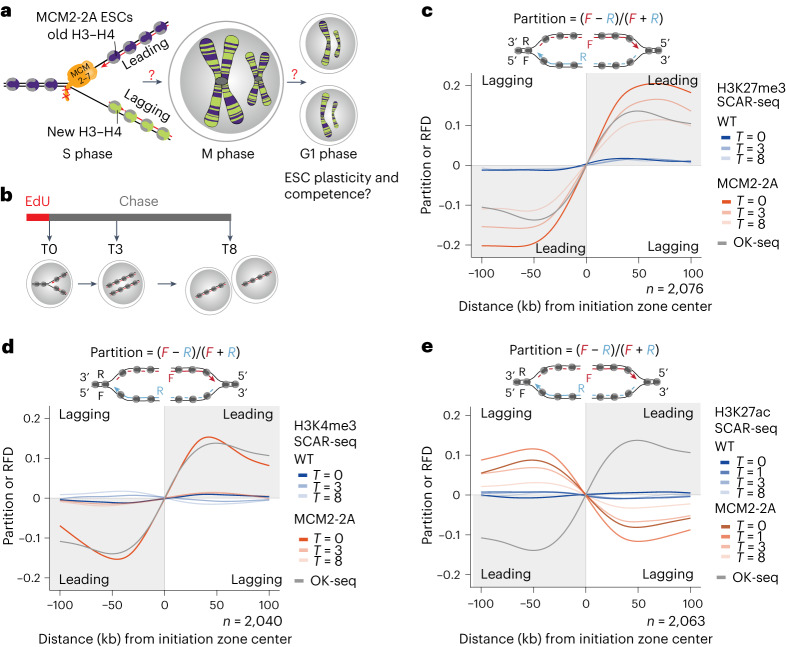
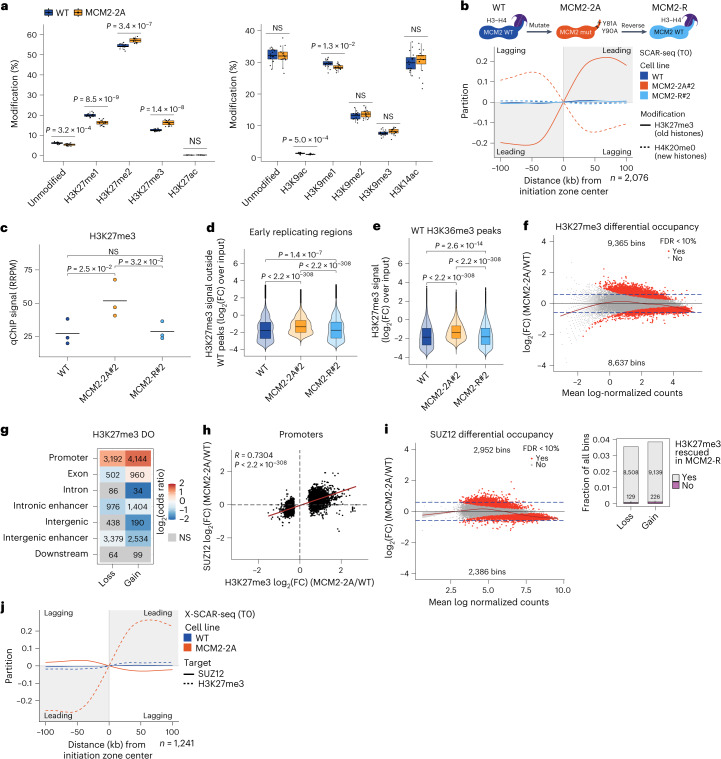
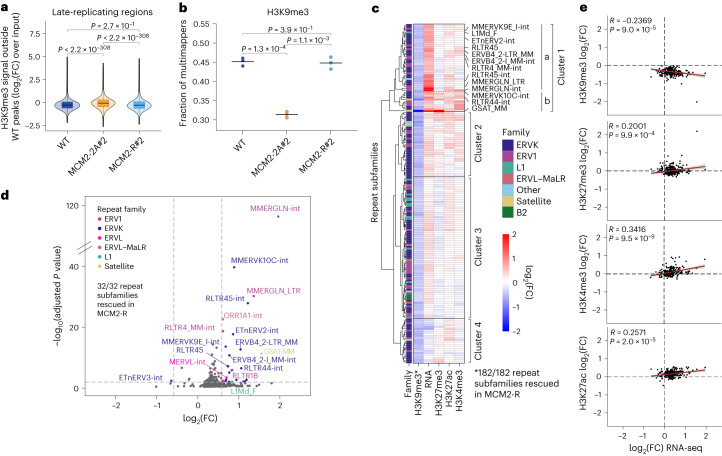
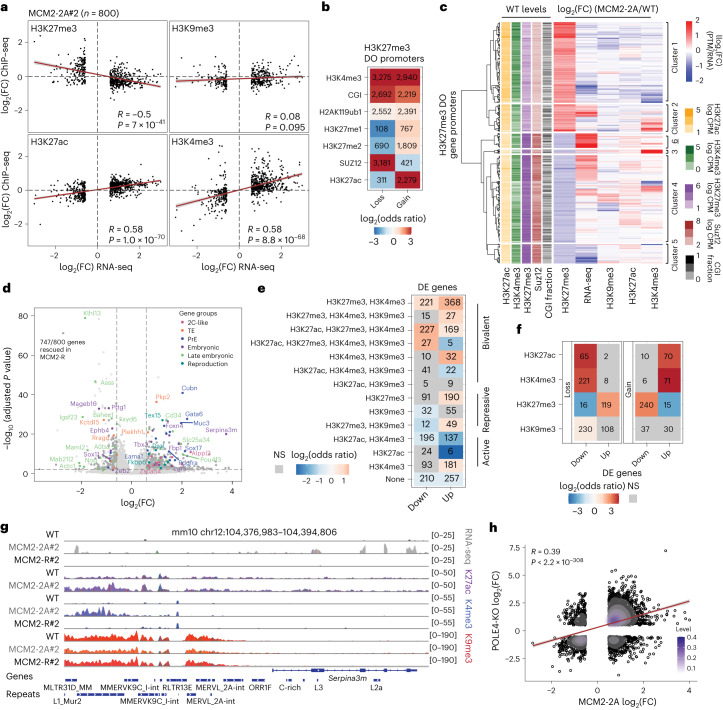
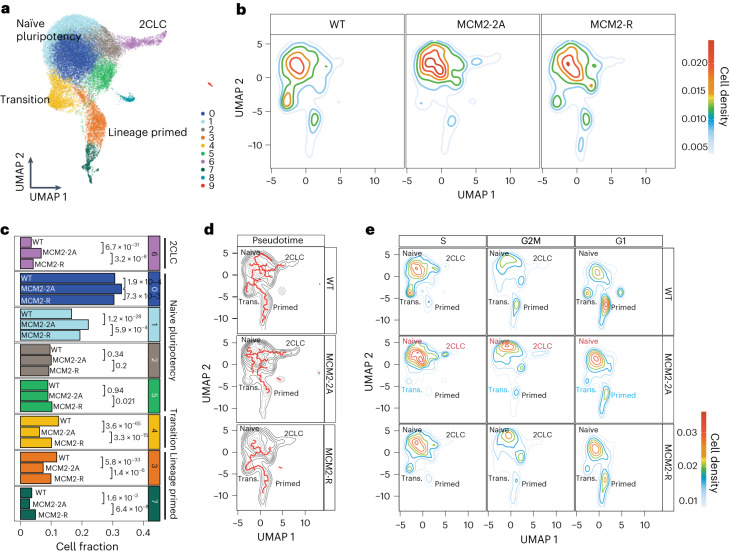
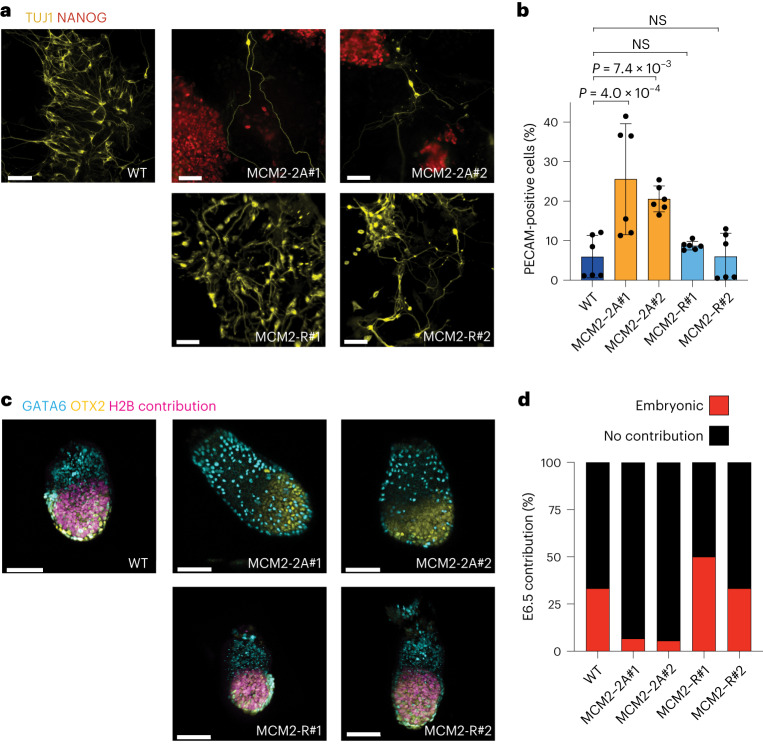
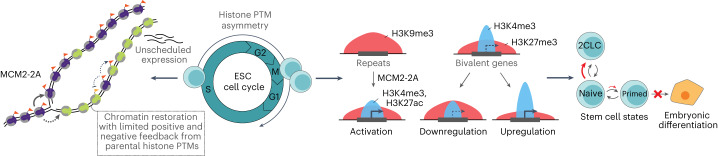
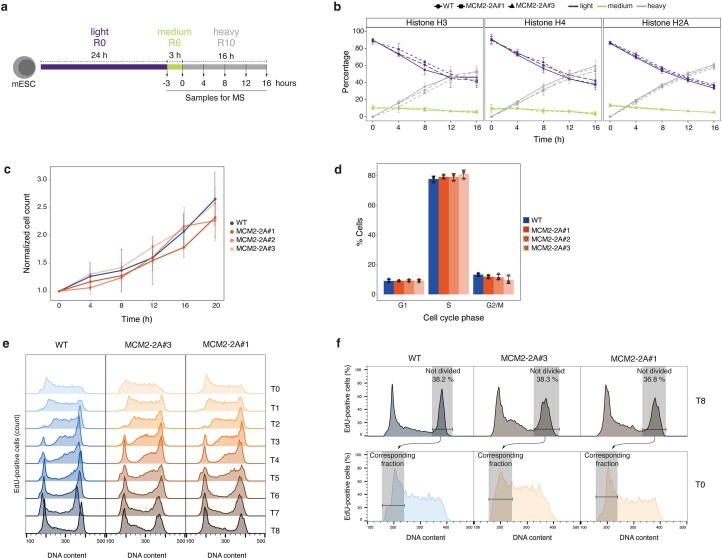
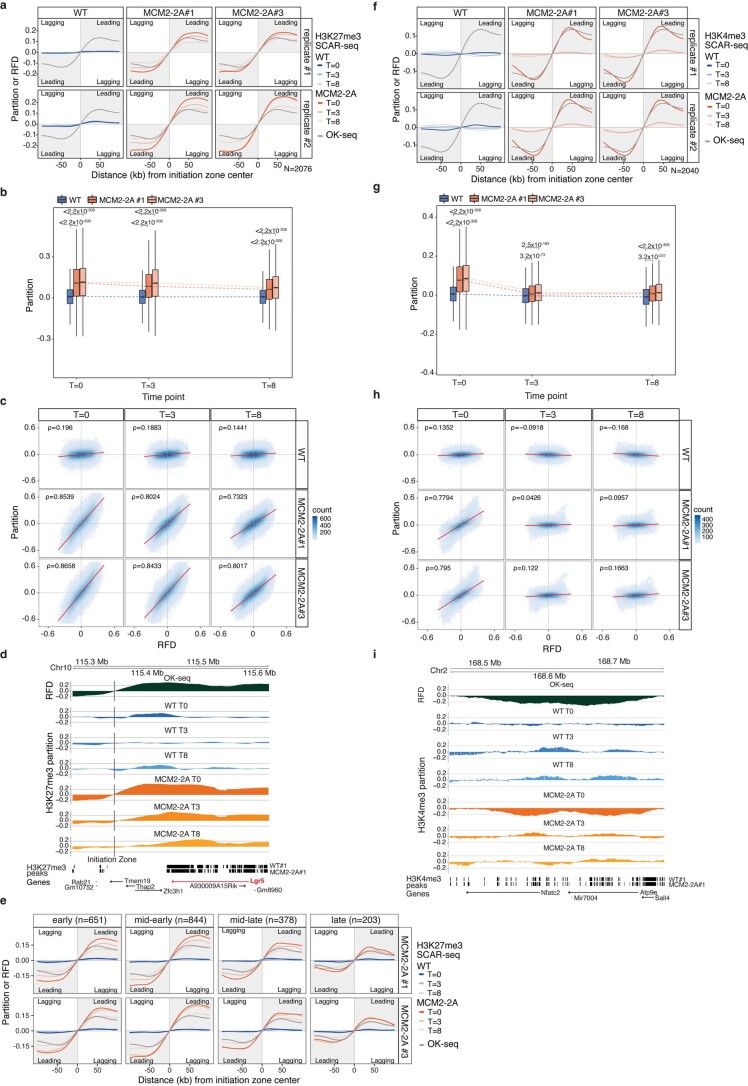
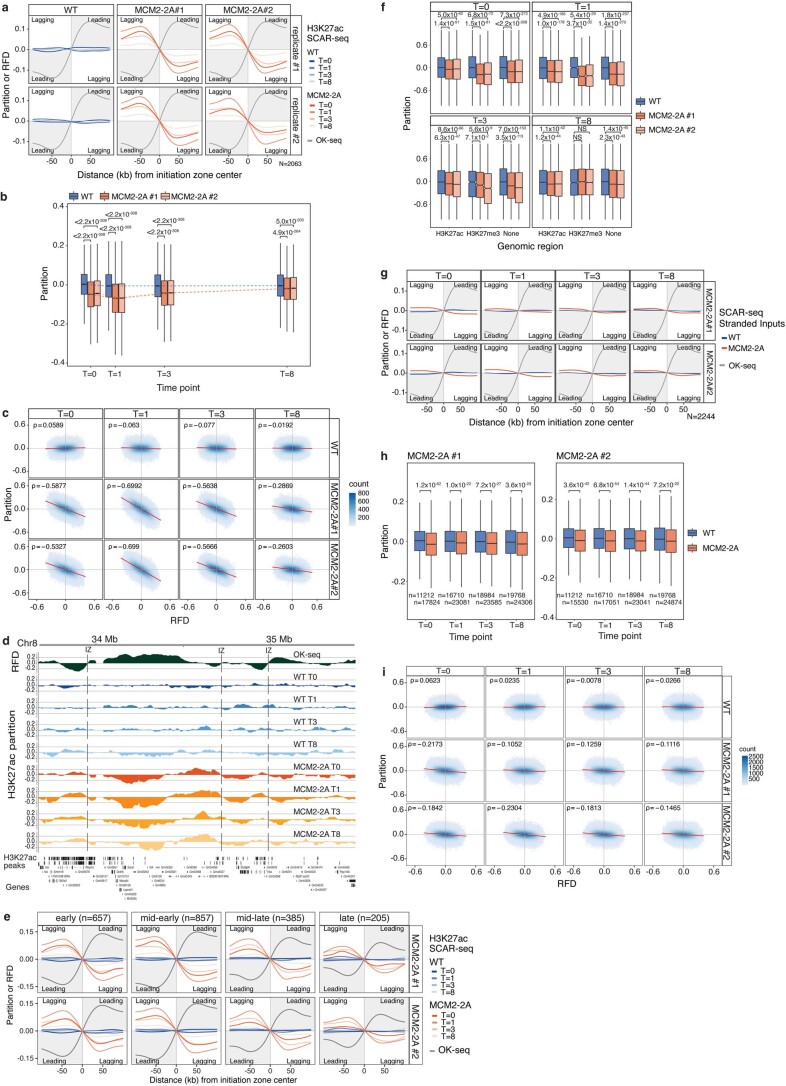
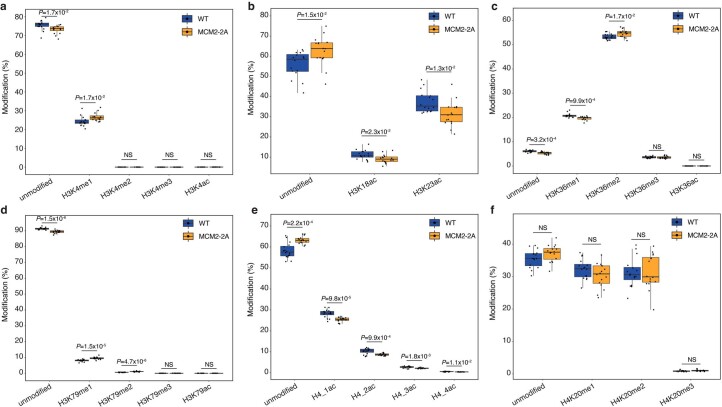
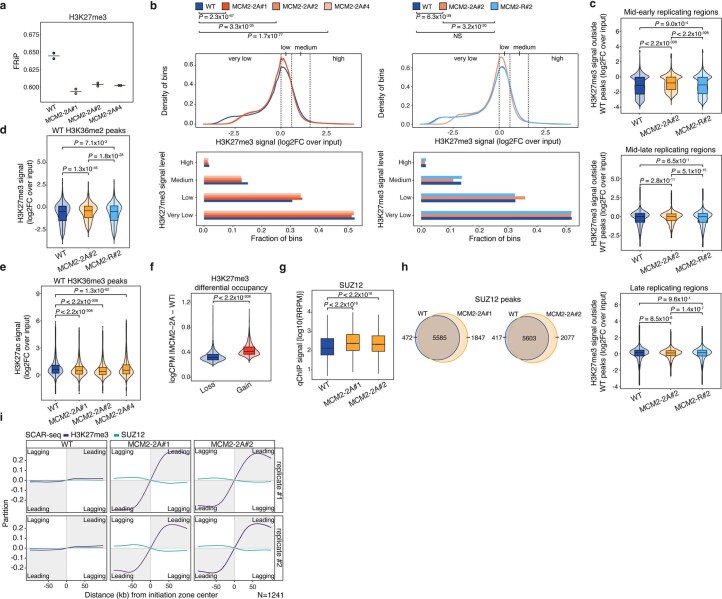
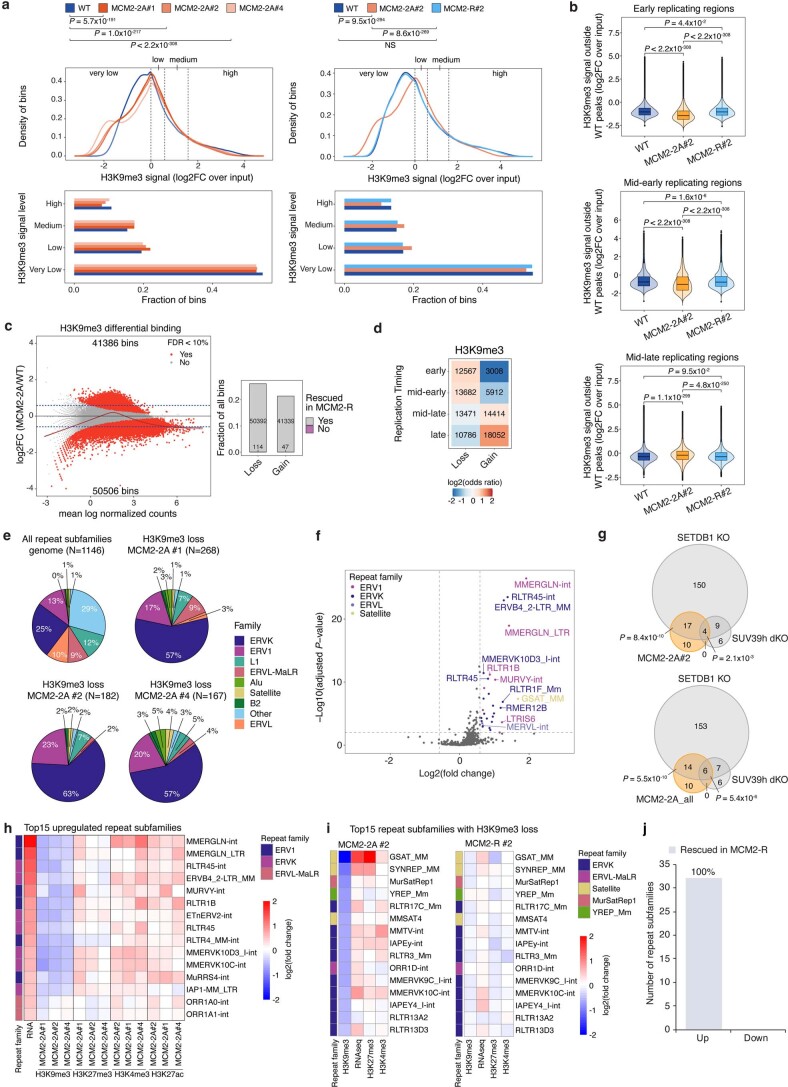
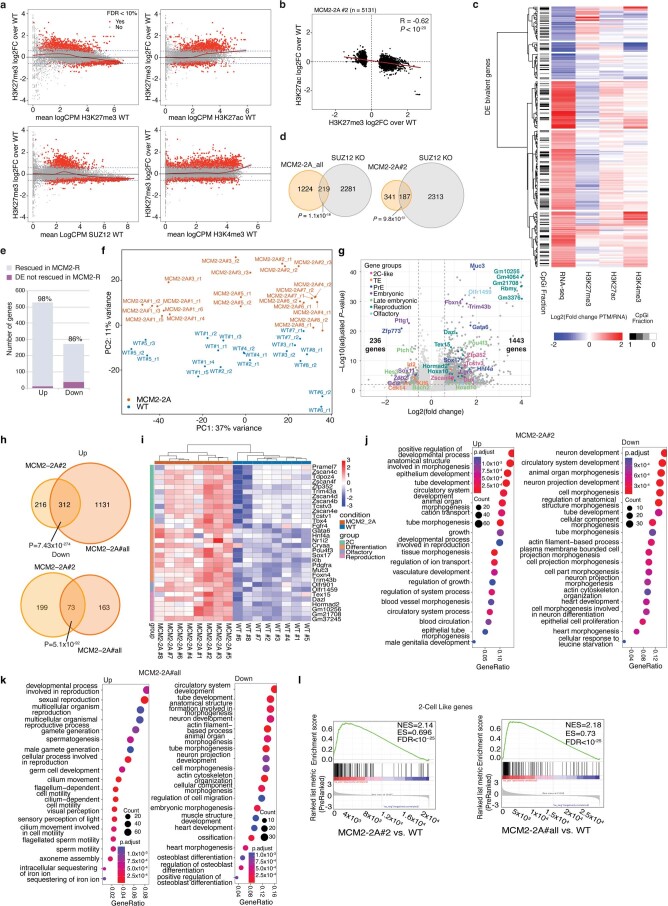
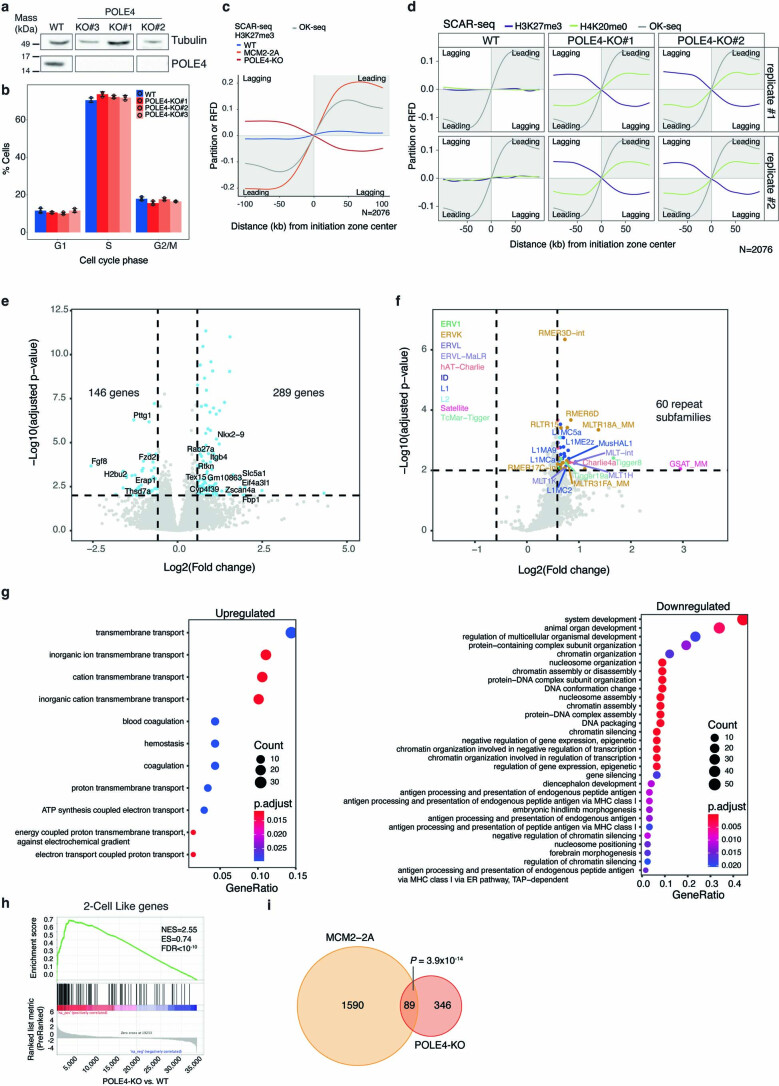
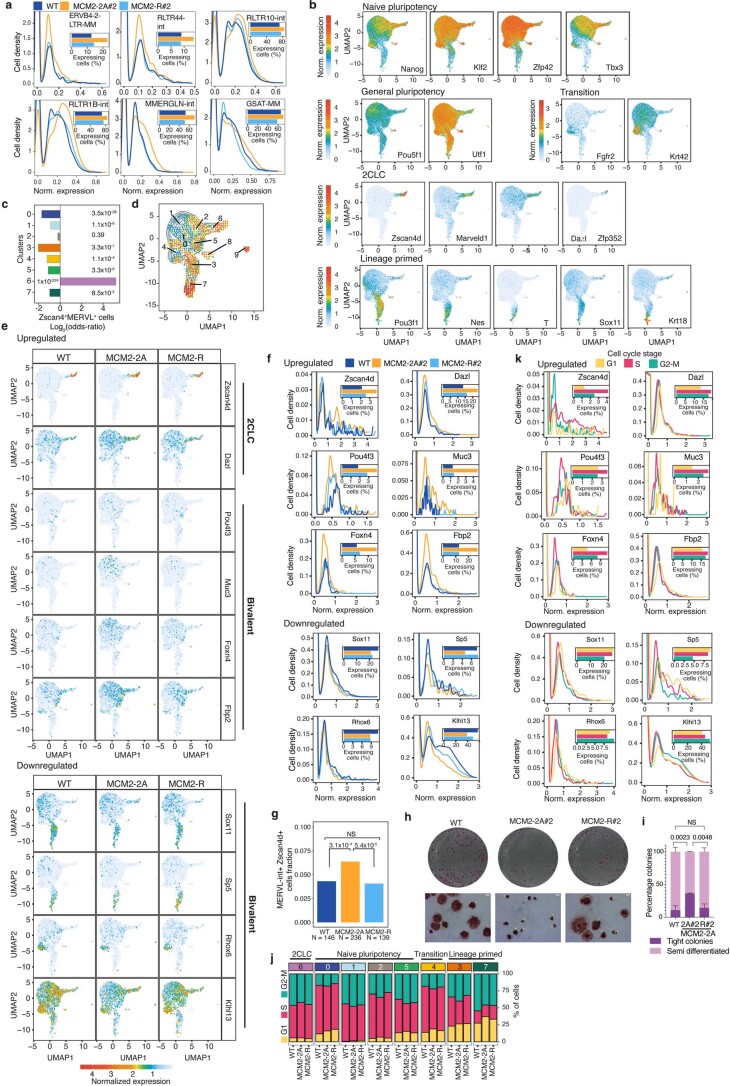
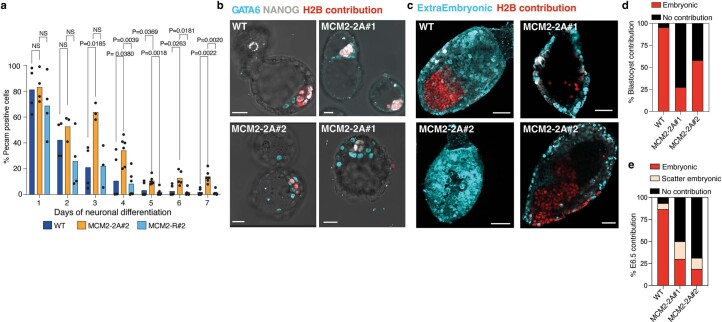
Modified parental histones are segregated symmetrically to daughter DNA strands during replication and can be inherited through mitosis. How this may sustain the epigenome and cell identity remains unknown. Here we show that transmission of histone-based information during DNA replication maintains epigenome fidelity and embryonic stem cell plasticity. Asymmetric segregation of parental histones H3-H4 in MCM2-2A mutants compromised mitotic inheritance of histone modifications and globally altered the epigenome. This included widespread spurious deposition of repressive modifications, suggesting elevated epigenetic noise. Moreover, H3K9me3 loss at repeats caused derepression and H3K27me3 redistribution across bivalent promoters correlated with misexpression of developmental genes. MCM2-2A mutation challenged dynamic transitions in cellular states across the cell cycle, enhancing naïve pluripotency and reducing lineage priming in G1. Furthermore, developmental competence was diminished, correlating with impaired exit from pluripotency. Collectively, this argues that epigenetic inheritance of histone modifications maintains a correctly balanced and dynamic chromatin landscape able to support mammalian cell differentiation.


Conflict of interest statement

A.G. is cofounder and CSO of Ankrin Therapeutics. V.S., M.V.A. and A.I. are cofounders of EpiQMAx GmbH. All other authors declare that they have no competing interests.

Figures

Fig. 1
Fig. 1. Symmetric segregation of parental histones is required for the balanced inheritance of histone PTMs to daughter cells.
a, Illustration of asymmetric segregation of parental histones H3–H4 to leading strand in MCM2-2A ESCs and how this could challenge histone PTM inheritance and daughter cell function. b, Design of SCAR-seq pulse-chase experiments. ce, Average SCAR-seq profiles of H3K27me3 (c), H3K4me3 (d) and H3K27ac (e) partition in 1-kb windows around replication initiation zones. Partition is calculated as the proportion of forward (F) and reverse (R) read counts ((F − R)/(F + R)). n = number of initiation zones. Replication fork directionality in WT cells measured by Okazaki fragment sequencing (OK-seq) is shown for comparison. The average of two biological replicates is shown (see Extended Data Figs. 2 and 3 for individual replicates in two MCM2-2A clones).
Fig. 2
Fig. 2. MCM2-2A cells show unscheduled H3K27me3 accumulation.
a, Global histone PTM levels quantified by mass spectrometry. n = biological replicates; WT#1 (n = 4), WT#2 (n = 4), WT#3 (n = 4), WT#4 (n = 4), MCM2-2A#1 (n = 4), MCM2-2A#3 (n = 4), MCM2-2A#4 (n = 4) and MCM2-2A#5 (n = 4). Two-sided t test. Lines indicate median, boxes represent first and third quartiles and whiskers extend 1.5× IQR. b, SCAR-seq profiles showing symmetric histone segregation in MCM2-R cells (as in Fig. 1). c, Global H3K27me3 levels measured by qChIP–seq. n = 3 biological replicates. Two-sided paired t test. d, H3K27me3 signal in 5-kb bins outside WT peaks in early replicating regions. n = 3 biological replicates. Two-sided Wilcoxon signed-rank test. Box plots as in a. e, H3K27me3 signal overlapping WT H3K36me3 peaks. n = 3 biological replicates. Two-sided Wilcoxon signed-rank test. Box plots as in a. f, H3K27me3 differential occupancy (DO) in MCM2-2A#2 versus WT in 5-kb bins overlapping H3K27me3 WT peaks (top) and bar plot showing rescue in MCM2-R 2 (bottom). Significant DO bins (red), False discovery rate (FDR) < 0.1, Bayes quasi-likelihood F test (Supplementary Methods). n = 3 biological replicates. g, Enrichment analysis (odds ratios) of H3K27me3 DO according to genome annotation. Significant states (P < 0.001, two-sided Fisher’s exact test) are colored according to enrichment (red) or depletion (blue), and NS states are shown in gray. n = number of bins. h, Correlation of H3K27me3 and SUZ12 DO at promoters with DO of H3K27me3 (n = 6,660). Two-sided Pearson’s correlation coefficient (R) with P value. Average of n = 3 biological replicates. i, SUZ12 DO in MCM2-2A 2 versus WT in 2.5-kb bins overlapping SUZ12 WT and MCM2-2A peaks. n = 3 biological replicates. Significant DO bins (red), FDR < 0.1, Bayes quasi-likelihood F test. j, Average crosslinked SCAR-seq profiles as in Fig. 1. IQR, interquartile range; NS, not significant. Source data
Fig. 3
Fig. 3. Unscheduled H3K9me3 gains in late-replicating regions and loss of H3K9me3-mediated repeat repression in MCM2-2A cells.
a, H3K9me3 ChIP–seq signal in 5-kb bins outside WT peaks focused on late-replicating regions. Two-sided Wilcoxon signed-rank test. b, Fraction of multimapping reads for H3K9me3 ChIP–seq. n = 3 biological replicates. Horizontal lines represent mean values. Two-sided paired t test. c, Repeat subfamilies with significant H3K9me3 loss in MCM2-2A#2, (n = 182 repeat subfamilies) FDR < 0.01, Wald test. Hierarchical clustering according to changes in H3K9me3, RNA, H3K27me3, H3K27ac and H3K4me3 levels between WT and MCM2-2A#2. Selected upregulated repeat subfamilies are labeled. *indicates the number of rescued H3K9me3 repeat subfamilies. d, Differential repeat expression between MCM2-2A#2 and WT. Significant subfamilies |log2(FC)| > 0.58, FDR < 0.01, Wald test (Supplementary Methods) are colored according to repeat family. n = 4 biological replicates. e, Correlation of RNA and histone PTM changes (log2(FC) MCM2-2A#2/WT) for repeat subfamilies with a significant change in RNA or histone PTMs (n = 124; FDR < 0.01). Two-sided Pearson’s correlation coefficient (R) with P value. Error bands, confidence intervals around the mean. FC, fold change.
Fig. 4
Fig. 4. Deregulation of H3K27me3 at bivalent promoters correlates with misexpression of developmental genes in MCM2-2A cells.
a, Correlation of RNA and histone PTM changes (log2(FC) MCM2-2A#2/WT) for DE genes (d, n = 800). Two-sided Pearson’s correlation coefficient (R) with P value. b, Enrichments (odds ratios) of chromatin feature overlapping H3K27me3 DO promoters. Significant enrichments (P < 0.001) are colored, and NS are in gray. Two-sided Fisher’s exact test. c, Hierarchical clustering of H3K27me3 DO promoters according to changes in H3K27me3, RNA, H3K9me3, H3K27ac, H3K4me3 between MCM2-2A#2 and WT. WT levels of H3K27ac, H3K4me3, H3K27me3, SUZ12 and CGI are included on the left. n = 3,170 H3K27me3 DO promoters. d, Differential gene expression between MCM2-2A#2 and WT cells. Significant genes are depicted in dark gray (FDR < 0.01 and |log2(FC)| > 0.58, Wald test), and nonrescued genes are depicted in light gray. Selected genes related to enriched GO terms are colored (Extended Data Fig. 7j). FC against FDR is shown per gene. n = 4 biological replicates. e, Enrichment (odds ratios) of chromatin states around transcription start sites (TSSs) of upregulated and downregulated genes. Significant enrichments are colored (log odds ratio; two-sided Fisher’s exact test, P < 0.05), and NS states are in gray. f, Histone PTM losses or gains (DO, FDR < 0.01) in DE gene promoters (from d). Significant enrichments (P ≤ 0.01; two-sided Fisher’s exact test) are colored, and NS states are in gray. g, Example region showing upregulation of the Serpina3m gene and repeats located within 10 kb, including RNA-seq, H3K27ac, H3K4me3 and H3K9me3 normalized signal. Chr12: 104376983–104394806. h, Correlation of gene expression changes (log2(FC) over WT) in POLE4-KO and MCM2-2A histone recycling mutants. Single genes and gene densities are represented by black circles and purple color gradient, respectively. Two-sided Pearson’s correlation coefficient (R) with P value. Source data
Fig. 5
Fig. 5. MCM2-2A mutation challenges cell-state transitions.
a, UMAP showing clustering analysis and annotations of WT, MCM2-2A and MCM2-R cells. b, WT, MCM2-2A and MCM2-R cells projected on the common UMAP. Colored lines represent cell density. c, Relative abundance of main subpopulations shown in a for each cell line. P values were derived from chi-square tests comparing cell counts for the clusters of interest with the cell counts of all other clusters. n = number of cells; WT (n = 15,181), MCM2-2A#2 (n = 15,488) examined over two biological replicates, MCM2-R#2 (n = 4487). d, Pseudotime analysis showing main trajectories between clusters. e, Cell-cycle-separated single cells projected on UMAP. Colored lines represent cell density.
Fig. 6
Fig. 6. MCM2-2A mutation impairs embryonic differentiation.
a, Representative immunofluorescence (IF) images of neuronal differentiation (day 7). Scale bar, 70 μm. b, Bar plots depicting mean ± standard deviation (s.d.) of PECAM-1-positive cells quantified by flow cytometry at day 7 of neuronal differentiation. One-way ANOVA statistical test. n = 6 biological replicates. Dots represent individual data points. c, Representative IF images of chimeric embryos from single-cell injected morulae dissected at E6.5. Scale bar, 50 μm. The images are stacks of multiple fields. d, Quantification of chimera contribution at E6.5. n = number of embryos; WT (n = 18), MCM2-2A#1 (n = 15), MCM2-2A#2 (n = 18), MCM2-R#1 (n = 20) and MCM2-R#2 (n = 15). ANOVA, analysis of variance. Source data
Fig. 7
Fig. 7. Model illustrating how asymmetric histone segregation challenges epigenome fidelity and ESC functionality.
H3–H4 asymmetry in MCM2-2A cells creates a lagging strand largely devoid of parental histone PTMs, which affects the accuracy of chromatin restoration and creates a permissive environment for unscheduled expression in every cell cycle. This broadly alters the histone PTM epigenome with both local and global changes in repressive modifications. MCM2-2A cells show loss of H3K9me3-based repeat repression, misregulation of H3K27me3 and bivalent genes, and reduced ESC plasticity and embryonic differentiation. Naïve, naïve pluripotency; primed, lineage-primed states; new histones, green; parental histones, purple.
Extended Data Fig. 1
Extended Data Fig. 1. Histone dynamics and cell cycle progression in MCM2-2A mESCs.
a, Experimental setup for pulse-SILAC MS analysis of new histone incorporation and old histone dilution kinetics. b, Relative levels of old histones (purple), new pulse-labeled histones (green) and new steady-state labeled (gray) histones over time. Mean ± s.d. of n = 3 biological replicates is shown. c, Growth curves of WT and three MCM2-2A mESC clones. Cell counts are shown relative to the first time point. Mean ± s.d. of n = 3 biological replicates is shown. d, Cell-cycle analysis of WT and three MCM2-2A clones. The fraction of cells in G1-, S- and G2/M-phase was determined by flow cytometry analysis of DNA content and EdU labeling. Mean ± s.d. of n = 3 biological replicates is shown, dots depict individual data points. e, Flow cytometry analysis showing that cell cycle progression of EdU-labeled cells is similar in WT and two MCM2-2A clones. Cells were pulsed with EdU for 15 min and harvested immediately (T0) or at the indicated time points (T1-T8). Note that most labeled cells have divided at the 8-hour time point. Data are representative of n = 2 biological replicates. f, Quantification of EdU-labeled cells which have not divided at the 8-hour timepoint in e. This represents the cells labeled by EdU in early S. Source data
Extended Data Fig. 2
Extended Data Fig. 2. Histone H3K27me3 asymmetry is inherited by MCM2-2A daughter cells, but H3K4me3 asymmetry is rapidly resolved.
a, Individual biological replicates of H3K27me3 SCAR-seq profiles related to Fig. 1c, including two MCM2-2A clones. SCAR-seq is represented as in Fig. 1. b, Box plots of H3K27me3 partition in 1 kb windows around the RFD extrema (distance of 10-90 kb from initiation zones). Windows upstream of initiation zones were multiplied by -1. Box plots as in Fig. 2a. Dashed lines illustrate trends of partition changes over time. Significance was tested per time point and replicate between WT and MCM2-2A using two-sided paired Wilcoxon signed-rank test. c, Scatter plots of H3K27me3 SCAR-seq partition and RFD show association between histone segregation and replication fork directionality. Two-sided Spearman’s rank correlation coefficient. d, Example region of H3K27me3 SCAR-seq in WT and MCM2-2A#1 and RFD containing a differentially expressed gene (Lgr5; Fig. 4d, Extended Data Fig. 7g). Chr10:115272208-115624981. e, H3K27me3 SCAR-seq profiles separated according to replication timing, showing that asymmetry at T8 is independent of replication timing. As all cells labeled in mid and late S phase have divided at T8 (Extended Data Fig. 1f), asymmetry is transmitted to daughter cells. Average profiles of RFD and H3K27me3 are represented as in Fig. 1. RFD amplitudes and thus also SCAR-seq amplitudes are lower around late compared to early initiation zones due to more heterogenous replication fork progression across the cell population, but the relative differences between the amplitudes are similar across the replication timing categories. be, The average of n = 2 biological replicates is shown for each clone. f, Individual biological replicates of H3K4me3 SCAR-seq related to Fig. 1d, including two MCM2-2A clones. SCAR-seq is shown as in Fig. 1. g, Box plots of H3K4me3 partition in 1 kb windows around the RFD extrema (distance of 10-90 kb from initiation zones) as in b. h, Scatter plots of H3K4me3 SCAR-seq partition and RFD show association between histone segregation and replication fork directionality as in c. i, Example region of H3K4me3 SCAR-seq in WT and MCM2-2A#1 and RFD containing a highly expressed pluripotency gene (Sall4). Chr2:168450809-168783596. g-i, The average of n = 2 biological replicates is shown.
Extended Data Fig. 3
Extended Data Fig. 3. Persistent genome-wide H3K27ac asymmetry biased towards the lagging strand in MCM2-2A cells.
a, Individual biological replicates of H3K27ac SCAR-seq related to Fig. 1e, including two MCM2-2A clones. SCAR-seq is represented as in Fig. 1. b, Box plots of H3K27ac partition in 1 kb windows around the RFD extrema (distance of 10–90 kb from initiation zones) as in Extended Data Fig. 2b. c, Scatter plots of H3K27ac SCAR-seq partition and RFD showing negative correlation between histone H3K27ac and replication fork directionality, demonstrating a lagging strand bias. Two-sided Spearman’s rank correlation coefficient. d, Example region of H3K27ac SCAR-seq in WT and MCM2-2A#1 clones and RFD containing genic and non-genic regions. Chr8:33670000-35487509. e, H3K27ac SCAR-seq profiles separated according to replication timing (as in Extended Data Fig. 2e) showing H3K27ac asymmetry at T8 at early, mid-early, mid-late and late replicating regions. f, H3K27ac asymmetry is present genome-wide in MCM2-2A cells. Box plots of H3K27ac SCAR-seq in 1 kb windows overlapping H3K27ac and H3K27me3 peaks or neither of the two. Box plots as in Fig. 2a. g, Slight increase in lagging strand accessibility in MCM2-2A cells, indicated by lagging strand bias of MNase inputs. Average profiles of stranded inputs in 1 kb windows around replication initiation zones. Partition is calculated as the proportion of forward (F) and reverse (R) read counts. RFD in WT cells measured by Okazaki fragment sequencing (OK-seq) is shown for comparison. h, Box plot of stranded input profiles shown in (g) in 1 kb windows around the RFD extrema (distance of 15–75 kb from initiation zones). Box plots as in Fig. 2a. i, Scatter plots of stranded inputs and RFD showing negative correlation between MNase accessibility and replication fork directionality in MCM2-2A cells, demonstrating a slight lagging strand bias. Two-sided Spearman’s rank correlation coefficient is shown in the top left corner. b-i, The average of n = 2 biological replicates is shown.
Extended Data Fig. 4
Extended Data Fig. 4. Global levels of H3-H4 modifications.
a-f, Box plots showing relative levels of H3K4 methylation and acetylation (a), H3K18 and H3K23 acetylation (b), H3K36 methylation (c), H3K79 methylation and acetylation (d), H4K5/8/12/16 acetylation (e), and H4K20 methylation (f). Histone modifications were quantified by mass spectrometry in WT and MCM2-2A cells growing asynchronously. WT#1 (n = 4), WT#2 (n = 4), WT#3 (n = 4), WT#4 (n = 4), MCM2-2A#1 (n = 4), MCM2-2A#3 (n = 4), MCM2-2A#4 (n = 4), MCM2-2A#1 (n = 4); n = biological replicates. Lines represent median, boxes represent the 1st and 3rd quartiles, whiskers extend 1.5x interquartile range (IQR), dots depict individual data points. Two-sided Welch’s t-test FDR. Source data
Extended Data Fig. 5
Extended Data Fig. 5. Global increase of H3K27me3 and SUZ12 levels in MCM2-2A.
a, Fraction of reads in peaks (FRiP) as quality control for H3K27me3 ChIP-seq peaks. Fewer reads fall into peaks in MCM2-2A clones compared to WT cells, indicating that peak calling for H3K27me3 is affected in MCM2-2A (n = 2 biological replicates for each clone). b, Density plots (top) showing distribution of H3K27me3 signal in genome-wide 5-kb bins. Two-sided Wilcoxon signed-rank test P values. Bar plots (bottom) showing quantification of bins in the indicated signal categories. Three MCM2-2A clones (left; average of n = 2 biological replicates) and MCM2-R cells (right; average of n = 3 biological replicates) demonstrate similar trends across mutant clones and rescue of signal redistribution upon restoration of symmetric recycling. c, Violin plots showing H3K27me3 signal in bins non-overlapping WT peaks in early, mid-early, mid-late and late replicating regions, related to Fig. 2d. Two-sided Wilcoxon signed-rank test P values. n = 3 biological replicates. d, Violin plot showing H3K27me3 signal in 5 kb bins overlapping WT H3K36me2 peaks. Two-sided Wilcoxon signed-rank test P values. n = 3 biological replicates. e, Violin plot showing H3K27ac signal in 2.5-kb bins overlapping WT H3K36me3 peaks. Two-sided Wilcoxon signed-rank test P values. n = 2 biological replicates. f, Violin plot showing absolute differences in H3K27me3 signal between WT and MCM2-2A in bins of H3K27me3 gains and H3K27me3 losses. Two-sided Wilcoxon signed-rank test P values. n = 3 biological replicates. Related to Fig. 2f. g, Increased SUZ12 binding to chromatin in MCM2-2A cells shown by box plots of mean SUZ12 levels in 1 kb windows of SUZ12 peaks quantified by qChIP-seq. Two-sided Wilcoxon signed-rank test P values. n = 3 biological replicates. c-g, Box plots as in Fig. 2a. h, Venn diagrams illustrating strong overlap of SUZ12 peaks in WT, MCM2-2A#1 and MCM2-2A#2 clones (n = 3 biological replicates). i, Individual SUZ12 SCAR-seq replicates related to Fig. 2j, including two MCM2-2A clones. H3K27me3 SCAR-seq was performed in parallel as control for crosslinked SCAR-seq. SCAR-seq is represented as in Fig. 1.
Extended Data Fig. 6
Extended Data Fig. 6. H3K9me3 loss and repeat activation in MCM2-2A.
a, Density plot showing H3K9me3 signal distribution in genome-wide 5-kb bins (top). Two-sided Wilcoxon signed-rank test P values. Quantification of bins across signal categories (bottom). Three MCM2-2A clones (left; average of n = 2 biological replicates) demonstrate similar trends across clones and rescue in MCM2-R (right; average of n = 3 biological replicates) b, H3K9me3 signal in bins non-overlapping WT peaks across replication timing, related to Fig. 3a. Two-sided Wilcoxon signed-rank test P values. n = 3 biological replicates. Box plots as in Fig. 2a. c, H3K9me3 differential occupancy (DO) in MCM2-2A#2 versus WT in 5-kb bins overlapping H3K9me3 WT peaks (left) and bar plot showing rescue in MCM2-R#2 (right). Significant DO (red), FDR < 0.1, Bayes quasi-likelihood F-test (see Supplementary Methods). n = 3 biological replicates. d, Enrichments analysis (odds ratios) of H3K9me3 DO according to replication timing. Significant states (P value < 0.001, two-sided Fisher’s exact test) are colored according to enrichment (red) or depletion (blue), NS states are shown in gray. n = number of bins. e, Repeat subfamilies with significant loss of H3K9me3 in three MCM2-2A clones (FDR < 0.01, Wald test). f, Differential repeat expression between MCM2-2A and WT cells. Significant subfamilies (|Log2FC|> 0.58, adjusted P value < 0.01, Wald test) are colored according to repeat family. Fold change (FC) against FDR is shown per repeat subfamily. n = biological replicates; WT#1 (n = 5); WT#2, WT#3, WT#4, WT#6, WT#7, WT#8, MCM2-2A#4, MCM2-2A#5, MCM2-2A#6, MCM2-2A#7, MCM2-2A#8 (n = 2); WT#5, MCM2-2A#2, MCM2-2A#3 (n = 3); MCM2-2A#1 (n = 6). g, Overlap of upregulated repeat subfamilies between MCM2-2A#2 (top) or all MCM2-2A clones (bottom) and SETDB1-KO and SUV39h1/2-dKO. One-sided hypergeometric test P values. h, i, Heatmap showing relative H3K9me3, H3K27me3, H3K4me3, H3K27ac levels; h, for three MCM2-2A clones at the top 15 significantly upregulated repeat subfamilies from f. i, Top 15 repeat subfamilies with significant loss of H3K9me3, FDR < 0.01, Wald test. Related to Fig. 3c. j, Bar plot showing differentially expressed repeat subfamilies related to Fig. 3d rescued (gray) in MCM2-R. MCM2-2A had n = 32 upregulated repeat subfamilies and all repeat expression was rescued. Source data
Extended Data Fig. 7
Extended Data Fig. 7. H3K27me3 changes at gene promoters correlate with differential gene expression in MCM2-2A cells.
a, MA plots showing H3K27me3 DO in MCM2-2A#2 relative to the H3K27me3, SUZ12, H3K27ac and H3K4me3 signal in WT cells. H3K27me3 DO was analyzed in 5-kb bins overlapping H3K27me3 WT promoters and H3K27me3, SUZ12, H3K27ac and H3K4me3 signal is depicted as mean log2 counts per million (CPM). n = 3 biological replicates. b, Correlation of H3K27me3 and H3K27ac DO at promoters with DO of H3K27me3 (n = 5131 DO H3K27me3 bins). Two-sided Pearson’s product moment correlation coefficient. c, Hierarchical clustering of differentially expressed (DE) genes bivalent promoters (MCM2-2A#2; n = 244) according to changes in RNA, H3K27me3, H3K9me3, H3K27ac and H3K4me3 between MCM2-2A#2 and WT. d, Overlap of upregulated genes between all MCM2-2A clones (left; MCM2-2A#all, see g) or MCM2-2A#2 (right) with SUZ12-KO DE genes. One-sided hypergeometric test P values. e, Bar plot showing number of DE genes in MCM2-2A rescued (gray) or not rescued (purple) in MCM2-R, related to Fig. 4d. Percentage of rescued genes are indicated. f, PCA plot showing a shared expression deviation of 8 MCM2-2A clones (orange) from 8 WT clones (blue) based on all expressed genes in MCM2-2A and WT. n = biological replicates; WT#1 (n = 5);WT#2, WT#3, WT#4, WT#6, WT#7, WT#8, MCM2-2A#4, MCM2-2A#5, MCM2-2A#6, MCM2-2A#7, MCM2-2A#8 (n = 2); WT#5, MCM2-2A#2, MCM2-2A#3 (n = 3); MCM2-2A#1 (n = 6). g, Differential expression analysis of WT and MCM2-2A clones in f. Selected gene are in color as indicated. Significant genes (| log2 FC | > 0.58, FDR < 0.01, Wald test) are in dark gray. FC against FDR is shown per gene in MCM2-2A versus WT. h, Overlap of DE genes between MCM2-2A#2 (see Fig. 4d) and MCM2-2A#all (see g). One-sided hypergeometric test P values. i, Heatmaps showing relative expression of selected differentially expressed genes in each of the analyzed clones. Values depict log2FC from the average of all samples. j-k, Dot plot of GO term enrichment analysis in the upregulated and downregulated MCM2-2A#2 genes (j) or MCM2-2A#all (k) (Related to Fig. 4d and g, respectively). l, 2C-like genes are enriched both in MCM2-2A#2 (left, see Fig. 4d) and in the shared MCM2-2A#all (right, see g) upregulated genes in gene set enrichment analysis (GSEA).
Extended Data Fig. 8
Extended Data Fig. 8. POLE4-KO ESCs shared expression changes with MCM2-2A.
a, Western blot analysis of POLE4-KO clones. b, Cell cycle distribution in three POLE4-KO ESC clones is similar to WT. Bar plot shows the fraction of cells in G1, S and G2/M phase based on flow cytometry analysis of DNA content and EdU labeling. Mean ± s.d. of n = 3 biological replicates is shown, dots depict individual data points. c, SCAR-seq profiles of H3K27me3 in POLE4-KO, MCM2-2A and WT cells represented as in Fig. 1. d, SCAR-seq analysis of nascent chromatin showing lagging strand bias of old histones (H3K27me3) and leading strand bias of new histones (H4K20me0) in two independent POLE4-KO clones. SCAR-seq average profiles are shown as in Fig. 1. e, Volcano plot showing differential expression analysis. FC against FDR is shown per gene in POLE4-KO versus WT. Significant genes | log2 FC | > 0.58, FDR < 0.01, Wald test, are depicted in light blue. n = biological replicates; WT#1 (n = 3), POLE4-KO#1 (n = 3), POLE4-KO#2 (n = 3), POLE4-KO#3 (n = 3). f, Volcano plot showing differential repeat expression between POLE4-KO to WT. FC against FDR is shown per repeat subfamily-n. Significant subfamilies | Log2FC|> 0.58, FDR < 0.01, Wald test, are colored according to repeat family. n as in e. g, Dot plot of GO term enrichment analysis of biological processes in the downregulated genes and upregulated genes. h, Gene set enrichment analysis (GSEA) of 2C-like genes among POLE4-KO upregulated genes. i, Venn diagram illustrating overlaps of DE genes in POLE4-KO and MCM2-2A cells. P-values, one-sided hypergeometric test. Source data
Extended Data Fig. 9
Extended Data Fig. 9. Timely transitions in cellular states are impaired in MCM2-2A cells.
a, Expression values and cell quantifications for selected repeats DE in the total RNA-seq. Positive WT, MCM2-2A#2 and MCM2-R#2 cells are depicted in bar plot. b, UMAP embedding showing expression of gene markers used to classify ESC subpopulation clusters (see Fig. 5a). c, Enrichment of Zscan4 and MERVL double positive cells across the single cell clusters, related to Fig. 5a. d, Velocity plot for combined population of all 3 cell lines based on splicing kinetics showing the transcriptional dynamics intrinsic to the trajectories between the different clusters. e, WT, MCM2-2A#2 and MCM2-2A-R#2 cells projected on the common UMAP, showing the expression of selected gene markers, bivalent and 2CLC genes DE in total RNA-seq. Bivalent upregulated genes are over-represented in the naïve pluripotency cluster region. f, Density plots for genes from e across cells in WT, MCM2-2A#2 and MCM2-R#2 clones. Plots as in a. g, Cells double positive for Zscan4 and MERVL expression in WT, MCM2-2A and MCM2-R. Chi-square tests P values comparing cell counts for each cell line. h, Representative images of l 6-wells containing alkaline phosphatase-stained colonies from WT, MCM2-2A#2 and MCM2-R#2 cells. Zoom-in bright-field images (below). Scale bar = 1 mm. Yellow asterisks, tight undifferentiated colonies. i, Quantification of colonies from (h). Mean percentages are represented with ±s.d., n = 3 biological replicates. One-way ANOVA statistical test P values. j, Cell cycle distribution of single cells in each of the clusters in WT, MCM-2A and MCM2-R displayed as relative cell amount (that is, percentage). Note that the relative cell cycle distribution does not provide information on the total number of cells in each cluster. k, Density plots showing expression values and cell quantifications for genes from e across all analyzed cells (MCM2-2A, WT and MCM2-R) in the different cell cycle phases G1, S and G2/M. Positive cells in the cell cycle phases G1, S and G2/M are depicted in a bar plot. Source data
Extended Data Fig. 10
Extended Data Fig. 10. MCM2-2A mutation impairs differentiation in vitro and in vivo.
a, Bar plots representing the mean of PECAM-1 positive cells quantified by flow cytometry in a 7-day time course of neuronal differentiation. Dots depict individual data points. n = 6 biological repeats. Two-way ANOVA Statistical test P values. b, c, Representative IF images of chimeric embryos from 4-cell injected morulae cultured until the hatched blastocyst stage in vitro equivalent of E4.5 (b, scale bar, 20 µm) and injected morula at E6.5 (c, scale bar 50 µm). (c) Images on the left are stacks of multiple fields, images on the right are individual optical sections. Top left and bottom right show embryonic contribution, top right shows scatter embryonic contribution and bottom left image shows an example of no contribution as quantified in d. d, Quantification of chimera contribution at blastocyst stage from 4-cell injections. n = number of embryos; 21, 22, 19, left to right. e, Quantification of chimera contribution at E6.5 from 4-cell injections. n = number of embryos; 15, 10, 16, left to right. Source data

Similar articles

Cited by

  • DNA polymerase delta governs parental histone transfer to DNA replication lagging strand.
    Tian C, Zhang Q, Jia J, Zhou J, Zhang Z, Karri S, Jiang J, Dickinson Q, Yao Y, Tang X, Huang Y, Guo T, He Z, Liu Z, Gao Y, Yang X, Wu Y, Chan KM, Zhang D, Han J, Yu C, Gan H. Tian C, et al. Proc Natl Acad Sci U S A. 2024 May 14;121(20):e2400610121. doi: 10.1073/pnas.2400610121. Epub 2024 May 7. Proc Natl Acad Sci U S A. 2024. PMID: 38713623 Free PMC article.
  • The length of the G1 phase is an essential determinant of H3K27me3 landscapes across diverse cell types.
    Trouth A, Ravichandran K, Gafken PR, Martire S, Boyle GE, Veronezi GMB, La V, Namciu SJ, Banaszynski LA, Sarthy JF, Ramachandran S. Trouth A, et al. PLoS Biol. 2025 Apr 17;23(4):e3003119. doi: 10.1371/journal.pbio.3003119. eCollection 2025 Apr. PLoS Biol. 2025. PMID: 40245079 Free PMC article.
  • Longevity biotechnology: bridging AI, biomarkers, geroscience and clinical applications for healthy longevity.
    Lyu YX, Fu Q, Wilczok D, Ying K, King A, Antebi A, Vojta A, Stolzing A, Moskalev A, Georgievskaya A, Maier AB, Olsen A, Groth A, Simon AK, Brunet A, Jamil A, Kulaga A, Bhatti A, Yaden B, Pedersen BK, Schumacher B, Djordjevic B, Kennedy B, Chen C, Huang CY, Correll CU, Murphy CT, Ewald CY, Chen D, Valenzano DR, Sołdacki D, Erritzoe D, Meyer D, Sinclair DA, Chini EN, Teeling EC, Morgen E, Verdin E, Vernet E, Pinilla E, Fang EF, Bischof E, Mercken EM, Finger F, Kuipers F, Pun FW, Gyülveszi G, Civiletto G, Zmudze G, Blander G, Pincus HA, McClure J, Kirkland JL, Peyer J, Justice JN, Vijg J, Gruhn JR, McLaughlin J, Mannick J, Passos J, Baur JA, Betts-LaCroix J, Sedivy JM, Speakman JR, Shlain J, von Maltzahn J, Andreasson KI, Moody K, Palikaras K, Fortney K, Niedernhofer LJ, Rasmussen LJ, Veenhoff LM, Melton L, Ferrucci L, Quarta M, Koval M, Marinova M, Hamalainen M, Unfried M, Ringel MS, Filipovic M, Topors M, Mitin N, Roy N, Pintar N, Barzilai N, Binetti P, Singh P, Kohlhaas P, Robbins PD, Rubin P, Fedichev PO, Kamya P, Muñoz-Canoves P, de Cabo R, Faragher RGA, Konrad R, Ripa R, Mansukhani R, Büttner S, Wickström SA, Brunemeier S, Jakimov S, Luo S, Rosenzweig-Lipson S, Tsai SY, Dimmele… See abstract for full author list ➔ Lyu YX, et al. Aging (Albany NY). 2024 Oct 16;16(20):12955-12976. doi: 10.18632/aging.206135. Epub 2024 Oct 16. Aging (Albany NY). 2024. PMID: 39418098 Free PMC article. Review.
  • Molecular mechanism of parental H3/H4 recycling at a replication fork.
    Nagae F, Murayama Y, Terakawa T. Nagae F, et al. Nat Commun. 2024 Nov 2;15(1):9485. doi: 10.1038/s41467-024-53187-4. Nat Commun. 2024. PMID: 39488545 Free PMC article.
  • Aere perennius: how chromatin fidelity is maintained and lost in disease.
    Fetch DR, Jumamyradova A, Chapa CM, Ge Y, Mohamadzadeh M, Soshnev AA. Fetch DR, et al. NAR Mol Med. 2025 Jul 22;2(3):ugaf026. doi: 10.1093/narmme/ugaf026. eCollection 2025 Jul. NAR Mol Med. 2025. PMID: 40809411 Free PMC article. Review.

References

    1. Cantone I, Fisher AG. Epigenetic programming and reprogramming during development. Nat. Struct. Mol. Biol. 2013;20:282–289. doi: 10.1038/nsmb.2489. - DOI - PubMed
    1. Iwafuchi-Doi M, Zaret KS. Cell fate control by pioneer transcription factors. Development. 2016;143:1833–1837. doi: 10.1242/dev.133900. - DOI - PMC - PubMed
    1. Yadav T, Quivy JP, Almouzni G. Chromatin plasticity: a versatile landscape that underlies cell fate and identity. Science. 2018;361:1332–1336. doi: 10.1126/science.aat8950. - DOI - PubMed
    1. Morgani S, Nichols J, Hadjantonakis AK. The many faces of pluripotency: in vitro adaptations of a continuum of in vivo states. BMC Dev. Biol. 2017;17:7. doi: 10.1186/s12861-017-0150-4. - DOI - PMC - PubMed
    1. Allis CD, Jenuwein T. The molecular hallmarks of epigenetic control. Nat. Rev. Genet. 2016;17:487–500. doi: 10.1038/nrg.2016.59. - DOI - PubMed

Publication types