. 2023 Sep;55(9):1555-1566.
doi: 10.1038/s41588-023-01477-w. Epub 2023 Sep 4.

Symmetric inheritance of parental histones contributes to safeguarding the fate of mouse embryonic stem cells during differentiation

Affiliations

Symmetric inheritance of parental histones contributes to safeguarding the fate of mouse embryonic stem cells during differentiation

Qing Wen et al. Nat Genet. 2023 Sep.

Abstract

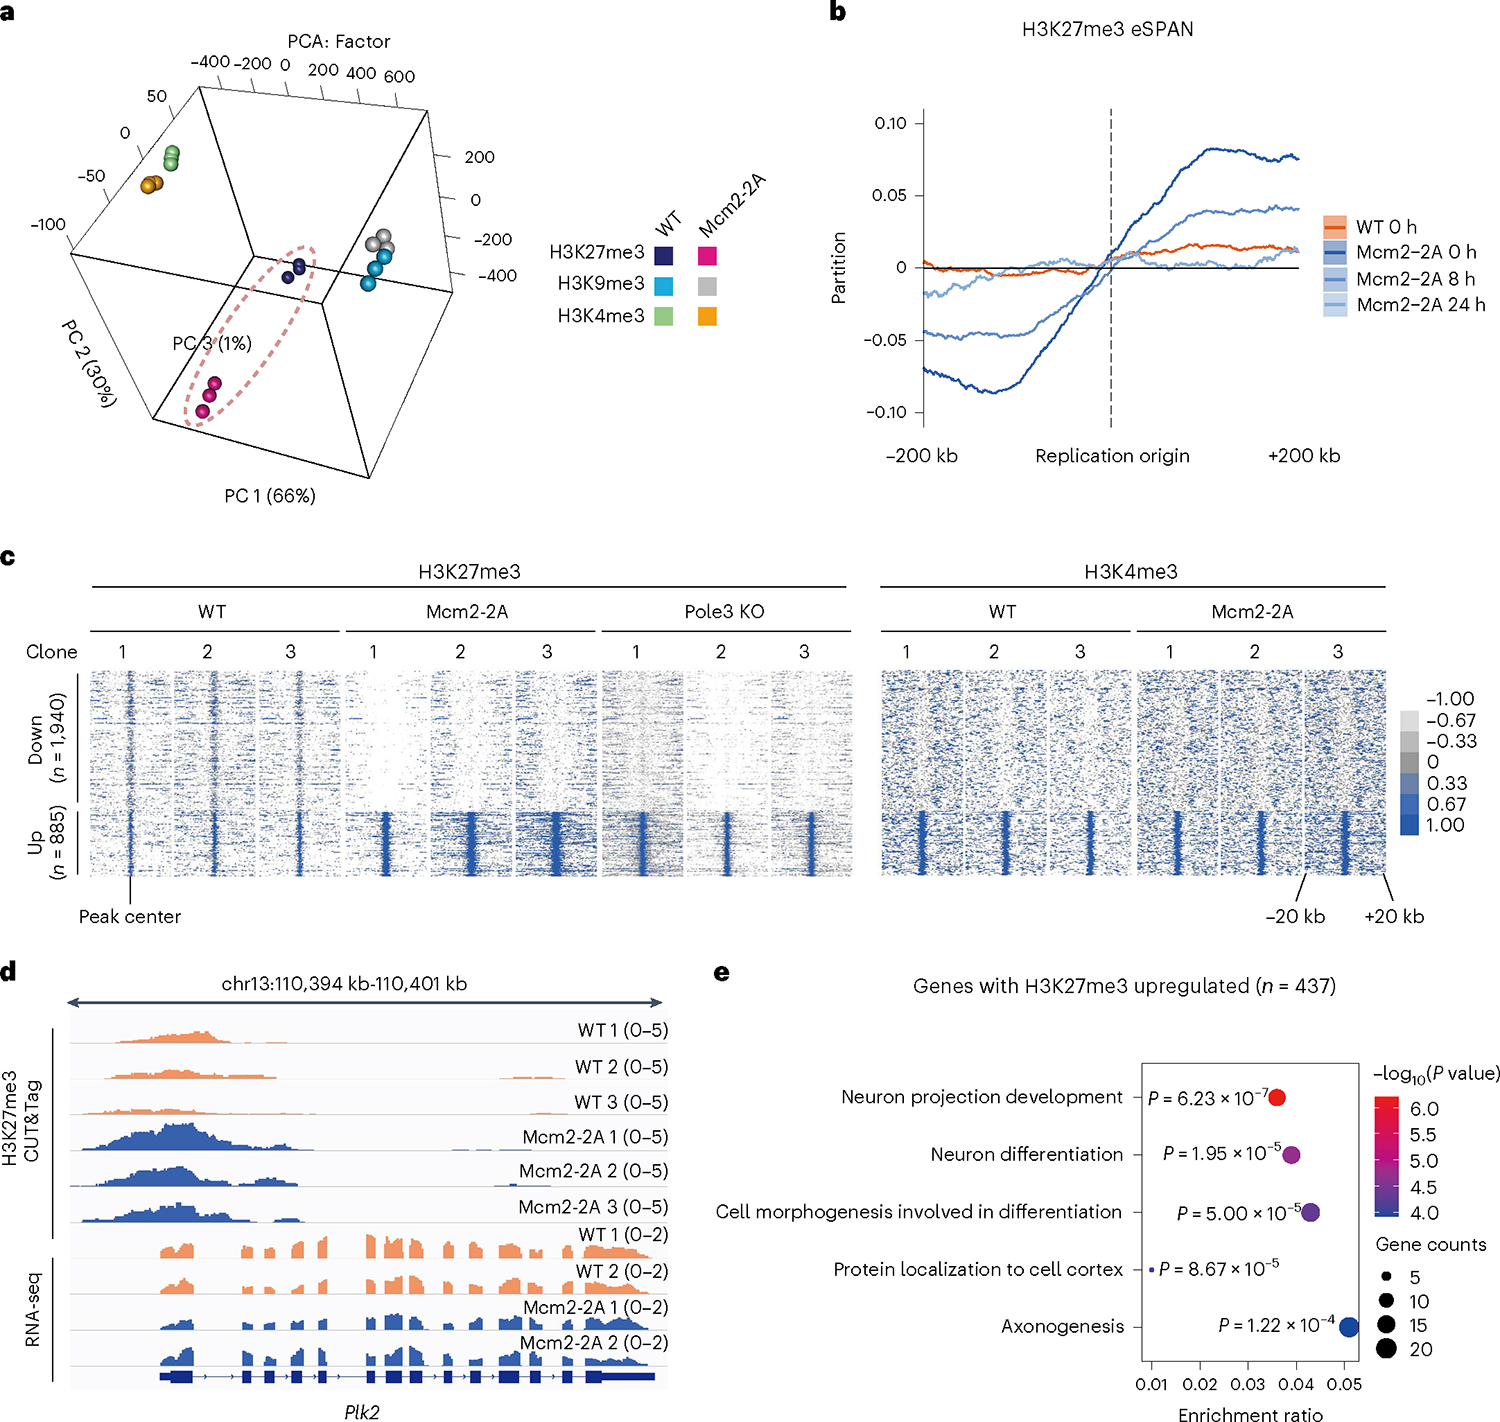
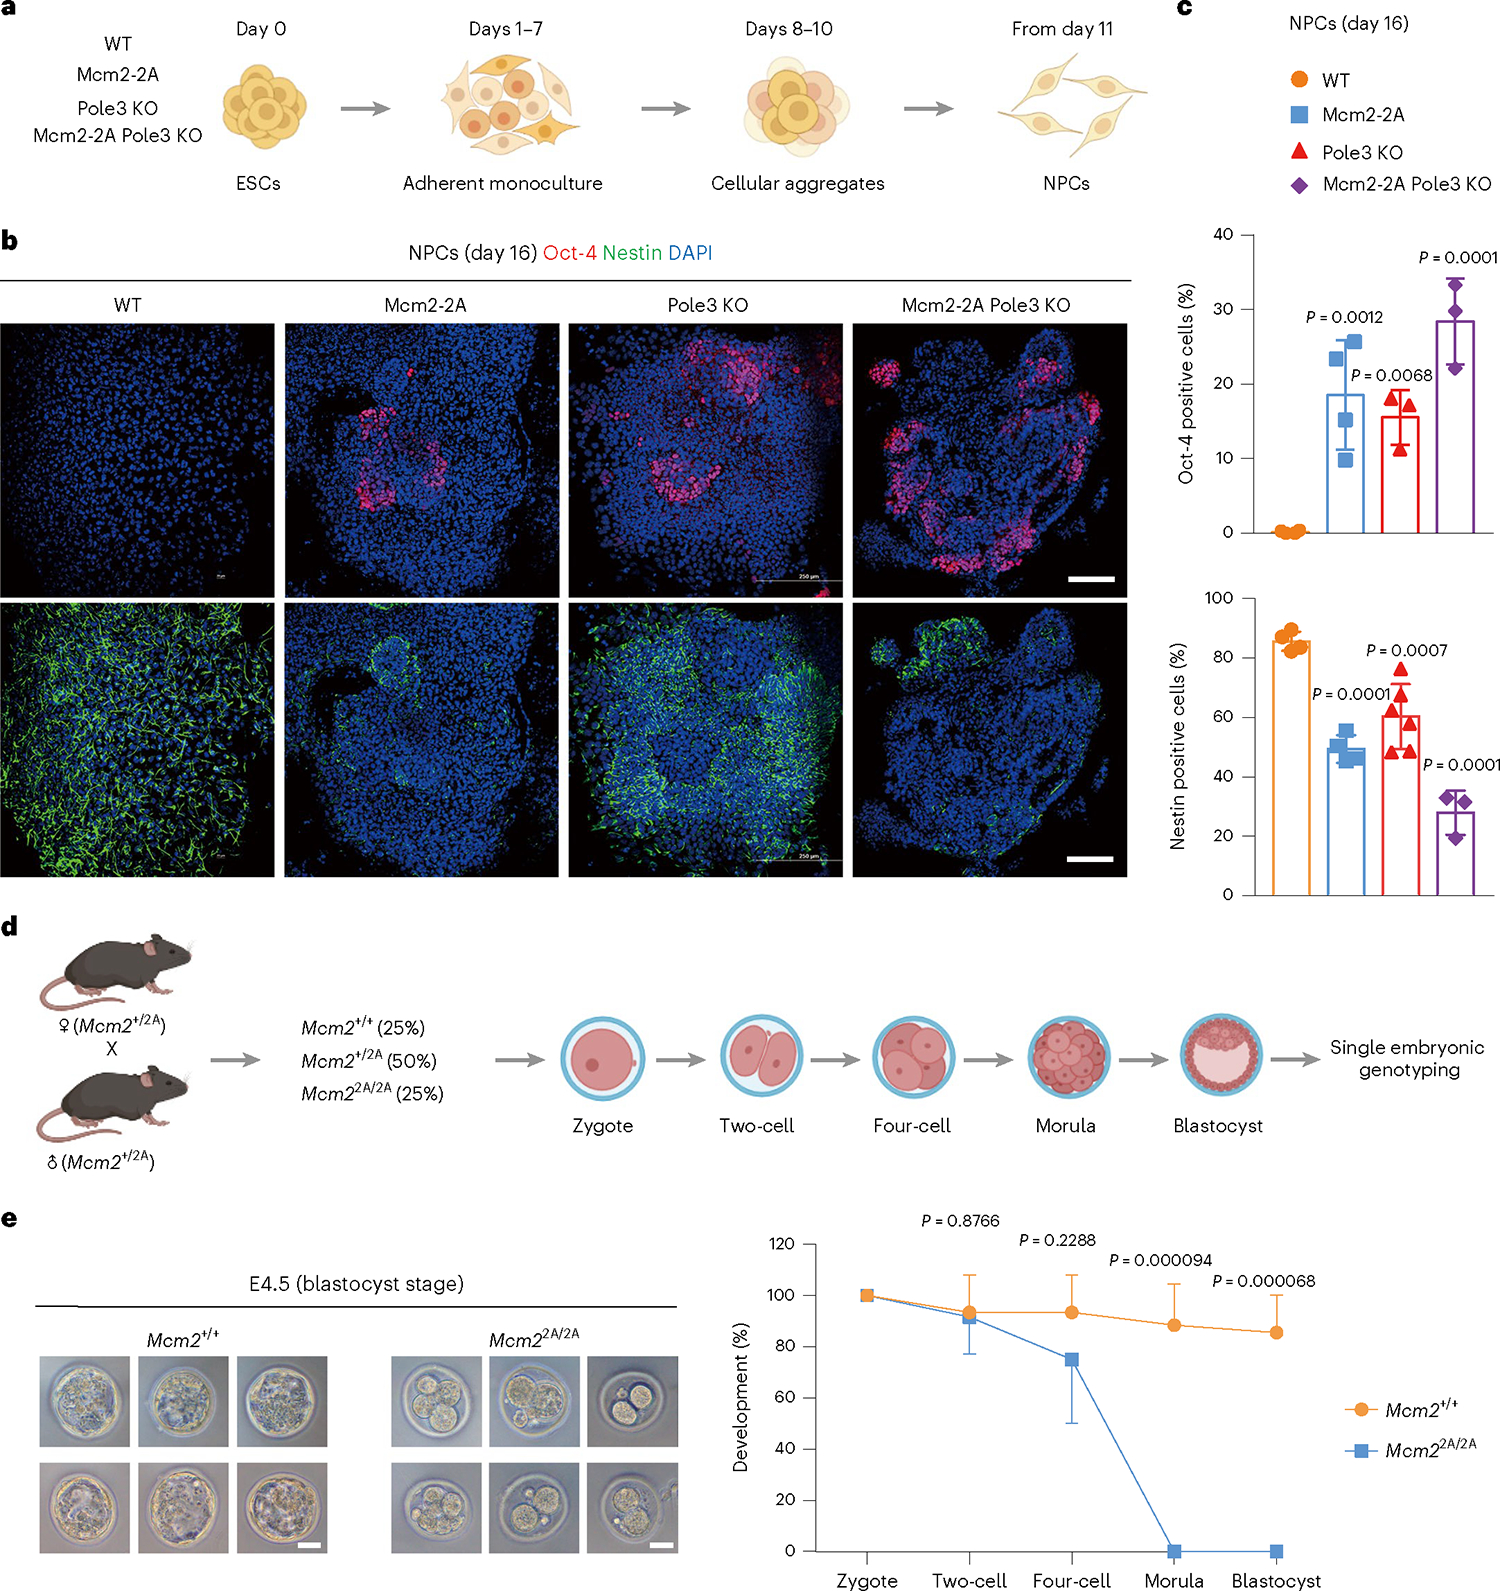
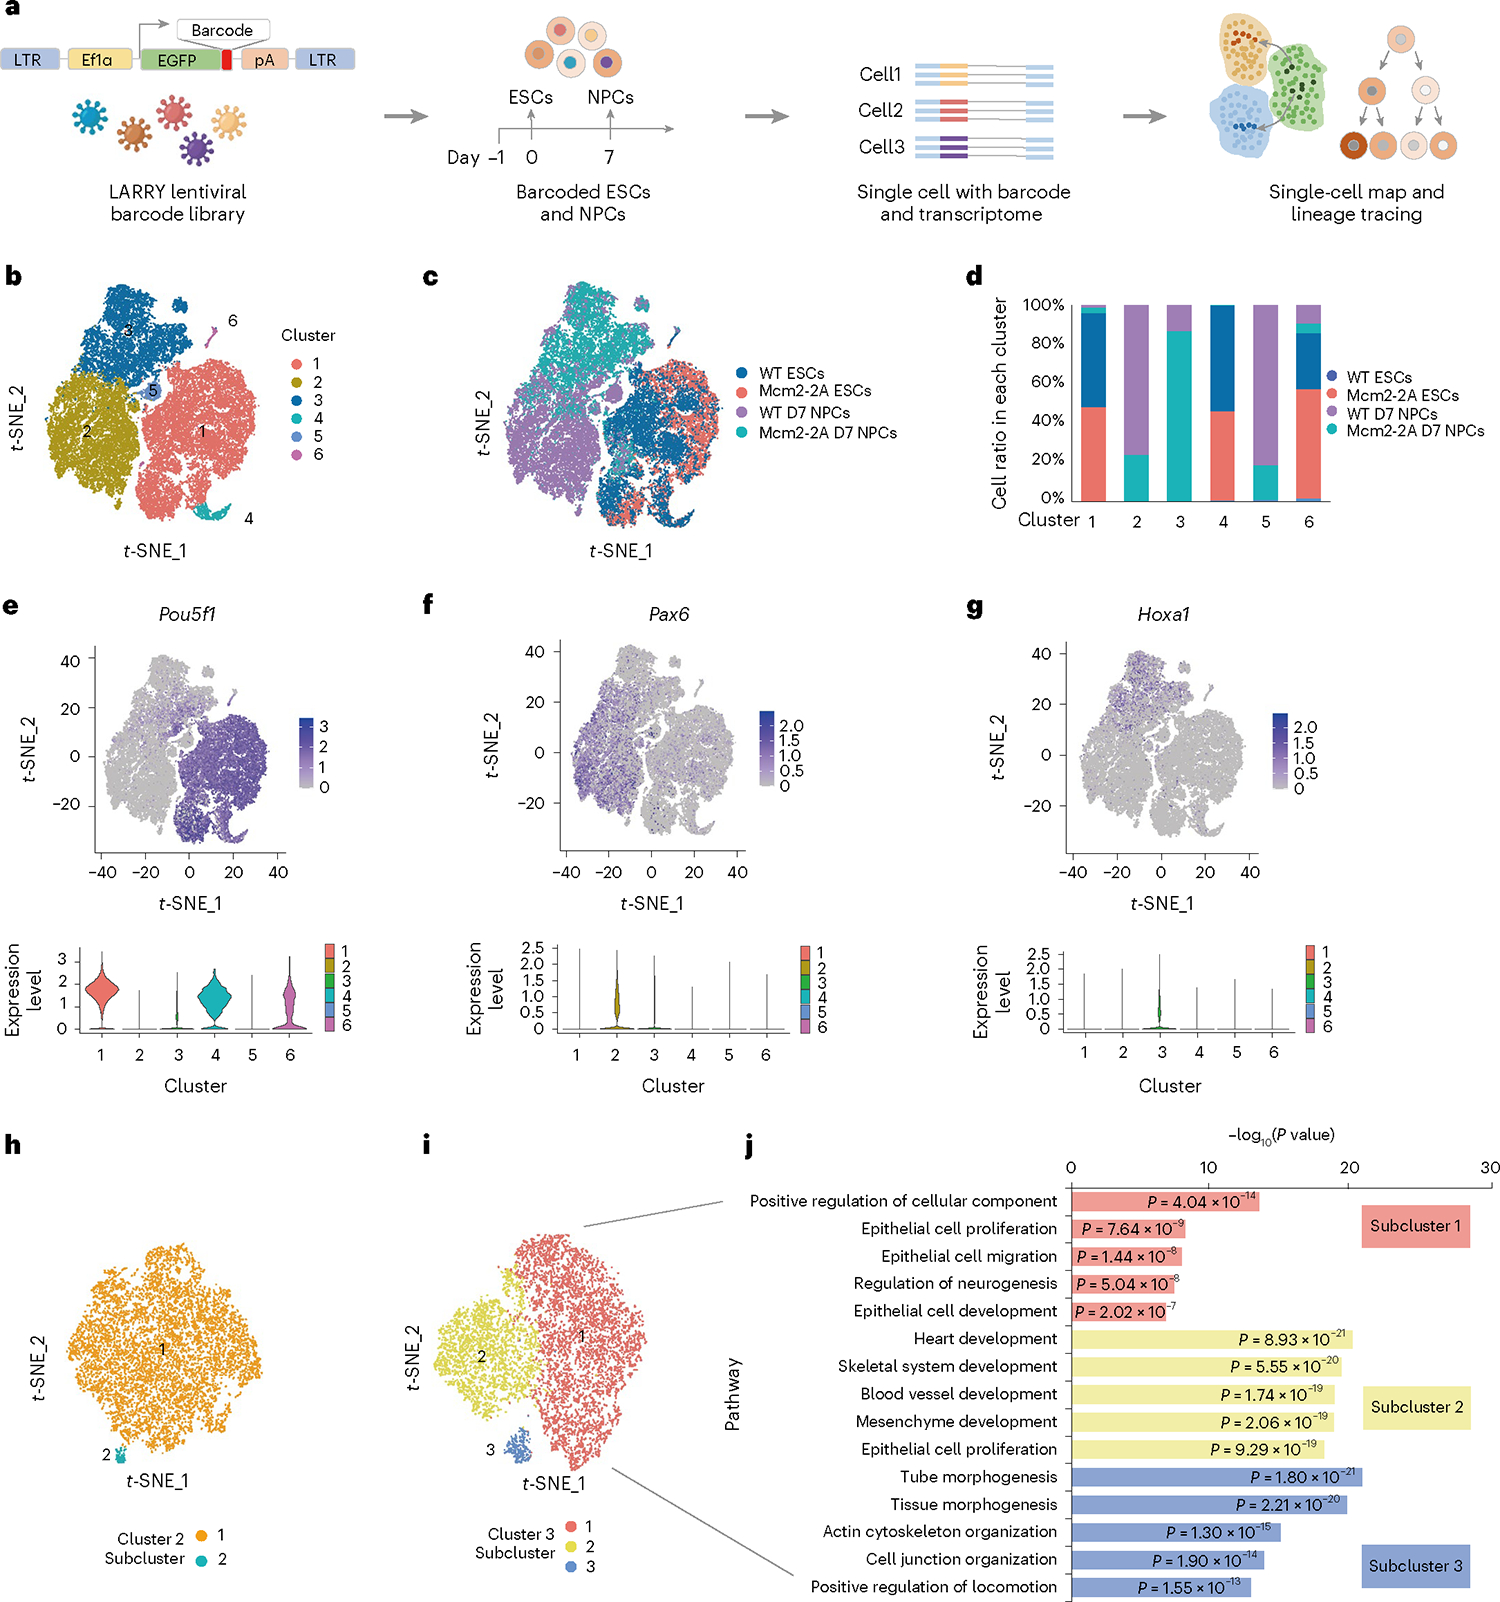
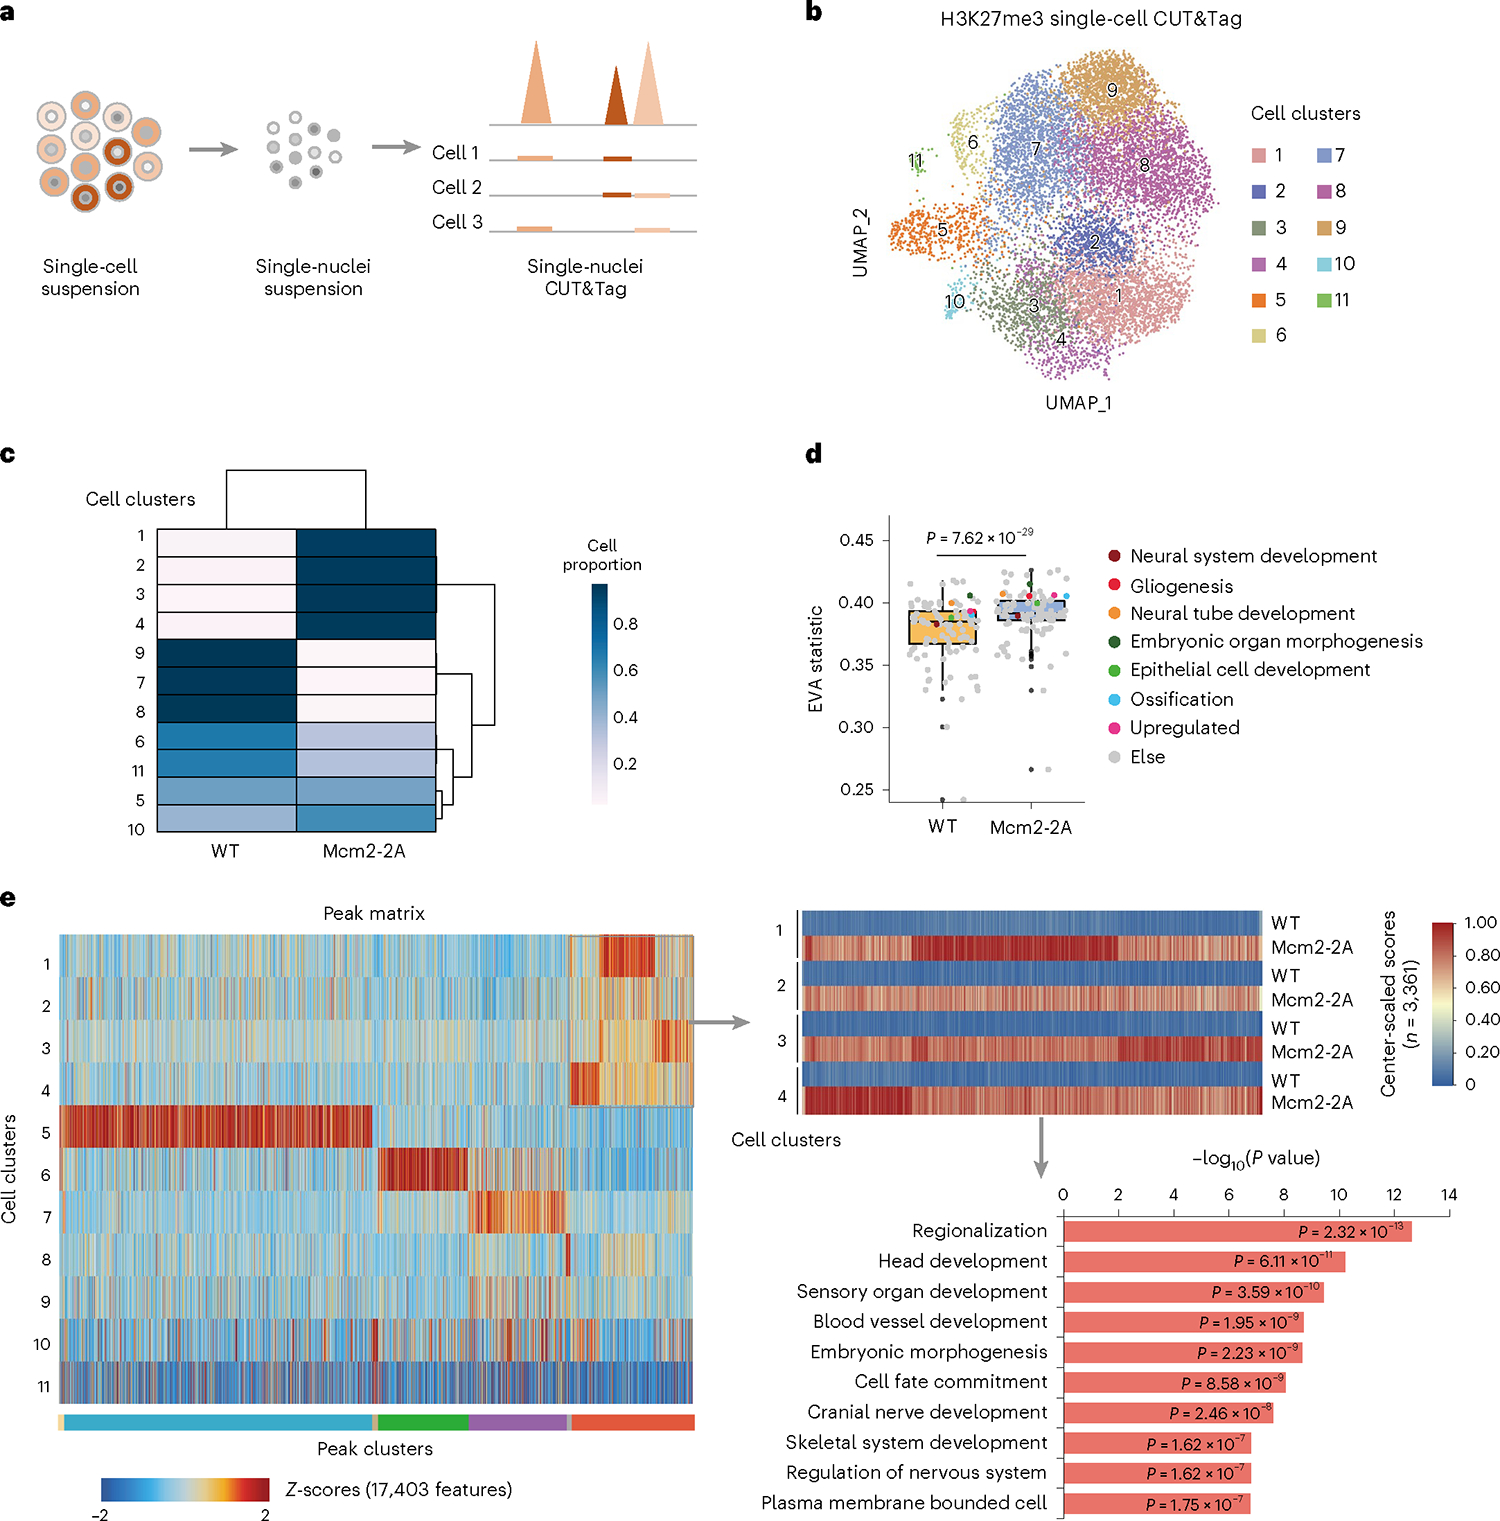
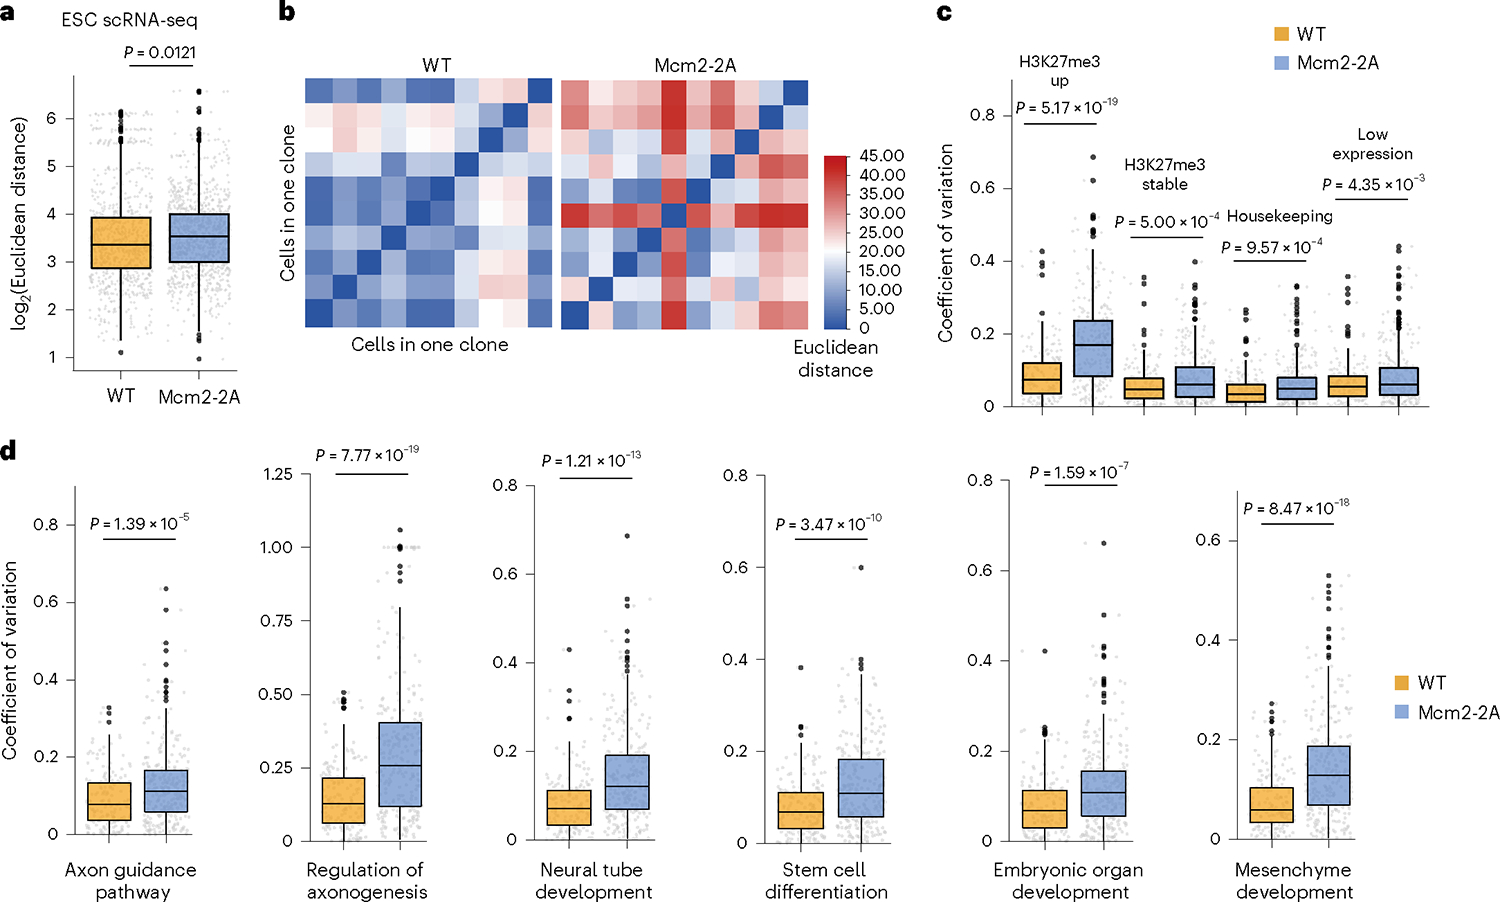
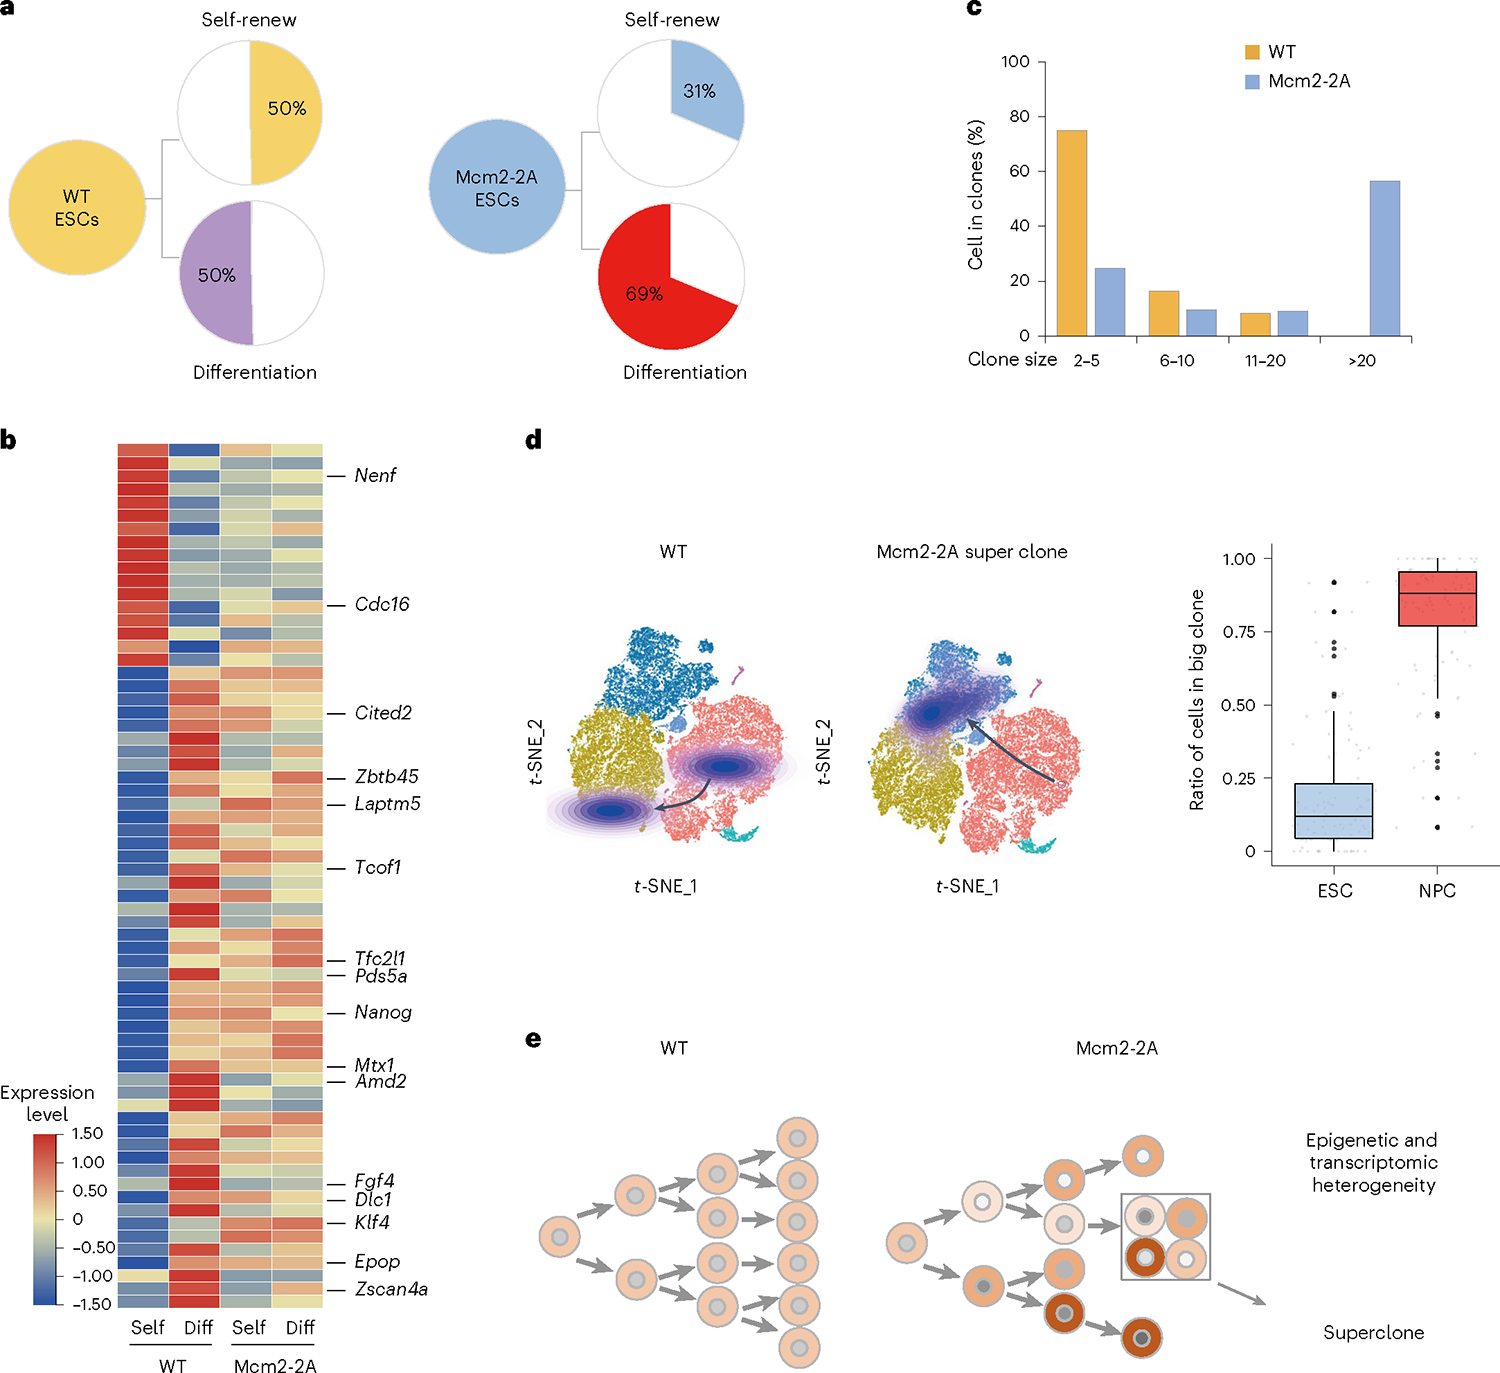
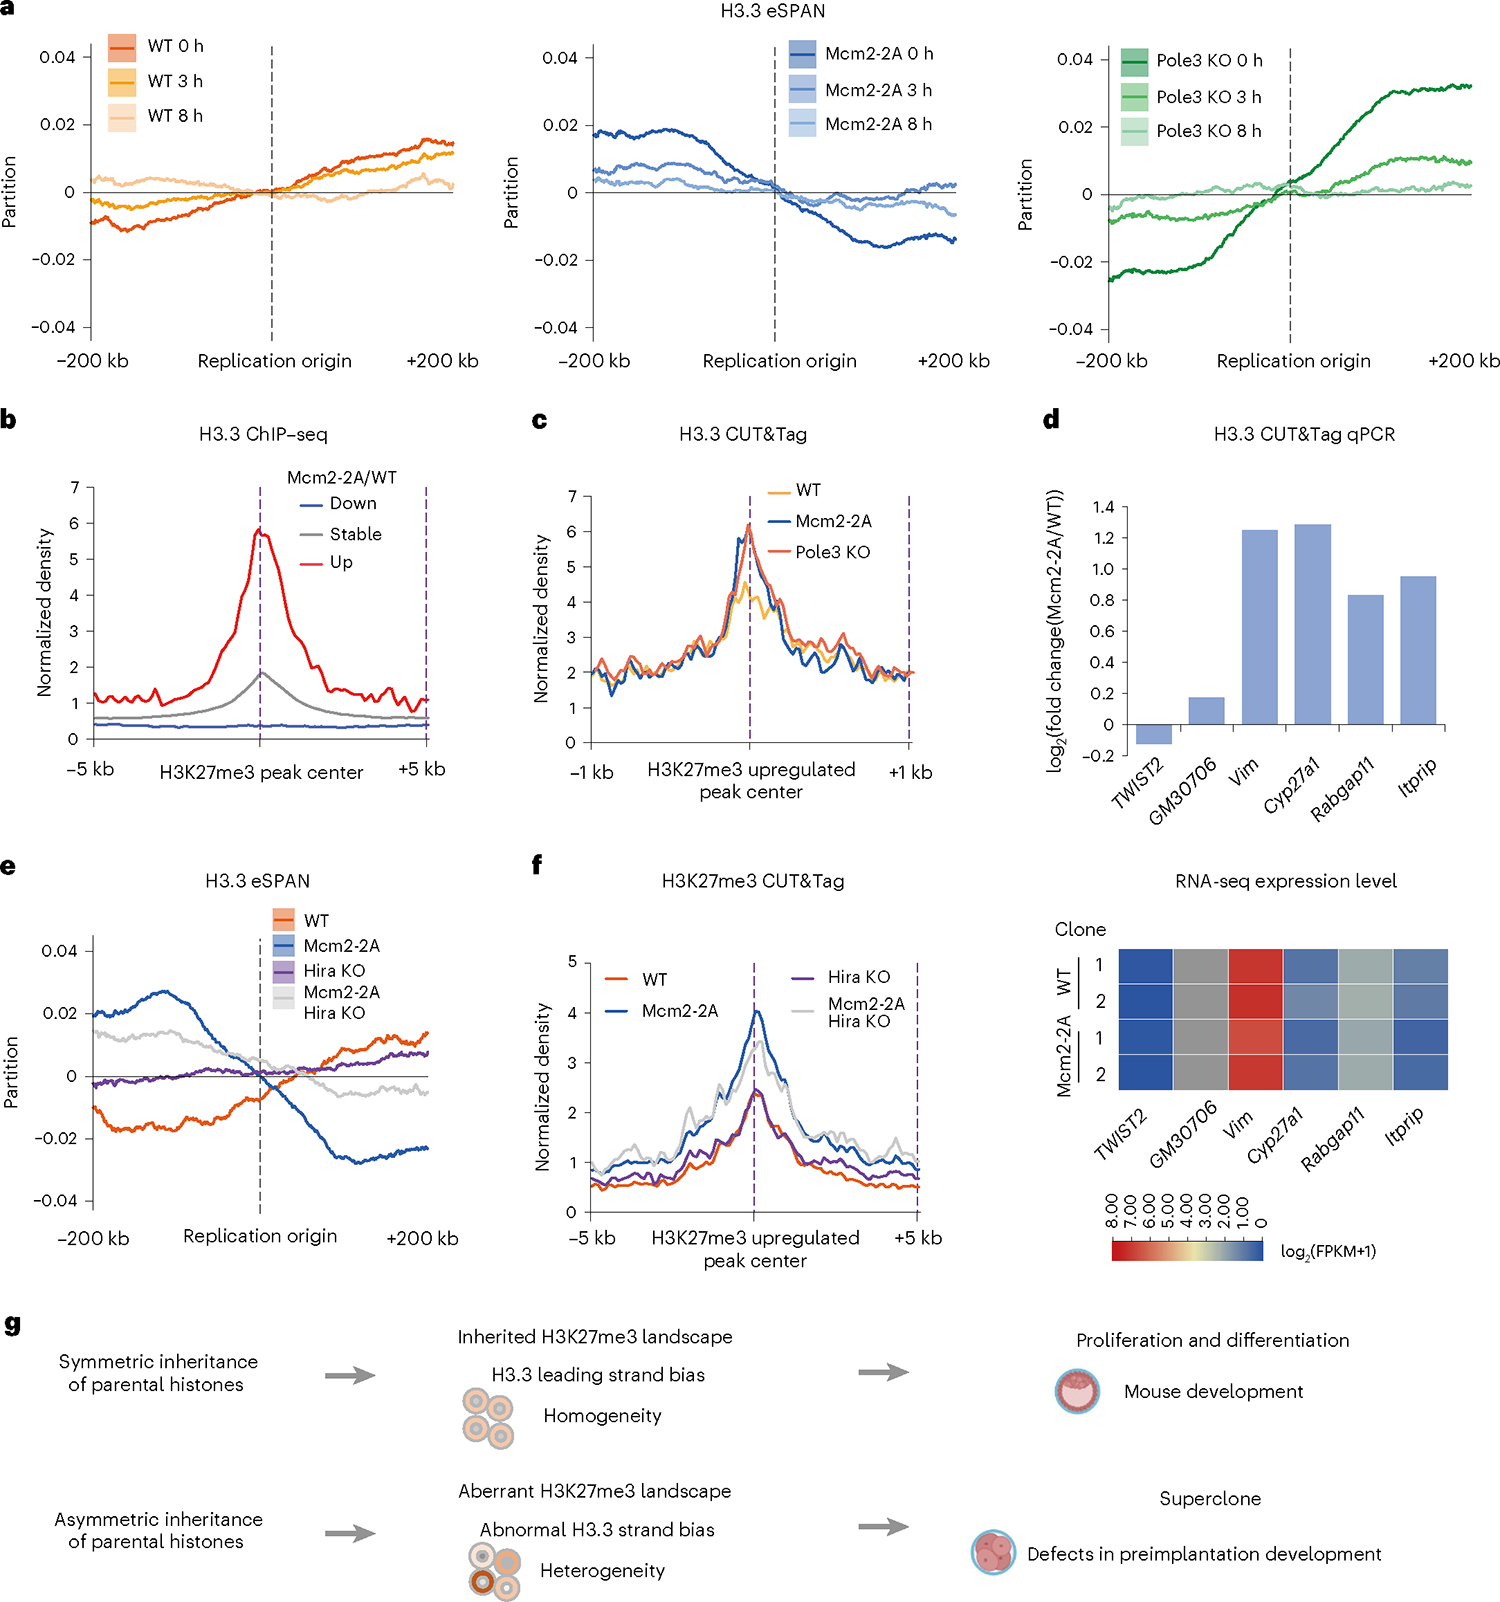
Parental histones, the carriers of posttranslational modifications, are deposited evenly onto the replicating DNA of sister chromatids in a process dependent on the Mcm2 subunit of DNA helicase and the Pole3 subunit of leading-strand DNA polymerase. The biological significance of parental histone propagation remains unclear. Here we show that Mcm2-mutated or Pole3-deleted mouse embryonic stem cells (ESCs) display aberrant histone landscapes and impaired neural differentiation. Mutation of the Mcm2 histone-binding domain causes defects in pre-implantation development and embryonic lethality. ESCs with biased parental histone transfer exhibit increased epigenetic heterogeneity, showing altered histone variant H3.3 and H3K27me3 patterning at genomic sites regulating differentiation genes. Our results indicate that the lagging strand pattern of H3.3 leads to the redistribution of H3K27me3 in Mcm2-2A ESCs. We demonstrate that symmetric parental histone deposition to sister chromatids contributes to cellular differentiation and development.


Conflict of interest statement

Competing interests

The authors declare no competing interests.

Figures

Fig. 1 |
Fig. 1 |. Mcm2–2A mutation alters the H3K27me3 landscape of ESCs.
a, PCA of H3K27me3, H3K4me3 and H3K9me3 CUT&Tag profiles in WT (n = 3) and Mcm2–2A (n = 3) ESC clonal lines. H3K27me3 profiles are outlined in dashed ellipse. b, Average bias of H3K27me3 eSPAN (n = 2,417 origins) in WT and Mcm2–2A ESCs at 0, 8 and 24 h. c, Heatmaps of up- and downregulated H3K27me3 signal (left) and H3K4me3 signal (right) at TSSs (± 20 kb) in Mcm2–2A (n = 3), Pole3 KO (n = 3) versus WT (n = 3) ESC clonal lines. d, H3K27me3 CUT&Tag (up) and RNA-seq (down) tracks for Plk2 in WT and Mcm2–2A ESCs; n = 3 (CUT&Tag) or n = 2 (RNA-seq) independent clonal lines. e, Enriched GO terms (P < 0.01) for H3K27me3 signals upregulated in Mcm2–2A versus WT ESCs. P values from the one-sided hypergeometric test are shown.
Fig. 2 |
Fig. 2 |. Mcm2–2A mutation impairs ESC differentiation and mouse development.
a, Experimental design. WT, Mcm2–2A, Pole3 KO and Mcm2–2A Pole3 KO ESCs were cultured in serum-free adherent monoculture for 7 days to induce NPC differentiation. Then, progenitor cells were grown in suspension as cellular aggregates for 3 days. Aggregates were then harvested and replated for mature NPC differentiation. b, Merged immunofluorescence images of NPCs on day 16, stained with antibodies against neural lineage marker Nestin, pluripotent cell marker Oct-4 and DAPI. Scale bars, 100 μm. c, Percentages of Oct-4+ or Nestin+ cells of differentiation in day 16 NPCs. Each point represents the mean percentage ± s.d. of an independent clone line, WT (n = 4), Mcm2–2A (n = 4), Pole3 KO (n = 3) or Mcm2–2A Pole3 KO (n = 3). An unpaired two-sided Student’s t-test was used to calculate statistical significance. Similar phenotypes were observed in at least three independent differentiation experiments. d, Experimental design. Mcm2+/+, Mcm2+/2A and Mcm22A/2A embryos were generated by crossing heterozygous Mcm2+/2A males and females. Embryos of both sexes were cultured from zygote to blastocyst and processed for single embryonic genotyping. e, Representative bright-field images of embryonic development at blastocyst stage. Scale bars, 30 μm (left). Developmental progression of homozygote Mcm22A/2A and WT early embryos (right). Data are presented as mean percentage ± s.d. of WT (n = 5 superovulated females, n = 16 embryos) and Mcm2–2A (n = 3 superovulated females, n = 7 embryos). An unpaired two-sided Student’s t-test was used to calculate statistical significance.
Fig. 3 |
Fig. 3 |. Single-cell lineage and transcriptome sequencing maps distinct fate of NPCs differentiated from WT versus Mcm2–2A ESCs.
a, Experimental design for studying the differentiation dynamics of NPCs with the LARRY lentiviral barcoding library. The LARRY lentiviral construct delivers an expressed and heritable barcode that is detectable using scRNA-seq. WT and Mcm2–2A ESCs with the LARRY barcoding library were differentiated into NPCs. We then analyzed the single-cell transcriptome to map cell fate bias using 10x Genomics scRNA-seq at day 0 (ESCs) and day 7 (NPCs). ESCs and their differentiation outcomes were linked by their LARRY barcodes. b, Visualization of scRNA-seq data. Projection of WT (day 0, n = 8,871 cells; day 7, n = 11,213 cells) and Mcm2–2A (day 0, n = 9,471 cells; day 7, n = 12,887 cells) ESC and NPC single cells onto a t-SNE plot. Six clusters were identified. c, Same data as in b, this time showing how WT and Mcm2–2A cells from day 0 and day 7 cluster. d, Integrative analysis showing the ratios of WT and Mcm2–2A ESCs and NPCs in each cluster. eg, Cluster annotation using key marker genes identified ESCs (Pou5f1) (e), NPCs (Pax6) (f) and other differentiated cell types in cluster 3 (Hoxa1) (g). Violin plots show expression of a given gene for clusters 1–6. h,i, Subclusters among cells from cluster 2 (only WT cells, h) and cluster 3 (only Mcm2–2A cells, i). j, Enriched GO terms (log2 fold-change < −0.25 or >0.25, P value < 0.05) for genes upregulated in the three Mcm2–2A NPC subclusters from i. P values from the one-sided hypergeometric test are shown.
Fig. 4 |
Fig. 4 |. Mcm2–2A mutation increases histone H3K27me3 heterogeneity.
a, Experimental design for studying the heterogeneity of ESCs using scCUT&Tag. Cells were suspended into single cells, and nuclei were isolated to process CUT&Tag and the 10x Chromium scATAC-seq protocol. Gene score of H3K27me3 scCUT&Tag signal was used to analyze the pathway heterogeneity. b, Visualization of H3K27me3 scCUT&Tag data. Clusters (1–11) projected onto a uniform manifold approximation and projection (UMAP) plot from H3K27me3 scCUT&Tag data derived from Mcm2–2A (n = 4,593 cells of one Mcm2–2A mutant) and WT ESCs (n = 6,535 cells of one WT clone). c, Heatmap showing the ratio of WT to Mcm2–2A ESCs for each cell cluster, 1–11. d, Boxplot showing pathway heterogeneity (EVA statistic) of the H3K27me3 unique fragments within neurodevelopment pathways and other lineage differentiation pathways in WT and Mcm2–2A ESCs. Box plots display the median, upper and lower quartiles; whiskers show 1.5× interquartile range (IQR). A paired two-sided Student’s t-test was used to calculate statistical significance (n = 103 of gene sets). e, Heatmap showing H3K27me3 signal intensity for each cell cluster, 1–11 (left). Color bars in the rows at the bottom of the heatmap specify peak clusters. Signal intensity of peaks inside the gray box were further showed separately in WT and Mcm2–2A cells (top right) and related genes were performed GO analysis (bottom right). P values from the one-sided hypergeometric test are shown.
Fig. 5 |
Fig. 5 |. Mcm2–2A mutation increases cellular transcriptional heterogeneity.
a, Boxplot showing cell-to-cell heterogeneity (Euclidean distance) of gene expression in WT and Mcm2–2A ESCs. An unpaired two-sided Student’s t-test was used to calculate statistical significance (n = 1,000 cell pairs). b, Heatmap showing the heterogeneity of gene expression in representative clones of WT and Mcm2–2A ESCs and NPCs. c, Boxplot showing heterogeneity (coefficient of variation) of expression for elevated H3K27me3 genes, stable H3K27me3 Stem cell Embryonic organ Mesenchyme differentiation development development genes, low expression genes and housekeeping genes in WT and Mcm2–2A ESCs. d, Boxplot showing heterogeneity (coefficient of variation) of gene expression within neurodevelopment and other differentiation pathways in WT and Mcm2–2A ESCs. Box plots display the median, upper and lower quartiles; whiskers show 1.5× IQR (a,c,d). WT (n = 165 lineage clones), Mcm2–2A (n = 270 lineage clones) (c,d). A two-sided Welch’s t-test was used to calculate statistical significance (c,d).
Fig. 6 |
Fig. 6 |. Mcm2–2A mutation forms superclones.
a, Lineage trees of WT and Mcm2–2A clones with the same barcodes, showing proportion of ESCs contributing to self-renewal (Self) or differentiation (Diff) during the differentiation of NPCs. b, Heatmap of differential gene expression between the self-renew and differentiation cells of WT versus Mcm2–2A ESCs in a. c, Percentage of WT and Mcm2–2A cells found in clones of 2–5, 6–10, 11–20 or more than 20 cells. d, Contour plots showing the cell density of representative clone lineages projected onto t-SNE plots for WT (left) and Mcm2–2A cells. A representative Mcm2–2A superclone was shown (middle). Boxplot showing proportion of ESCs versus NPCs of cell clones containing more than ten cells in Mcm2–2A clones (n = 99 big clones). Box plots display the median, upper and lower quartiles; whiskers show 1.5× IQR (right). e, Model of Mcm2 in heterogeneity and superclone. Mcm2–2A mutation leads to a biased allocation of parental histone resulting in epigenetic and transcriptomic heterogeneity, and subsequently superclone.
Fig. 7 |
Fig. 7 |. H3.3 coordinates with H3K27me3 to impair Mcm2–2A ESC differentiation.
a, Average bias of H3.3 eSPAN (n = 2,417 origins) in WT (left), Mcm2–2A (middle) and Pole3 KO (right) ESCs at 0, 3 and 8 h after BrdU labeling for eSPAN analysis. b, Averaged H3.3 ChIP-seq signal at upregulated, stable and downregulated H3K27me3 CUT&Tag peaks (±5 kb). Data from ENCODE. c, Averaged H3.3 CUT&Tag signal in Mcm2–2A, Pole3 KO and WT ESCs at upregulated H3K27me3 CUT&Tag peaks in Mcm2–2A ESCs (±1 kb); n = 2 independent clone lines in each group. d, CUT&Tag qPCR analysis (up) of H3.3 at upregulated H3K27me3 and H3.3 peaks. TWIST2 and GM30706 sites were used as negative controls. Heatmap (bottom) showing the corresponding gene expressions (quantified by Fragments Per Kilobase of exon model per Million mapped fragments, FPKM). e, Average bias of H3.3 eSPAN (n = 2,417 origins) in WT, Mcm2–2A, Hira KO and Hira KO Mcm2–2A ESCs. f, Averaged profiles of H3K27me3 CUT&Tag signals in WT, Mcm2–2A, Hira KO and Hira KO Mcm2–2A ESCs at upregulated H3K27me3 peaks in Mcm2–2A ESCs (±5 kb). g, Model of Mcm2 in cellular differentiation and development. Parental histone allocation plays a crucial role in H3K27me3 and H3.3 maintenance, which contributes to proper differentiation and development following developmental signals. Mcm2–2A mutation leads to a biased allocation of H3K27me3 on the replication leading strand and a relatively increased H3.3 level on the lagging strand. The unbalanced nucleosome allocation causes epigenetic and transcriptomic heterogeneity, and aberrant gene transcription. Such changes result in impairment of ESC differentiation and mouse development.

Comment in

Similar articles

Cited by

References

    1. Stillman B Histone modifications: insights into their influence on gene expression. Cell 175, 6–9 (2018). - PubMed
    1. Bannister AJ & Kouzarides T Regulation of chromatin by histone modifications. Cell Res. 21, 381–395 (2011). - PMC - PubMed
    1. Scharf AN et al. Monomethylation of lysine 20 on histone H4 facilitates chromatin maturation. Mol. Cell. Biol. 29, 57–67 (2009). - PMC - PubMed
    1. Alabert C et al. Two distinct modes for propagation of histone PTMs across the cell cycle. Genes Dev. 29, 585–590 (2015). - PMC - PubMed
    1. Xu M, Wang W, Chen S & Zhu B A model for mitotic inheritance of histone lysine methylation. EMBO Rep. 13, 60–67 (2011). - PMC - PubMed

Publication types