. 2023 Sep;55(9):1531-1541.
doi: 10.1038/s41588-023-01480-1. Epub 2023 Sep 4.

Single-cell multi-omics identifies chronic inflammation as a driver of TP53-mutant leukemic evolution

Affiliations

Single-cell multi-omics identifies chronic inflammation as a driver of TP53-mutant leukemic evolution

Alba Rodriguez-Meira et al. Nat Genet. 2023 Sep.

Abstract

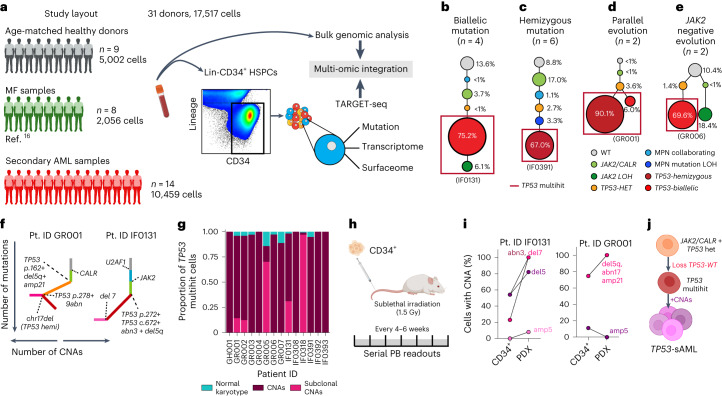
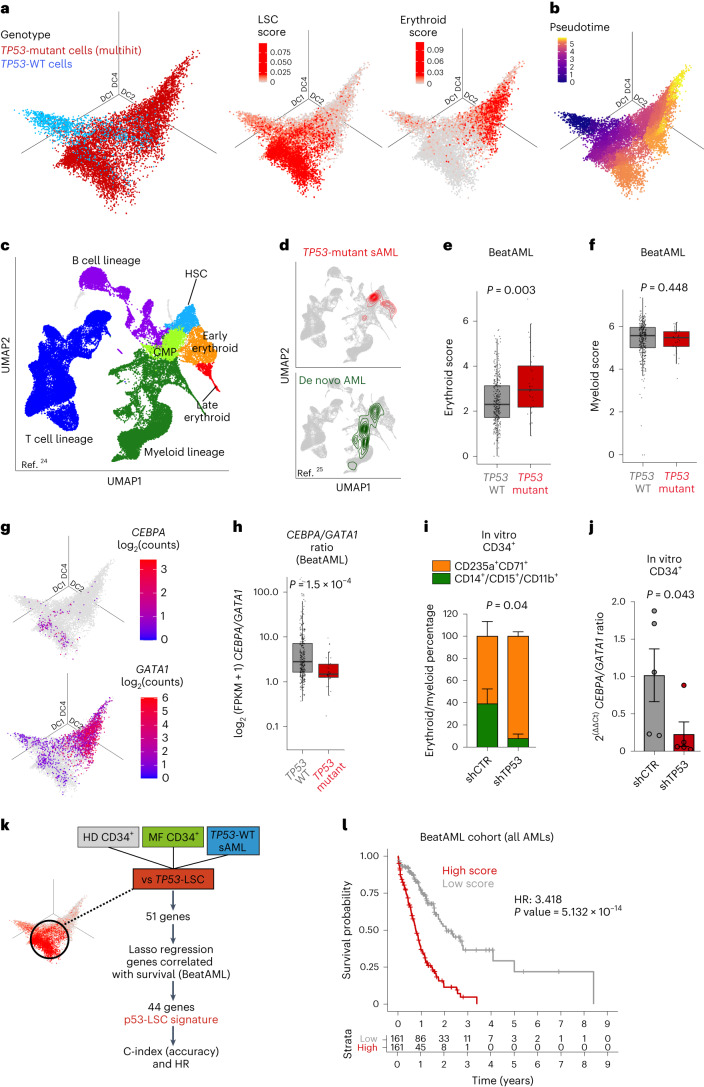
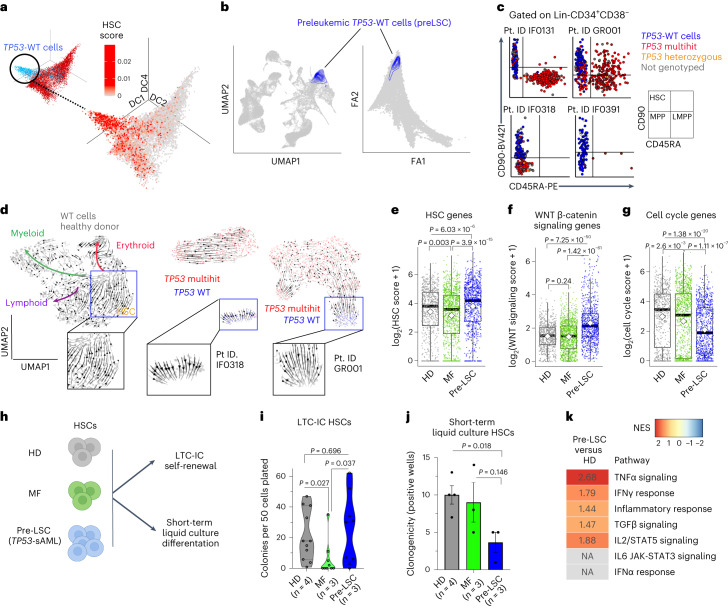
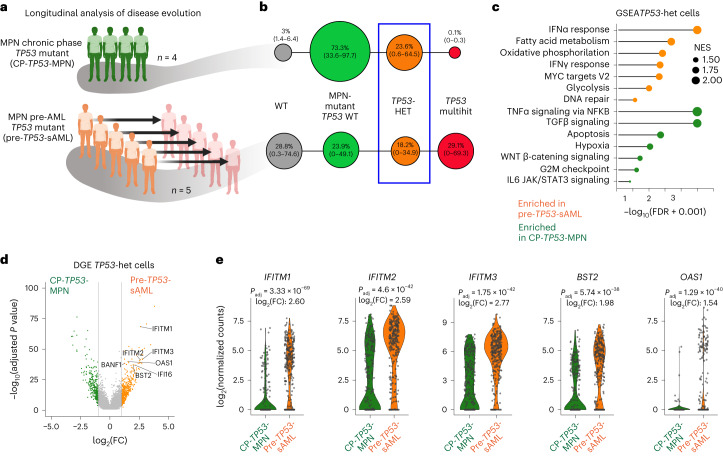
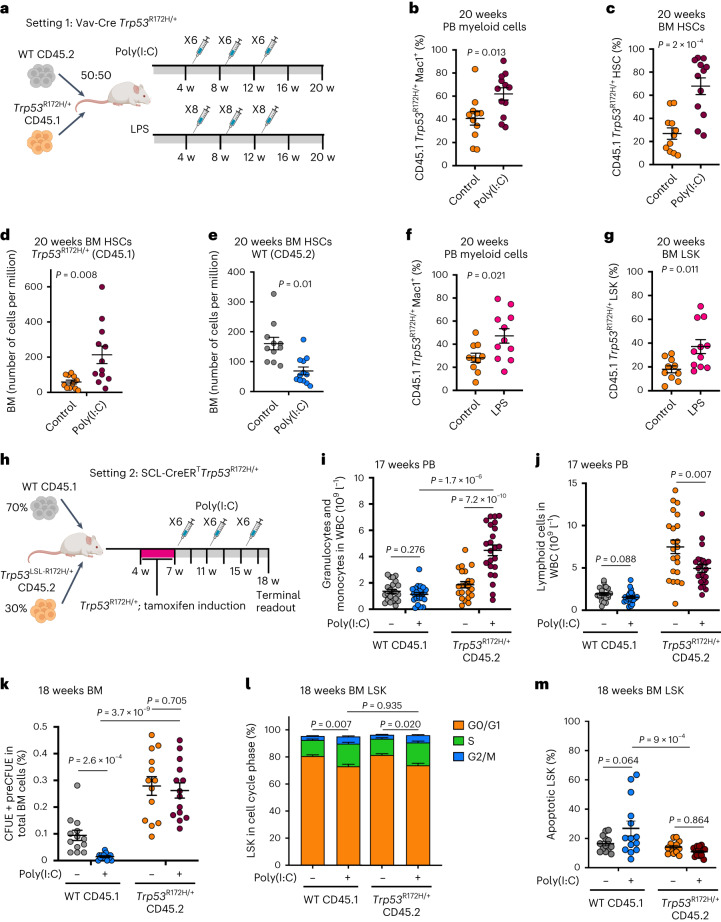
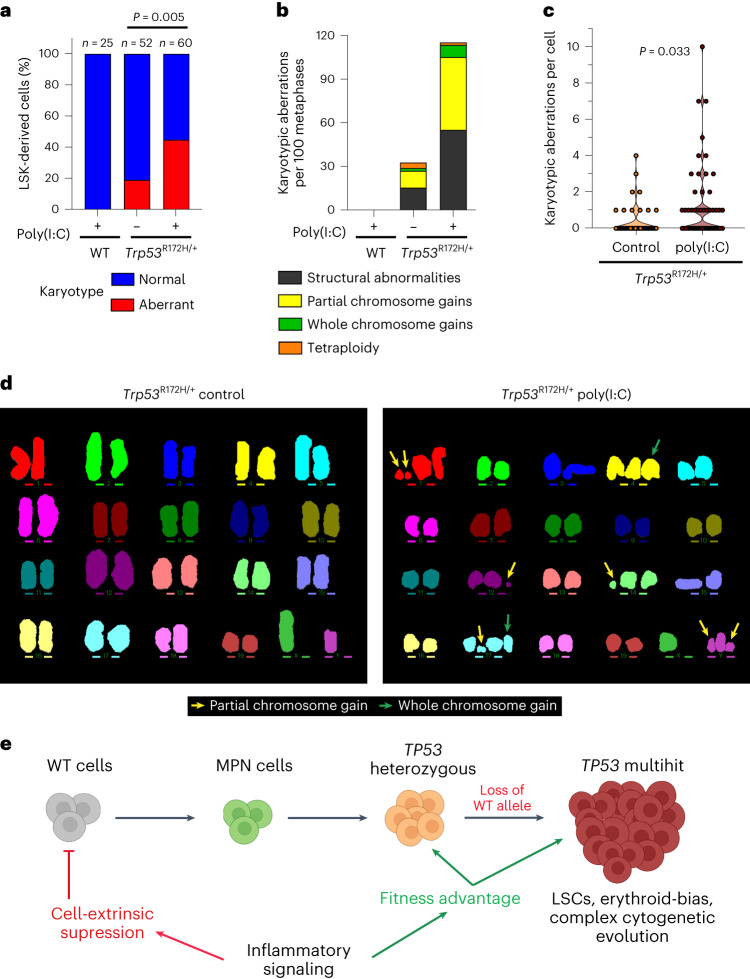
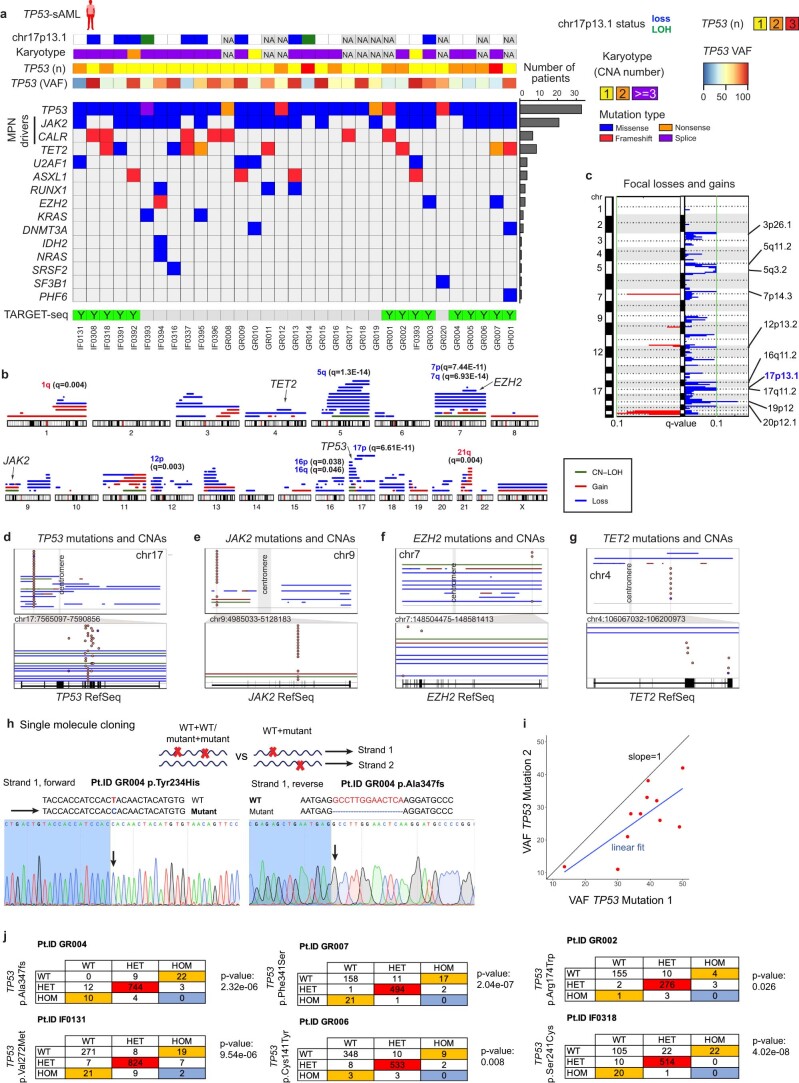
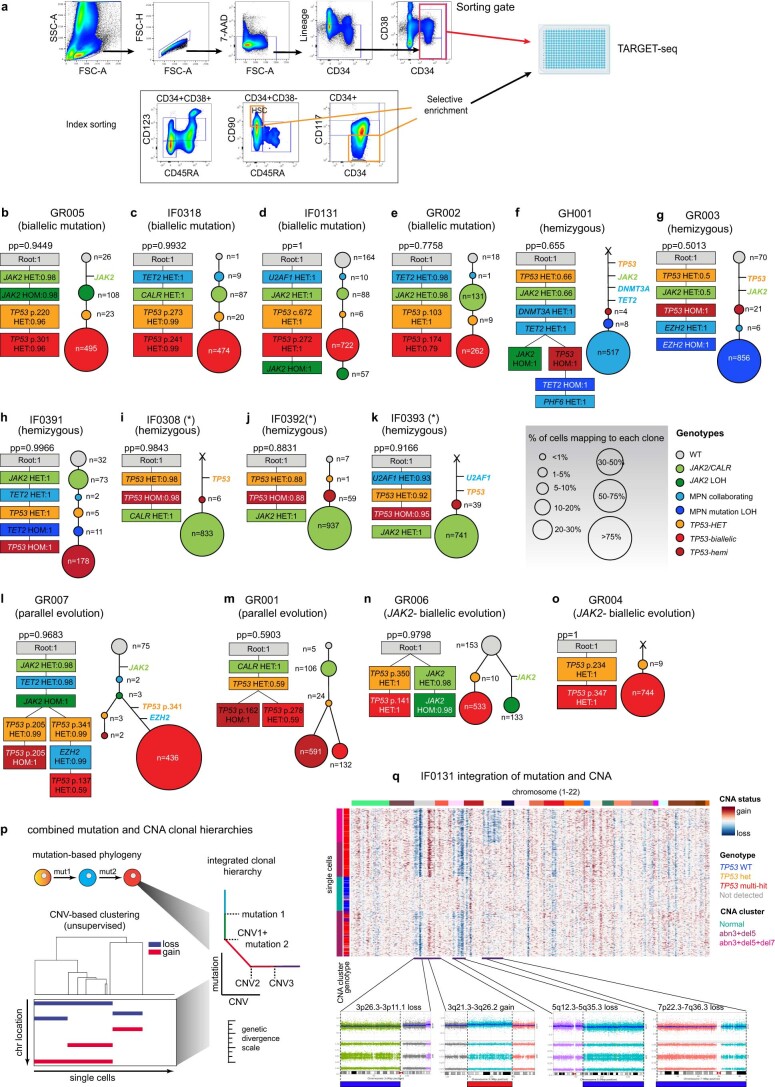
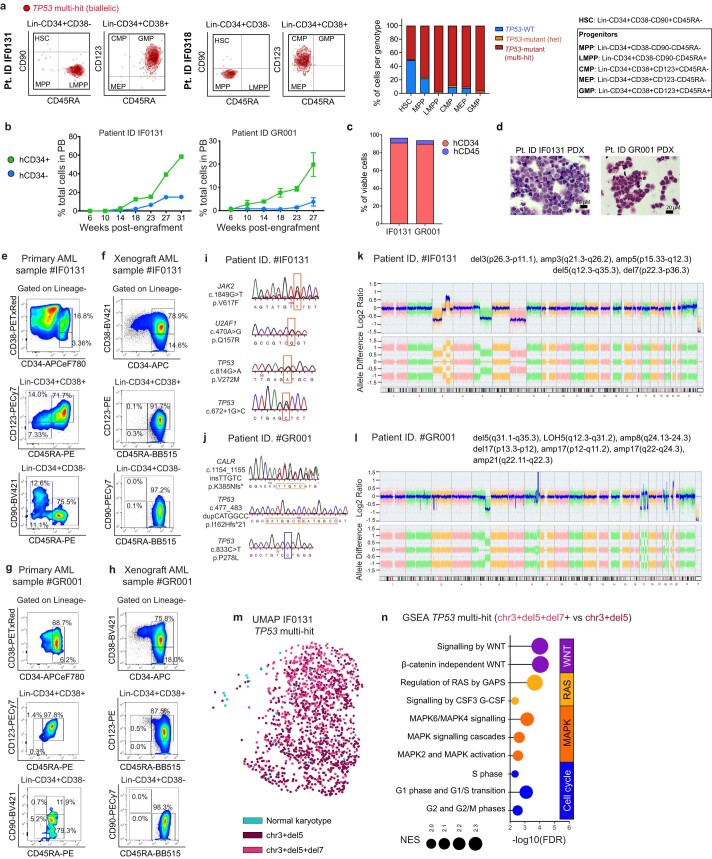
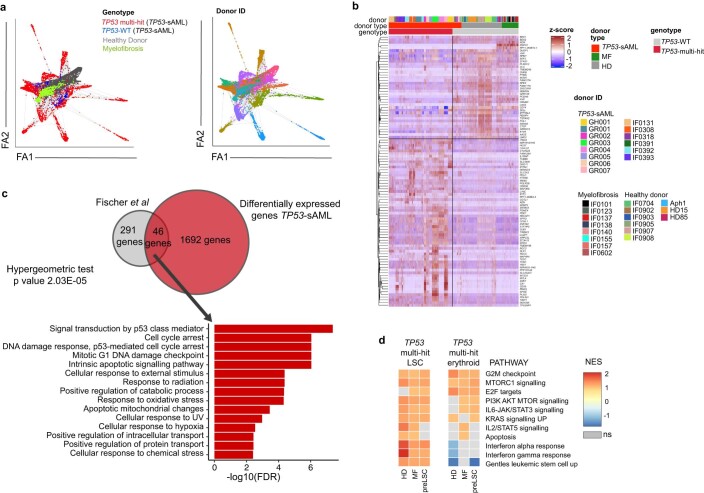
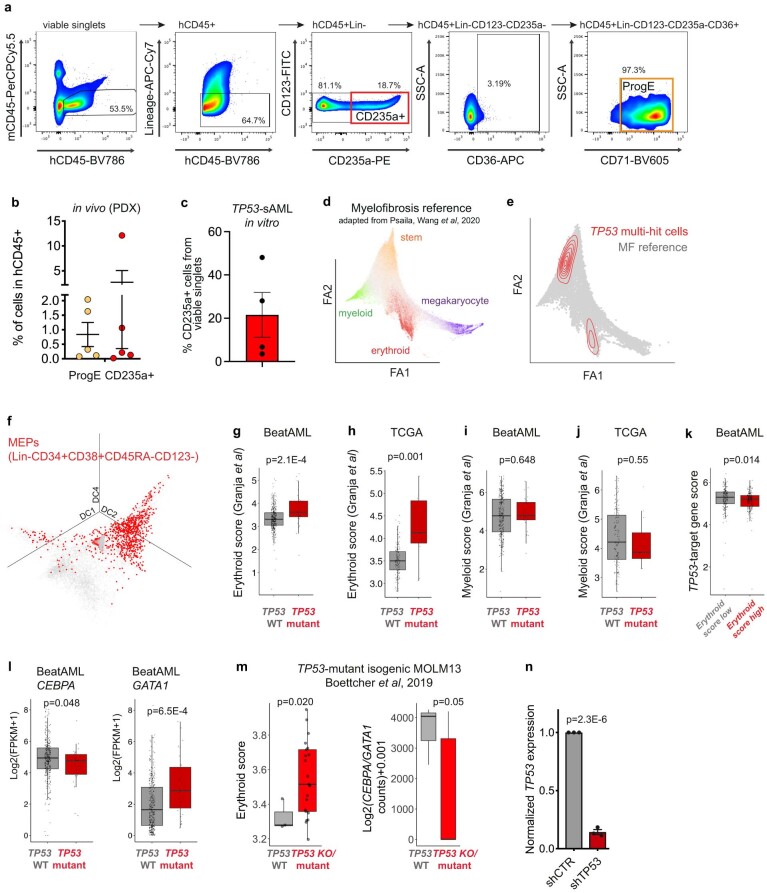
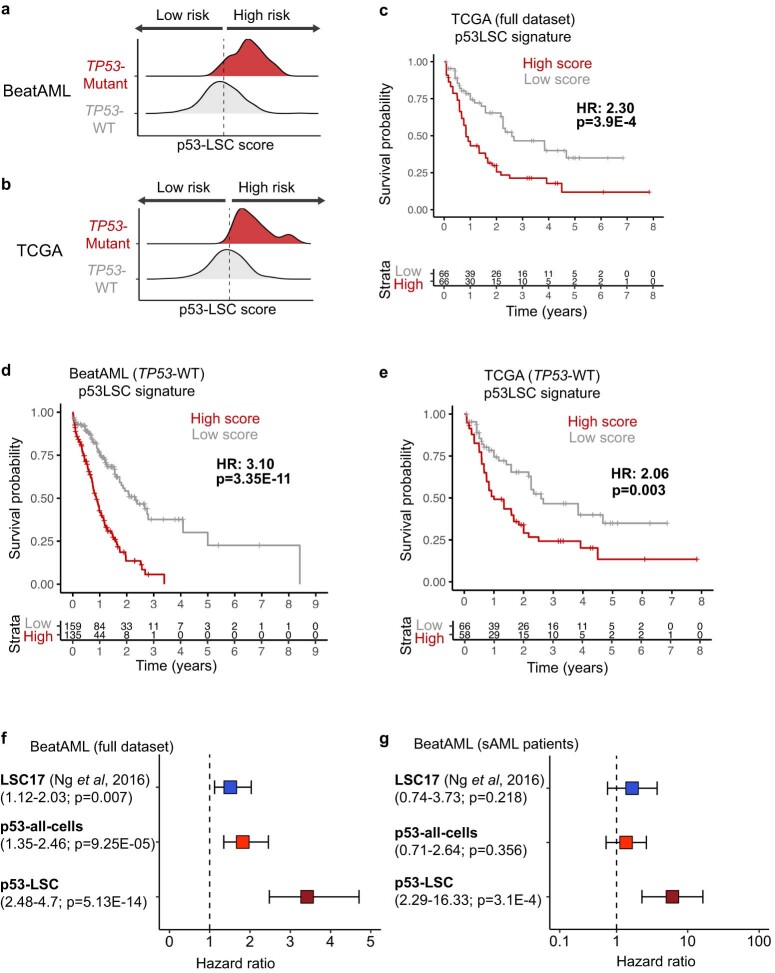
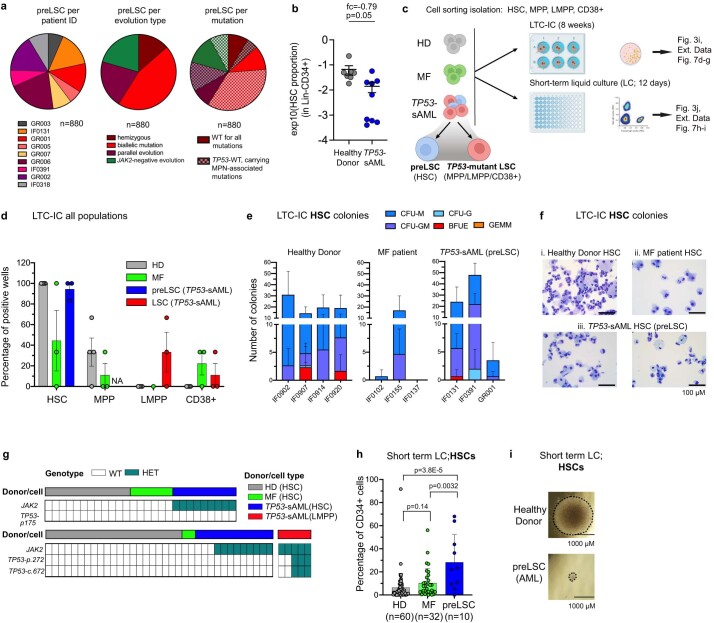
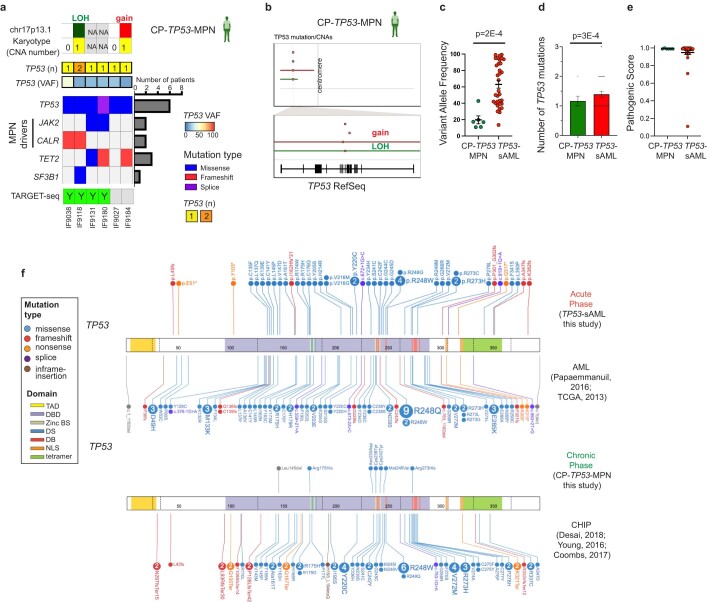
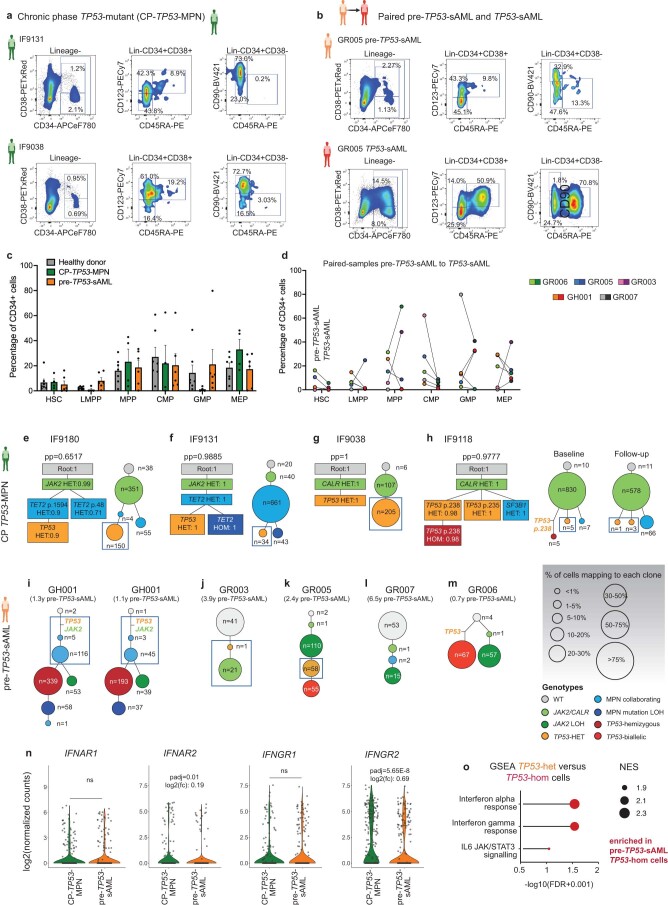
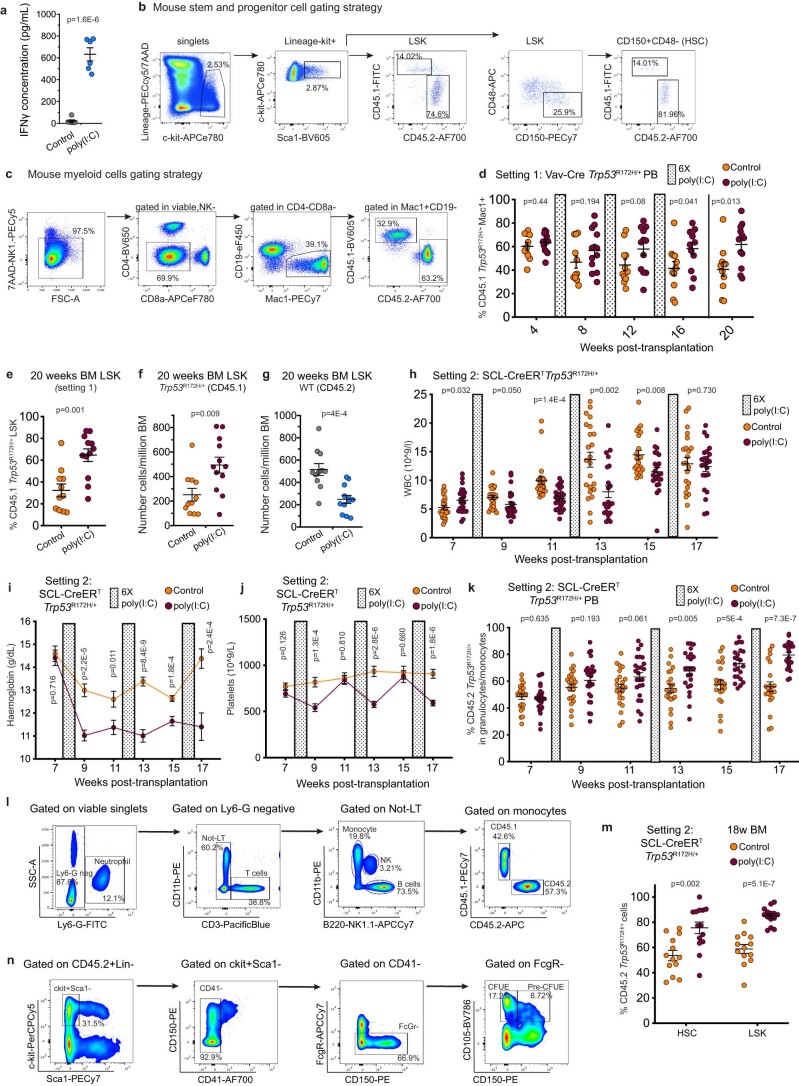
Understanding the genetic and nongenetic determinants of tumor protein 53 (TP53)-mutation-driven clonal evolution and subsequent transformation is a crucial step toward the design of rational therapeutic strategies. Here we carry out allelic resolution single-cell multi-omic analysis of hematopoietic stem/progenitor cells (HSPCs) from patients with a myeloproliferative neoplasm who transform to TP53-mutant secondary acute myeloid leukemia (sAML). All patients showed dominant TP53 'multihit' HSPC clones at transformation, with a leukemia stem cell transcriptional signature strongly predictive of adverse outcomes in independent cohorts, across both TP53-mutant and wild-type (WT) AML. Through analysis of serial samples, antecedent TP53-heterozygous clones and in vivo perturbations, we demonstrate a hitherto unrecognized effect of chronic inflammation, which suppressed TP53 WT HSPCs while enhancing the fitness advantage of TP53-mutant cells and promoted genetic evolution. Our findings will facilitate the development of risk-stratification, early detection and treatment strategies for TP53-mutant leukemia, and are of broad relevance to other cancer types.


Conflict of interest statement

A.R.M. and A.J.M. are authors on a patent related to TARGET-seq (US Patent App. 17/038,548). A patent relating to the TARGET-seq technique is licensed to Alethiomics, a spin-out company from the University of Oxford with equity owned by B.P. and A.J.M. and research funding to B.P. and A.J.M. The other authors declare no competing interests.

Figures

Fig. 1
Fig. 1. Clonal evolution of TP53-sAML.
a, Schematic study layout for TARGET-seq profiling of 17517 Lin-CD34+ HSPCs from 31 donors. be, Representative examples of the four major patterns of clonal evolution in TP53-sAML patients: bi-allelic mutations (b), hemizygous mutations (c), parallel evolution (d) and JAK2 negative bi-allelic evolution (e). The numbers in parenthesis indicate the number of patients in each category. The size of the circles is proportional to each clone’s size, indicated as a percentage of total Lin-CD34+ cells for one representative patient in each group; each clone is colored according to its genotype (related to Extended Data Fig. 2b–o) and red boxes indicate TP53 multihit clones. f, Representative examples from integrated mutation and CNA-based clonal hierarchies. Solid lines indicate the acquisition of a genetic hit (that is point mutation or CNA), whereas dotted lines indicate the specific genetic hit acquired in each step of the hierarchy (related to Extended Data Fig. 2p,q). g, Proportion of TP53 multihit cells classified as carrying clonal or subclonal CNAs in each patient, using a transcriptomic-based CNA clustering approach (inferCNV). h, Experimental strategy for xenotransplantation of CD34+ cells from TP53-sAML patients in immunodeficient mice. i, Percentage of cells carrying CNAs found in each PDX and corresponding Lin-CD34+ cells from the primary TP53-sAML sample transplanted (related to Extended Data Fig. 3; n = 1). j, Model of TP53-sAML genetic evolution. Created with BioRender.com.
Fig. 2
Fig. 2. Distinct differentiation trajectories and molecular features of TP53-sAML.
a, Three-dimensional diffusion map of 8988 Lin-CD34+ cells from 14 sAML samples colored by TP53 genotype (left), LSC score (middle) and erythroid transcription score (right). b, Monocle3 pseudotime ordering of the same single cells as in a. c,d, UMAP representation of an HD hematopoietic hierarchy (c; ref. ) and latent semantic index projection of TP53 multihit cells from 14 sAML patients (d, top) and cells from de novo AML patients (d, bottom; ref. ) onto the HD hematopoietic hierarchy atlas (c). e,f, Expression of an erythroid (e) and myeloid (f) gene score in AML patients from the BeatAML dataset stratified by TP53 mutational status (n = 329 TP53 WT; n = 31 TP53 mutant). g, CEBPA (top) and GATA1 (bottom) expression in the same cells as in a and b. h, CEBPA and GATA1 expression ratio in the same patient cohort as in e and f. i,j, Proportion of immature erythroid (CD235a+CD71+) and myeloid (CD14+, CD15+ or CD11b+) cells (i) and ratio of CEBPA to GATA1 expression in total cells (j) after 12 d of differentiation of peripheral blood CD34+ cells from patients with MPN transduced with shRNA targeting TP53 or shCTR. n = 5 patients, three independent experiments. Barplot indicates mean ± s.e.m. and two-tailed paired t-test P value (related to Extended Data Fig. 5n). k, Schematic representation of the key analytical steps to derive a 44-gene TP53-LSC sAML signature. l, Kaplan–Meier analysis of AML patients (n = 322) from the BeatAML cohort stratified by p53-LSC signature score (high, above median; low, below median) derived in k (related to Extended Data Fig. 6). P indicates log-rank test P value and HR, hazard ratio. All boxplots represent the median, first and third quartiles, and whiskers correspond to 1.5 times the interquartile range; ‘P’ indicates Wilcoxon rank sum two-sided test P value in panels e,f,h.
Fig. 3
Fig. 3. Molecular and functional analysis of pre-LSCs in TP53-sAML patients.
a, Three-dimensional diffusion map of 8,988 Lin-CD34+ cells from TP53-sAML patients (related to Fig. 2a) colored by expression of an HSC signature (Supplementary Table 3). b, Projection of TP53-WT (n = 880) pre-LSCs on HD (left) and MF (right) hematopoietic hierarchy (related to Fig. 2c and Extended Data Fig. 5d). c, Immunophenotype of Lin-CD34+CD38 cells from four representative sAML patients colored by genotype. Lin-CD34+CD38CD90+CD45RA cells (HSCs) were enriched using the sorting strategy outlined in Extended Data Fig. 2a. d, scVelo analysis of differentiation trajectories of Lin-CD34+ cells from one HD (left) and two representative TP53-sAML patients (middle and right). Insets show HSC or pre-LSCs clusters. eg, Scores of HSC (e), WNT β-catenin signaling (f) and cell-cycle (g) associated transcription in Lin-CD34+CD38 cells from HDs (n = 730 cells), MF (n = 1,106 cells) and pre-LSCs from TP53-sAML patients (n = 880 cells). Boxplots represent the median, first and third quartiles, and whiskers correspond to 1.5 times the interquartile range; the white square indicates the mean for each group. P indicates the Wilcoxon rank sum test P value. hj, Functional analysis of pre-LSCs. Schematic representation of HSC in vitro assays (h), LTC-IC colony forming unit activity (i) and short-term in vitro liquid culture clonogenicity (j) of HSC from HDs (n = 4), MF (n = 3) and pre-LSCs from TP53-sAML patients (n = 3, samples used (IF0131, IF0391 and GR001) were known to have TP53-WT pre-LSC in the HSC compartment). Violin plot indicates points’ density; dashed lines, median and quartiles, two independent experiments (i); barplot indicates mean ± s.e.m., three independent experiments with 30 colonies plated per experiment (j). P indicates two-tailed t-test P value. k, GSEA analysis of HALLMARK inflammatory pathways in pre-LSCs compared to HDs; positive NES in the heatmap represents significant (FDR q value < 0.25) enrichment in pre-LSCs, values indicate NES for each pathway. Source data
Fig. 4
Fig. 4. Inflammatory pathways are upregulated in TP53-mutant HSPCs before transformation.
a, Schematic study layout of the CP and paired samples patient cohort selected for TARGET-seq analysis. Created with BioRender.com. b, Clonal evolution of TP53-mutant CP patient samples without clinical evidence of transformation (CP-TP53-MPN, n = 4) and pre-TP53-sAML (patients who subsequently transformed to TP53-sAML) samples (n = 5). The size of the circles is proportional to the average percentage of cells mapping to each clone, and each clone is colored according to its genotype (related to Extended Data Fig. 9e–m). TP53-heterozygous cells selected for subsequent transcriptional analysis are indicated by the blue box. c,d, GSEA of selected differentially expressed pathways (c) and volcano plot of differentially expressed genes (d) in TP53-mutant heterozygous cells from CP TP53-MPN (green; n = 273 cells) and pre-TP53-sAML (orange; n = 296 cells). In d, genes involved in the IFN response are labeled. e, Expression of key IFN-response genes in TP53-heterozygous cells from the same patients as in c and d. In d and e, Padj indicates adjusted P value from combined Fisher’s exact test and Wilcoxon tests, calculated using Fisher’s method and adjusted using Benjamini–Hochberg procedure; FC indicates fold-change. Violin plots indicate log2(counts) distributions and each point represents the expression value of a single cell.
Fig. 5
Fig. 5. Inflammation promotes TP53-associated clonal dominance.
a, Experimental design of Vav-iCre WT:Trp53R172H/+ chimera serial poly(I:C) and LPS treatment. be, Analysis of chimera mice 20 weeks post-transplantation following three cycles of six poly(I:C) injections. Percentage of CD45.1 Trp53R172H/+ Mac1+ cells in the PB (b) or BM HSCs (Lin-Sca-1+c-Kit+CD150+CD48; c), number of BM CD45.1 Trp53R172H/+ HSC (d) and CD45.2 WT HSC (e) per million BM cells. n = 11–12 mice per group in two independent experiments and three biological replicates. Mean ± s.e.m. is shown and P indicates a two-tailed unpaired t-test P value. f,g, Analysis of chimera mice 20 weeks post-transplantation following three cycles of eight LPS injections. Percentage of CD45.1 Trp53R172H/+ Mac1+ cells in the PB (f), or BM LSKs (Lin-Sca-1+c-Kit+; g). n = 10–11 mice per group in two independent experiments and two biological replicates. Mean ± s.e.m. is shown and P indicates a two-tailed unpaired t-test P value. h, Experimental design of SCL-Cre-ERT WT:Trp53R172H/+ chimera serial poly(I:C) treatment. i,j, Absolute counts of CD45.1 WT or CD45.2 Trp53R172H/+ granulo-monocytic (Ly6G+ and/or Mac1+; i) and lymphoid (B220+/NK1.1+/CD3+; j) PB cells at 17 weeks post-transplant. k, Percentage of CD45.1 WT or CD45.2 Trp53R172H/+ erythroid progenitors (Lin-Sca-1-c-Kit+CD41FcgRII/IIICD105+) in total BM MNC at 18 weeks post-transplant. n = 22 control, n = 23 poly(I:C) groups (i, j) or n = 13 control, n = 14 poly(I:C) groups (k) from two independent experiments. Bars indicate mean ± s.e.m. and P indicates two-tailed unpaired t-test P value. l,m, Analysis of cell cycle (l) and apoptosis (m) in BM LSK cells from chimeric mice 18 weeks post-transplantation following three cycles of six poly(I:C) injections as in h. n = 13 control, n = 17 poly(I:C) groups (l) or n = 13 control, n = 14 poly(I:C) groups (m) from two independent experiments, mean ± s.e.m. is shown and P indicates adjusted P value from one-way Anova (in l, the P value was calculated using G0/G1 cell cycle phase).
Fig. 6
Fig. 6. Inflammation leads to genetic instability in Trp53-mutant cells.
ad, M-FISH karyotype analysis of LSK-derived cultured cells from CD45.1 (Trp53R172H/+) or CD45.2 (WT) LSKs obtained at terminal end-point from chimeric control or poly(I:C) treated mice as in Fig. 5a (n = 3 mice per group, n = 2 independent experiments). a, Percentage of normal and abnormal karyotypes in each experimental group. At the top of each bar, n indicates number of metaphases scored. b, Type of karyotypic aberrations per hundred metaphases. c, Violin plot of the number of karyotypic aberrations per single Trp53R172H/+ cell stratified by treatment. d, Representative karyotypes from Trp53R172H/+ cells obtained from control or poly(I:C) chimeras (yellow arrows indicate partial chromosome gains and green arrows indicate whole chromosome gains). Two-sided Fisher’s exact test was carried out to calculate P values; in c, Fisher’s exact test was calculated by testing metaphases with 3 or more aberrations versus metaphases with 0–2 aberrations. e, Schematic of the proposed model of TP53-mutant-driven transformation in MPN. Created with BioRender.com. Source data
Extended Data Fig. 1
Extended Data Fig. 1. Genetic landscape of TP53-sAML.
a, Mutations, CNAs, TP53 VAF and allelic status identified in a cohort of 33 TP53-sAML patients by bulk sequencing. The barplot on the right indicates the frequency of each mutation in the cohort. The panel at the bottom indicates samples processed by TARGET-seq. b-c, Graphical representation of all CNAs identified by MoChA (b) and GISTIC analysis of recurrently lost (blue) and amplified (red) focal regions (c) in the same patients as in (b). In b, GISTIC q-values of arm-level gains (red) and loses (blue) are indicated for each chromosome arm. In c, TP53 chromosomal location is indicated in blue (17p13.1). d-g, Summary of CNA events spanning recurrently mutated genes TP53 (d), JAK2 (e), EZH2 (f) and TET2 (g), with evidence of deletion or loss of heterozygosity in the single-cell phylogenies computed in Extended Data Fig. 2b-o. For each gene, top panel shows a whole chromosome view and the bottom one, the gene-level view and RefSeq track. Points indicate the location of each point mutation and solid lines indicate CNA status (blue:loss; red:gain; green:LOH). h, Sanger sequencing of single-molecule patient-derived TP53 cDNA showing mutually exclusive alleles in the same cDNA molecule. i, VAF of TP53 mutations in patients in which at least two TP53 mutations were detected. Blue line represents the linear fit of the points, which deviates from the indicated slope that would be expected if mutations were on the same allele. When more than 2 mutations were present, the 2 with the highest VAF were analyzed. j, Contingency table of TP53 zygosity status in single cells from patients carrying two TP53 mutations. Double-mutant heterozygous cells are colored in red, mutually exclusive WT/homozygous or homozygous/WT genotypes in orange and homozygous/homozygous cells, in blue. “p” indicates exact one-sided binomial test p-value.
Extended Data Fig. 2
Extended Data Fig. 2. TARGET-seq sorting strategy and phylogenetic reconstruction of clonal hierarchies in TP53-sAML patients using a Bayesian model.
a, Sorting strategy for TARGET-seq: Lineage-CD34+ cells were sorted into 384-well plates for subsequent library preparation. Selective enrichment of immunophenotypically defined populations (HSC: CD38CD90+CD45RA; CD117) is indicated with orange boxes. b-o, In each panel, corresponding to a different patient sample, the phylogenetic tree computed using SCITE is shown on the left and the number of cells mapping to each clone on the right. “pp” indicates the posterior probability of each consensus mutation tree, and the probability of each genotype transition is indicated inside each square for each mutation. The size of the circles is proportional to the size of each clone and is colored according to the genotype indicated. The number of cells mapping to each clone is indicated in each circle and the type of TP53 clonal evolution (biallelic mutation, hemizygous, parallel or JAK2-negative) below each patient’s ID. (*) indicates patients for which the high clonality of the sample prevented the faithful reconstruction of the order of mutation acquisition. Horizontal lines indicate mutation acquisition where none of the experimentally-detected clones matched that particular combination of mutations and therefore the order of mutations cannot be reliably determined. Due to selective enrichment of certain subpopulations of cells (a), the numbers of cells assigned to each subclone in this figure is not necessarily representative of overall clonal burden, and early clones are likely over-represented due to selective enrichment of preleukemic HSCs. In contrast, the relative subclone percentages displayed in Fig. 1 for the same patients have been corrected according to each populations’ frequency in the LinCD34+ compartment. p, Schematic representation of the strategy to reconstruct integrated clonal hierarchies based on single-cell TARGET-seq genotyping and inferCNV transcriptomic-based CNAs. q, Representative example of combined mutation and CNA hierarchies for patient IF0131, in which three cytogenetically-distinct subclones were detected. Corresponding cytogenetic lesions detected at the bulk level through high-density SNP arrays are shown in the bottom panels.
Extended Data Fig. 3
Extended Data Fig. 3. TP53-sAML xenograft characteristics.
a, Integration of index sorting and single cell genotyping of TP53 multi-hit HSPC from two representative patients (left) and quantification of genotypes across HSPC populations (right). b, Serial readouts of human chimerism based on hCD34 and hCD45 expression in mouse PB for IF0131 (n = 1) and GR001 (n = 3, mean ± s.e.m. indicated). c, Proportion of hCD45 and hCD34-positive cells in total bone marrow (BM) from each PDX sample. d, Representative images from BM blasts isolated from PDX models e-f, Representative HSPC flow cytometry profiles of patient IF0131 PB mononuclear cells (MNCs) (e) and BM engrafted cells in immunodeficient mice at 31 weeks post transplantation (f). g-h, Representative HSCP flow cytometry profiles of patient GR001 PB MNCs (g) and BM engrafted cells in immunodeficient mice at 27 weeks post-transplantation (h). i-l, Mutations (i,j) and CNAs (k,l) detected in sorted LMPPs (LinCD34+CD38CD90-CD45RA+) from indicated PDX samples (f,h). Boxes indicate location of each mutation (orange for mutant allele and blue, for WT) m, UMAP representation of TP53 multi-hit cells from patient IF0131; cells are colored according to their CNA status as in Fig. 1g. n, GSEA analysis of cytogenetically distinct subclones in patient IF0131. Pathways enriched in TP53 multi-hit abn3+del5+monosomy7 versus TP53 multi-hit abn3+del5 LinCD34+ are shown and colored according to pathway’s functional category. NES: Normalized Enrichment Score. FDR: False Discovery Rate.
Extended Data Fig. 4
Extended Data Fig. 4. Single cell transcriptomic analysis of healthy donor, MF and TP53-sAML HSPCs.
a, Force-atlas representation of 17517 cells from healthy donor (n = 9), MF (n = 8) and TP53-sAML patients (n = 14; preleukemic: TP53-WT, leukemic: TP53 multi-hit) according to patient type (left) or donor (right). b, Heatmap of the top 100 differentially expressed genes identified between TP53 multi-hit cells and preleukemic (TP53-WT; “preLSCs”), MF and healthy donor (HD) cells. The type of donor, donor ID and TP53 genotype is indicated on the top of the heatmap for each single cell. c, Venn diagram of the overlapping p53-target genes from Fischer et al and differentially expressed genes between TP53-multi-hit cells and TP53-WT cells. “p” indicates hypergeometric test p-value. d, GSEA analysis of LinCD34+ TP53 multi-hit LSC or erythroid-biased cells (Related to Fig. 2a) from TP53-sAML patients, compared to LinCD34+ healthy donor, MF and preLSCs. Heatmap indicates NES from selected genesets with FDR q-value < 0.25. NES: Normalized Enrichment Score; FDR: False Discovery Rate. NS: non-significant.
Extended Data Fig. 5
Extended Data Fig. 5. Aberrant erythroid differentiation in TP53 mutant AML.
a-b, Analysis of erythroid populations in TP53-sAML PDX models. Gating strategy used to identify CD253a+ and erythroid progenitor cells (“ProgE”) (a) and percentage of each erythroid population in hCD45+ bone marrow cells from PDX models (b). n = 5, bars indicate mean ± s.e.m. c, Percentage of cells expressing erythroid markers after culturing CD34 + TP53-sAML cells in conditions promoting myelo-erythroid differentiation in vitro. n = 4, bars indicate mean ± s.e.m. d-e, Force Atlas representation of a CD34+ myelofibrosis (MF) atlas (d; Psaila et al, 2020) and latent-semantic index projection of TP53 multi-hit cells from TP53-sAML patients into the MF cellular hierarchy (e). f, Projection of immunophenotypically-defined MEPs into a diffusion map of the single cells from all 14 TP53-sAML patients (as in Fig.2a). g-j, Expression of a comprehensive erythroid (g,h) and myeloid (i,j) gene score derived from a human haematopoietic atlas (Granja et al, 2019) in AML patients from the BeatAML dataset (g,i) and TCGA (h,j) stratified by TP53 mutational status (BeatAML: n = 329 TP53-WT and n = 31 TP53-mutant; TCGA: n = 140 TP53-WT, n = 11 TP53-mutant). k, Expression of a TP53-target gene score using the same p53 target genes as in Extended Data Fig. 4c in patients with high (above median) and low (below median) erythroid scores. l, GATA1/CEBPA gene expression in AML patients from the BeatAML dataset stratified by TP53 mutational status. In (g-l), boxplots represent median, first and third quartiles, and whiskers correspond to 1.5 times the interquartile range. “p” indicates two-sided Wilcoxon rank sum test p-values. m, Erythroid score (left) and CEBPA/GATA1 gene expression ratios (right) in MOLM13 TP53-mutant isogenic cell lines (Boettcher et al, 2019). Boxplots represent median, first and third quartiles, and whiskers correspond to 1.5 times the interquartile range. “p” indicates two-tailed unpaired t-test p-value. n, Fold-change TP53 expression in CD34+GFP+ MPN primary cells following transduction with a lentiviral shRNA vector targeting TP53 compared to a scramble control (shCTR). n = 3 patients, 3 independent experiments. Barplot indicates mean ± s.e.m. and “p”, two-tailed unpaired t-test p-value.
Extended Data Fig. 6
Extended Data Fig. 6. Validation of p53-LSC signature score in two independent cohorts.
a-b, Distribution of p53-LSC scores in BeatAML (a) and TCGA (b) cohorts stratified by TP53 mutational status. c-e, Kaplan-Meier analysis of de novo AML patients from the full TCGA AML dataset (n = 132) (c), TP53-WT AML patients from BeatAML (n = 294) (d) and TP53-WT AML patients from TCGA (n = 124) (e) stratified according to high or low p53 LSC signature score. f-g, Hazard ratio of all AML patients (n = 322) (f) or secondary AML patients (n = 49) (g) from the BeatAML cohort using LSC17 score (Ng et al, 2016), p53-all-cells score (derived from all TP53-mutant sAML cells) and p53-LSC signature score (derived from transcriptionally-defined LSCs; related to Fig. 2a). Boxes represent hazard ratios and lower and upper bounds of error bars, 95% confidence intervals. Genes used for each score are listed in Supplementary Table 4. “p” indicates log-rank test p-value.
Extended Data Fig. 7
Extended Data Fig. 7. In vitro assessment of self-renewal and differentiation potential in preleukemic cells from TP53-sAML patients.
a, Donor, type of clonal evolution and genotype of the 880 preLSCs identified. b, Proportion of HSCs in mobilized PB or BM from healthy donors (n = 7) and TP53-sAML patients (n = 9) in which preLSCs were detected. Graph shows mean ± s.e.m, “p” indicates two-tailed Student t-test p-value and “fc”, fold-change. c, Schematic representation of LinCD34+ cell fractions isolated and in vitro assays performed. TP53-sAML patient samples used (n = 3: IF0131, IF0391, GR001) were known to have TP53-WT preleukemic stem cells (preLSC) in the HSC compartment (Related to Fig. 3c). d-e, Long term culture-initiating cell in vitro assay. Percentage of positive wells in each immunophenotypic population (d) and clonogenic output (e) from healthy donor (HD, n = 4), MF (n = 3) and preLSCs from TP53-sAML (n = 3). Barplot indicates mean ± s.e.m. from 2 independent experiments. f, Representative cytospin images of HSC-derived colonies from the same patient groups as in (d-e). g, Genotyping of HSC and LMPP-derived colonies from the same LTC-IC assay as in (d-f), demonstrating absence of TP53 mutations in HSC-derived colonies, contrary to LMPPs. h, Percentage of CD34+ cells from healthy donor (HD, n = 4), MF (n = 3) and preLSCs from TP53-sAML (n = 2) after 12 days of liquid culture in conditions promoting hematopoietic differentiation. Barplot indicates mean ± s.e.m from 3 independent experiments, and “p”, two-tailed Student t-test p-value. i, Representative image of liquid culture HSC-derived colonies for healthy donor and TP53-sAML preLSCs, from the same experiment as in (h).
Extended Data Fig. 8
Extended Data Fig. 8. Genetic landscape of chronic phase TP53-mutant MPN.
a, Point mutations and cytogenetic abnormalities identified in a cohort of 6 CP TP53-MPN patients with no evidence of clinical transformation after 4.43 years [2.62-5.94] median follow-up. The number of patients in which each gene is mutated is shown on the barplot on the right and patients processed for TARGET-seq analysis are indicated below the heatmap. b, Summary of CNA events in chr17 and TP53 gene in the 2 CP TP53-MPN patients with detectable CNAs. The top panel shows a whole chromosome view and the bottom one, the gene-level view and RefSeq track. Points indicate the location of each point mutation and solid horizontal lines indicate CNA status. c-e, Comparison of variant allele frequency (c), number of TP53 mutations (d) and pathogenic scores (e) of TP53 variants identified in CP-TP53-MPN (n = 6) and TP53-sAML patients (n = 33). Mean ± s.e.m. is shown; “p” indicates two-tailed Mann-Whitney test p-value. f, Location and mutation type stratified by patient group (chronic/acute phase) as compared to previously published CHIP and AML patient cohorts.
Extended Data Fig. 9
Extended Data Fig. 9. Clonal evolution and molecular signatures of TP53-mutant patients at chronic phase.
a-b, Flow cytometry profiles of the LinCD34+ HSPC compartment in two CP TP53-MPN patients without evidence of clinical transformation (a) and in a representative paired chronic phase (b, up; pre-TP53-sAML) and acute phase (b, bottom; TP53-sAML) sample (Related to Fig. 4a). c-d, Percentage of immunophenotypic HSPC populations in normal donors (n = 8), CP TP53-MPN (n = 4) and pre-TP53-AML patients (n = 5) (c) or in the 5 paired pre-TP53-AML and TP53-AML samples (d). None of the population frequencies are significantly different (p < 0.05) between patient groups by multiple unpaired t-test analysis. In (c), barplot indicates mean ± s.e.m. e-h, Phylogenetic reconstruction of clonal hierarchies in CP TP53-MPN patients from single-cell TARGET-seq genotyping data. In each panel, the phylogenetic tree computed using SCITE is shown on the left, and the number of cells mapping to each clone for each patient, on the right. “pp” indicates posterior probability or each consensus mutation tree, and the probability of each genotype transition is indicated in the square for each mutation. For patient IF9118 (h), baseline (left) and 4 years of follow-up (right) samples are shown separately. i-m, Phylogenetic reconstruction of clonal hierarchies in pre-TP53-AML patients from single-cell TARGET-seq genotyping data (related to Extended Data Fig. 2). In panels (e-m), the size of the circles is proportional to each clone’s size, and is colored according to the genotype indicated in the genotype key. Blue boxes indicate TP53-heterozygous clones used for the analysis presented in Fig. 4c-e. n, Expression of interferon receptors in TP53-heterozygous cells from CP TP53-MPN (n = 273 cells) and pre-TP53-sAML patients (n = 296 cells). “p-adj” indicates adjusted p-value from combined Fisher’s exact test and Wilcoxon tests, calculated using Fisher’s method and adjusted using Benjamini & Hochberg procedure; “fc” indicates fold-change (related to Fig. 4d,e). Violin plots indicate log2(counts) distributions and each point represents the expression value of a single-cell. o, GSEA of inflammatory pathways in TP53-mutant heterozygous (n = 284) and homozygous (n = 622) cells from patients GH001 and GR005 at the pre-TP53-sAML stage. NES: Normalized Enrichment Score. FDR: False Discovery Rate.
Extended Data Fig. 10
Extended Data Fig. 10. Analysis of Trp53-mutant mice following inflammatory challenge.
a, IFNγ level in spleen serum 4 h after poly(I:C) injection. n = 6 mice per group from 2 independent experiments. Lines indicate mean ± s.e.m. and “p”, two-tailed unpaired t-test p-value. b-c, Gating strategy for mouse chimaera experiments (Related to Fig. 5) used to quantify BM LSK and HSCs populations (b) and myeloid cells in the peripheral blood (PB) (c). d-g, Analysis of WT:Trp53R172H/+ chimaera mice treated with 3 cycles of 6 poly(I:C) injections (related to model setting 1, Fig. 5a) with serial readouts of CD45.1 Trp53R172H/+ Mac1+ PB cells (d), percentage of CD45.1 Trp53R172H/+ BM LSK (LinSca-1+c-Kit+) (e), number of CD45.1 Trp53R172H/+ BM LSK (f) and CD45.2 WT BM LSK per million BM cells (g) 20 weeks post transplantation. n = 11-12 mice per group from 3 biological replicates in 2 independent experiments. h-k, Analysis of WT:Trp53R172H/+ chimaera mice treated with 3 cycles of 6 poly(I:C) injections (related to model setting 2, Fig. 5h) with serial readouts of white blood cells (h), hemoglobin (i) and platelet (j) counts measured every 2 weeks, and percentage of CD45.2 Trp53R172H/+ granulomonocytic (Ly6G and/or Mac1 + ) PB cells (k). l, Gating strategy for granulomonocytic (neutrophils and monocytes) and lymphoid (T, NK and B cells) populations in WT:Trp53R172H/+ chimaera mice. m, Percentage of CD45.2 Trp53R172H/+ BM HSC and LSK at 18 weeks post transplantation. n, Gating strategy for CFUE and PreCFUE populations in WT:Trp53R172H/+ chimaera mice. n = 22 control, n = 23 poly(I:C) groups (h-k) or n = 13 control, n = 14 poly(I:C) groups (m) from 2 independent experiments. Bars indicate mean ± s.e.m. and “p”, two-tailed unpaired t-test p-value.

References

    1. Sill H, Zebisch A, Haase D. Acute myeloid leukemia and myelodysplastic syndromes with TP53 aberrations—a distinct stem cell disorder. Clin. Cancer Res. 2020;26:5304–5309. doi: 10.1158/1078-0432.CCR-20-2272. - DOI - PMC - PubMed
    1. Bernard E, et al. Implications of TP53 allelic state for genome stability, clinical presentation and outcomes in myelodysplastic syndromes. Nat. Med. 2020;26:1549–1556. doi: 10.1038/s41591-020-1008-z. - DOI - PMC - PubMed
    1. Kastenhuber ER, Lowe SW. Putting p53 in context. Cell. 2017;170:1062–1078. doi: 10.1016/j.cell.2017.08.028. - DOI - PMC - PubMed
    1. Lindsley RC, et al. Acute myeloid leukemia ontogeny is defined by distinct somatic mutations. Blood. 2015;125:1367–1376. doi: 10.1182/blood-2014-11-610543. - DOI - PMC - PubMed
    1. Granfeldt Østgård LS, et al. Epidemiology and clinical significance of secondary and therapy-related acute myeloid leukemia: a national population-based cohort study. J. Clin. Oncol. 2015;33:3641–3649. doi: 10.1200/JCO.2014.60.0890. - DOI - PubMed

Publication types