. 2023 Oct;7(10):1600-1609.
doi: 10.1038/s41559-023-02173-y. Epub 2023 Sep 4.

Unveiling global species abundance distributions

Affiliations

Unveiling global species abundance distributions

Corey T Callaghan et al. Nat Ecol Evol. 2023 Oct.

Abstract

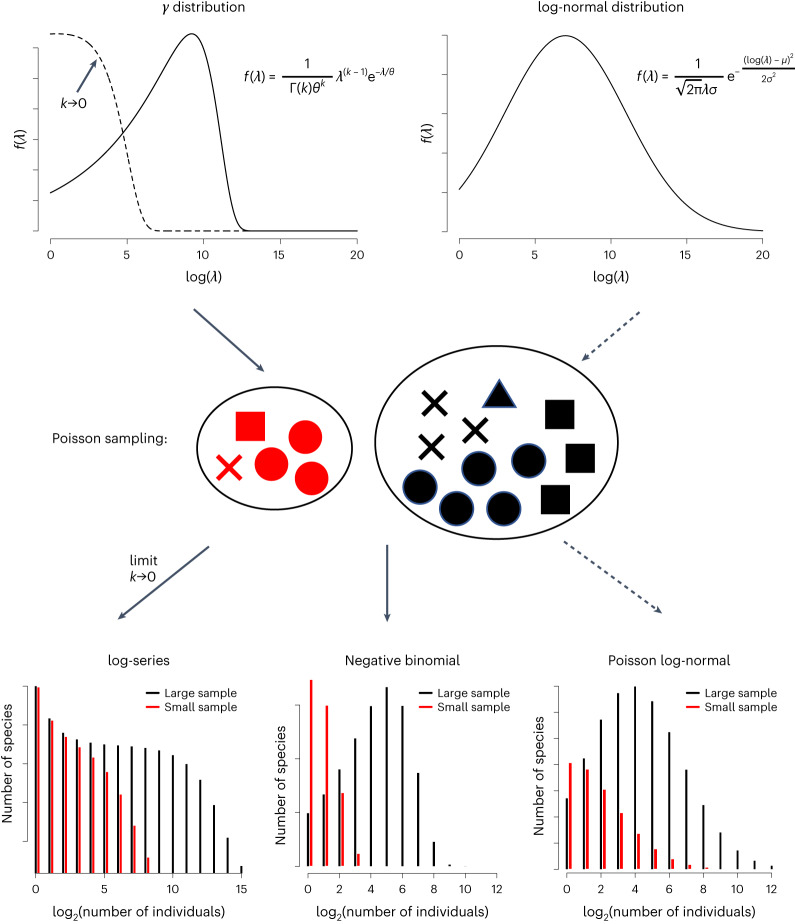
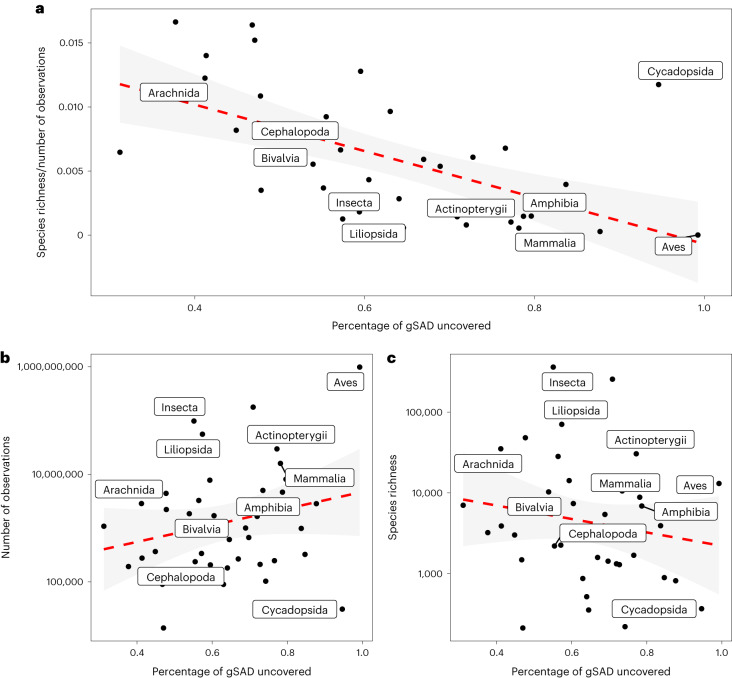
Whether most species are rare or have some intermediate abundance is a long-standing question in ecology. Here, we use more than one billion observations from the Global Biodiversity Information Facility to assess global species abundance distributions (gSADs) of 39 taxonomic classes of eukaryotic organisms from 1900 to 2019. We show that, as sampling effort increases through time, the shape of the gSAD is unveiled; that is, the shape of the sampled gSAD changes, revealing the underlying gSAD. The fraction of species unveiled for each class decreases with the total number of species in that class and increases with the number of individuals sampled, with some groups, such as birds, being fully unveiled. The best statistical fit for almost all classes was the Poisson log-normal distribution. This strong evidence for a universal pattern of gSADs across classes suggests that there may be general ecological or evolutionary mechanisms governing the commonness and rarity of life on Earth.


Conflict of interest statement

The authors declare no competing interests.

Figures

Fig. 1
Fig. 1. Conceptual scheme illustrating the Poisson sampling of a community with species abundances described by a gamma or a log-normal distribution.
Two types of gSAD—gamma (left) and log-normal distribution (right) are shown at the top. Each distribution represents the probability f of a species having a given abundance λ, with the gamma distribution having parameters k (shape) and θ (scale) and the log-normal distribution having parameters μ (mean) and σ (standard deviation), and Γ() representing the gamma function. In the middle, sampling of the gSAD with the probability of each species having a given number of individuals sampled described by a Poisson distribution is illustrated. The mean abundance of each species sampled is randomly taken from the SAD. We exemplify two samples of different sizes, where different symbols denote individuals of different species. The bottom graphs show that: if the global abundances have a log-normal distribution, the mixture distribution of abundances in the sample is a Poisson log-normal; if the global abundances follow a gamma distribution the resulting mixture distribution is a negative binomial but in the limit k→0, we obtain the Fisher log-series.
Fig. 2
Fig. 2. The temporal evolution of the gSAD.
From top to bottom: Actinopterygii, Amphibia, Arachnida, Aves, Bivalvia, Cephalopoda, Cycadopsida, Insecta, Liliopsida and Mammalia. For some classes, the apparent unveiling is evident, such as for Aves. Each year represents a rolling 20-year window in which GBIF observations were aggregated.
Fig. 3
Fig. 3. The temporal change in our statistical understanding of gSADs.
a, The final 20-year rolling window gSAD for each of ten example classes with the best fit overlaid for the log-series, negative binomial and Poisson log-normal distributions. b, Yearly goodness of fit (correlation) of each distribution for each 20-year rolling window gSAD. Example classes from top to bottom: Actinopterygii, Amphibia, Arachnida, Aves, Bivalvia, Cephalopoda, Cycadopsida, Insecta, Liliopsida and Mammalia.
Fig. 4
Fig. 4. How the relative position of the veil corresponds to species richness and the number of individuals in a class.
ac, The proportion of the gSAD uncovered, assuming a Poisson log-normal distribution, and its relationship to observed species richness/number of observations (a), number of observations (b) and species richness (c). To aid in visualizing the patterns, the red dashed line represents a fit from geom_smooth() and the shaded grey area represents the 95% confidence interval around that fit.

References

    1. Fisher RA, Corbet AS, Williams CB. The relation between the number of species and the number of individuals in a random sample of an animal population. J. Anim. Ecol. 1943;12:42–58.
    1. Gray J. Pollution-induced changes in populations. Philos. Trans. R. Soc. Lond. B. 1979;286:545–561. - PubMed
    1. Preston FW. The commonness and rarity of species. Ecology. 1948;29:254–283.
    1. Dewdney A. A dynamical model of abundances in natural communities. Coenoses. 1997;12:67–76.
    1. Green JL, Plotkin JB. A statistical theory for sampling species abundances. Ecol. Lett. 2007;10:1037–1045. - PubMed

Publication types