. 2023 Nov;15(11):1523-1531.
doi: 10.1038/s41557-023-01320-z. Epub 2023 Sep 4.

A SAM analogue-utilizing ribozyme for site-specific RNA alkylation in living cells

Affiliations

A SAM analogue-utilizing ribozyme for site-specific RNA alkylation in living cells

Takumi Okuda et al. Nat Chem. 2023 Nov.

Abstract

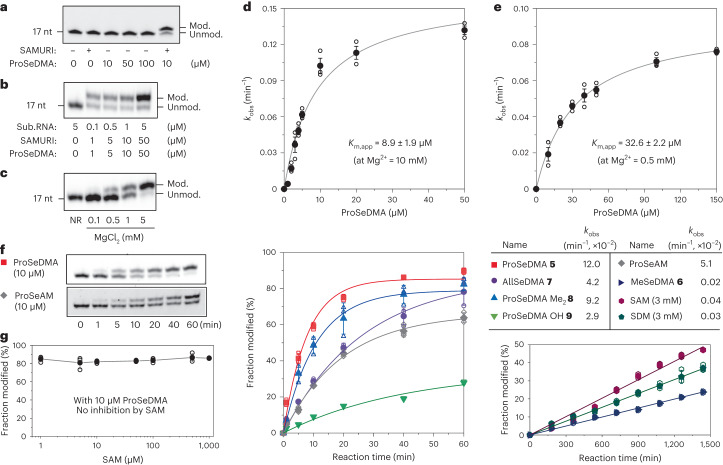
Post-transcriptional RNA modification methods are in high demand for site-specific RNA labelling and analysis of RNA functions. In vitro-selected ribozymes are attractive tools for RNA research and have the potential to overcome some of the limitations of chemoenzymatic approaches with repurposed methyltransferases. Here we report an alkyltransferase ribozyme that uses a synthetic, stabilized S-adenosylmethionine (SAM) analogue and catalyses the transfer of a propargyl group to a specific adenosine in the target RNA. Almost quantitative conversion was achieved within 1 h under a wide range of reaction conditions in vitro, including physiological magnesium ion concentrations. A genetically encoded version of the SAM analogue-utilizing ribozyme (SAMURI) was expressed in HEK293T cells, and intracellular propargylation of the target adenosine was confirmed by specific fluorescent labelling. SAMURI is a general tool for the site-specific installation of the smallest tag for azide-alkyne click chemistry, which can be further functionalized with fluorophores, affinity tags or other functional probes.


Conflict of interest statement

The authors declare no competing interests.

Figures

Fig. 1
Fig. 1. Design and characterization of ProSeDMA.
a, Chemical structure of SAM. b, Major degradation pathway of ProSeAM. c, Concept of ProSeDMA. Terminal amide substitution inhibits self-degradation, and 2-aminoadenosine may assist binding to a ribozyme. DAP = 2,6-diaminopurine. d, Synthesis of ProSeDMA. The asterisk indicates a stereocentre. e, Other SeDMA analogues synthesized. f, Stability comparison between ProSeDMA (left) and ProSeAM (right). 1 mM cofactor was incubated in 50 mM HEPES (pH 7.0), 120 mM KCl, 5 mM NaCl and 10 mM MgCl2 at 37 °C. Aliquots were analysed by RP–HPLC, monitored at 260 nm.
Fig. 2
Fig. 2. Identification and analysis of ProSeDMA utilizing ribozyme (SAMURI).
a, Schematic of SAMURI-catalysed trans-propargylation to target adenosine. b, Sequence and predicted secondary structure of SAMURI. c, Polyacrylamide gel electrophoresis (PAGE, top) and anion-exchange HPLC analysis (bottom) of the SAMURI-catalysed reaction of 17-mer substrate RNA (S, 5′-ACAUACUGAGCCUUCAA-3′) with and without ProSeDMA at 37 °C for 1 h; 1 μM substrate RNA, 1 μM SAMURI, 10 μM ProSeDMA and 10 mM MgCl2, pH 7.5. PAGE also shows the reactivity test of transferred alkyne by CuAAC with biotin azide (10 μM mod. RNA, 500 μM CuBr, 1 mM TBTA and 1 mM biotin azide in H2O/DMSO/tBuOH = 5/3/1 at 37 °C for 1 h). AIE-HPLC = anion-exchange HPLC. d, Alkaline hydrolysis and RNase T1 digestion of reacted RNA (mod., product P) in comparison to untreated RNA (unmod., S). The image is representative of two independent experiments with similar results. e, Atomic mutagenesis of substrate RNA. Reaction conditions are as in c. A representative gel image is shown, and a histogram showing individual data points and the mean ± s.d. of three independent experiments. f, MALDI–TOF mass spectra of unmodified RNA (grey, m/z = 6,155.04), a mixture of modified RNA (blue, m/z = 6,193.06) and ribozyme, and modified RNA after PAGE purification (red, m/z = 6,183.08). g, Plausible reaction pathway causing a mass shift after purification. h, LC/MS analysis of the digested 12-mer substrate RNA (5′-CUACUGAGCCUU-3′) before and after modification, showing the UV (260 nm) trace and extracted ion chromatogram (EIC, detecting m/z = 296.13). p1A = 1-propargyladenosine, pO2A = 2′-O-propargyladenosine, p6A = N6-propargyladenosine. Source data
Fig. 3
Fig. 3. Characterization of SAMURI.
a, Evaluation of unspecific modification by ProSeDMA. In the absence of ribozyme, 1 μM RNA substrate was incubated with an increasing concentration of ProSeDMA at 37 °C for 1 h. b, Catalytic activity of SAMURI under varying conditions. The ratio of RNA:SAMURI:ProSeDMA was kept at 1:10:10. Sub.RNA = substrate RNA. c, Mg2+ dependence of SAMURI (1 µM RNA, 1 µM SAMURI, 10 µM ProSeDMA, varying Mg2+ as indicated, 37 °C, 1 h). NR = no reaction. d,e, ProSeDMA concentration dependence of the observed rate constant kobs at 10 mM Mg2+ (d) and 0.5 mM Mg2+ (e). Data are fitted to the Michaelis–Menten equation. f, Scope of SAMURI with various SAM analogues. kobs values were obtained under pseudo-first-order reaction conditions for 60 min. For MeSeDMA, SAM and SDM, incubation was extended to 24 h, and a linear fit was applied because of the low reactivity. All cofactors were used at 10 µM, except for SAM and SDM, which were used at 3 mM. g, Inhibition assay: SAMURI trans-propargylation activity was not inhibited by SAM. Conditions are as in c, with increasing concentrations of SAM as indicated. a,b,c,f show representative images of three independent experiments, with similar results. In d,e,g, individual data points and the mean ± s.d. of three independent experiments are shown. Source data
Fig. 4
Fig. 4. SAMURI activity in living cells.
a, Schematic illustration of genetically encoded cis-active SAMURI. HEK293T cells grown in a cell culture dish were transfected with plasmid, and the cSAMURI-expressing cells were treated with ProSeDMA. The intracellularly propargylated RNA was isolated and labelled with Cy5 azide. The modification yield was quantified based on the fluorescence intensities of Cy5 and DFHBI-1T. b, Transfected cells stained with DFHBI-1T show expression of cSAMURI. c, Cell viability measured by trypan blue staining. Individual data points and the mean ± s.d. of four independent experiments are shown. d, Total RNA analysis on PAGE. The gel was visualized in the Cy5 channel, then stained with 20 μM DFHBI-1T and then stained by SYBR Gold. e, Intracellular labelling efficiency of cSAMURI calculated from the Cy5/DFHBI-1T ratio, relative to the in vitro labelling efficiency of RNA extracted from cells that were not treated with ProSeDMA. The reference was prepared in the test tube using 200 ng total RNA, 50 μM ProSeDMA and 10 mM MgCl2, pH 7.5 at 37 °C for 1 h. Individual data points and the mean ± s.d. of three independent experiments are shown. RNA mod. rel. = relative intracellular RNA modification efficiency. Source data
Extended Data Fig. 1
Extended Data Fig. 1. Enzymatic recognition of SAM analogues by MTase (M.EcoR1).
a. Structures of cofactors used. b. Plasmid (pET-14b) was subjected to enzymatic modification with M.EcoRI and the respective cofactor, and the modification efficiency was analyzed by restriction enzyme R.EcoRI. c. Plasmid (pET-14b) was fist linearized by digestion with restriction enzyme PvuII, and then treated as in b. Transalkylation conditions: 150 ng Plasmid / linear DNA, 100 μM SAM analogue, 50 mM Tris-HCl, 50 mM NaCl, 10 mM EDTA (pH = 8.0), 40 U M.EcoR1 MTase 37 °C for 1 h. Then the MTase was inactivated by heating to 65 °C for 20 min. Restriction enzyme condition: 20 U R.EcoR1, 37 °C for 1 h. Analysis condition: 0.8% agarose gel (75 V, 45 min), staining: SYBR green. Representative images of two independent experiments with similar results are shown. Source data
Extended Data Fig. 2
Extended Data Fig. 2. In vitro selection of trans-propargylation ribozymes.
In vitro selection was proceeded by incubation, CuAAC reaction, separation, amplification and transcription steps. The RNA library contains an unpaired adenosine (red, A) and is connected to the 40 random nucleotides via the single-stranded loop. Incubation was done in 5 μM RNA, 5 μM cofactor 5 or 9, 50 mM HEPES, pH 7.5, 120 mM KCl, 5 mM NaCl and 10 mM MgCl2, at 37 °C for 1 h. Then, propargylated RNA was modified with biotin in 100 μM RNA, 500 μM biotin azide, 1 mM CuBr and 2 mM TBTA. For capture, beads were blocked with E. coli tRNA; streptavidin and neutravidin beads were switched every two rounds. Denaturing wash buffer was 8 M urea, 10 mM Tris-HCl, pH 7.5, 1 mM EDTA, 0.01% Tween-20. Elution used 95% formamide, 1 mM EDTA, at 95 °C for 5 min. For RT–PCR, one-pot RT–PCR reaction was used with the following conditions: 42 °C, 30 min, 10 cycles of PCR with 1 μM primer D5 and 0.5 μM primer D3. For the following PCR, we used: 30 cycles, 10% (v/v) RT–PCR product as template, 1 μM D4 and 0.5 μM D5, 10% (v/v) DMSO, and an annealing temperature of 63 °C. For in vitro transcription, T7 RNA polymerase was used with dsDNA template obtained from a 200 μL PCR reaction, in 100 μL transcription reaction volume with 4 mM each NTP, 37 °C for 15 h, followed by PAGE purification.
Extended Data Fig. 3
Extended Data Fig. 3. Identification of candidates of alkyltransferase ribozyme from in vitro selection libraries.
Four sequences were identified from each library (OH series used cofactor 9; NH2 series used cofactor 5 during selection). Trans alkylation activity was evaluated by streptavidin gel shift assay on native PAGE (the qualitative screening assay was performed once). Condition: 5 pmol RNA, 1 μg of streptavidin in 1x TBS buffer. Source data
Extended Data Fig. 4
Extended Data Fig. 4. Sequence and predicted secondary structure of Rz3 ribozyme and its trans-active variants.
a. Minimization and mutation analysis. Conditions for trans activity assay: 1 μM 3’-labelled substrate RNA, 1 μM Rz3 or indicated mutant, 10 μM ProSeDMA and 10 mM MgCl2 were incubated at 37 °C for 1 h. b. Primer extension assay was performed after incubation of cis-Rz3’ transcript with ProSeDMA or MeSeDMA. Condition:10 pmol modified cis ribozyme, 10 pmol FAM labelled DNA primer, 1x first strand buffer (50 mM Tris-HCl pH8.3, 75 mM KCl and 3 mM MgCl2), 5 mM DTT, 0.5 mM of each dNTP and SuperScript III RT (ThermoFisherScientific) were incubated at 55 °C for 30 min. c. Transplanting the catalytic core to target an alternative adenosine (A9 instead of A5). Conditions as in (a) for 1 h, 3 h, or overnight (ON). NT, no treatment. Products (P) were isolated and subjected to alkaline hydrolysis. The shifted band in comparison to the alkaline hydrolysis pattern of the unmodified RNA (S) identified the modification site. d. SAMURI activity and sequence specificity with different base-pairs flanking the modification site. The mutated ribozymes and 19-nt long substrate RNAs were prepared by in vitro transcription. The substrate RNAs were labelled with fluorescein at the 3’-end after oxidation with periodate. SAMURI reaction conditions as in (a) with time points up to 1 h as indicated. Representative images are shown of two (a, b, c) or three (d) independent experiments with similar results. Source data
Extended Data Fig. 5
Extended Data Fig. 5. Mass spectrometric analysis of alkylated RNA products including atomic mutagenesis.
ESI-MS of PAGE-purified 17-nt RNAs (5’-ACAUACUGAGCCUUCAA-Cy5); deconvoluted mass spectra are shown; Chemical formula and calculated masses are given in the Supporting Information (Supplementary Table 3).
Extended Data Fig. 6
Extended Data Fig. 6. Scope of SAMURI trans activity.
Gel images for kinetics graphs shown in Fig. 3f (ProSeDMA and ProSeAM gels are same as in Fig. 3f, here reproduced for comparison). Conditions: 10 pmol Cy5 labelled substrate RNA and 100 pmol SAMURI in reaction buffer (50 mM HEPES, 120 mM KCl and 5 mM NaCl); after annealing (3 min at 95 °C, 10 min at 25 °C), 10 mM MgCl2 and 100 pmol respective cofactor (or 30 nmol SAM) were added (total reaction volume 10 μL). Incubation at 37 °C, 1 μL aliquots mixed with 4 μL of stop solution; kobs determined from pseudo-first order curve fit; Representative gel images of three independent replicates for all cofactors, except for MeSeDMA and SAM two replicates.
Extended Data Fig. 7
Extended Data Fig. 7. LC/MS analysis of digested RNA products containing methyl (a) and allyl (b) modification.
a,b, After incubation with SAMURI and MeSeDMA or AllSeDMA, respectively, the RNAs were isolated by PAGE and then digested by bacterial alkaline phosphatase and snake venom phosphodiesterase (in 40 mM Tris-HCl, 20 mM MgCl2, pH 7.5). After extraction with chloroform, the aqueous layer was concentrated, and the residue was dissolved in 70 μL 5 mM NH4OAc and analyzed by LC-MS, using a Synergi Fusion RP HPLC column (Phenomenex, 4 μm, 250 × 2 mm). The analysis was run with a gradient of B from 0% - 5% (0 min to 15 min) and 5% - 72.5% (15 min to 45 min); solvent A was 10 mM NH4OAc (pH 5.3); solvent B was MeCN; flow rate was 0.2 mL/min at 25 °C with UV detection at 260 nm and ESI mass spectrometry in positive-ion mode.
Extended Data Fig. 8
Extended Data Fig. 8. LC/MS analysis of ProSeDMA in HEK293T cell lysate.
a. Schematic illustration for generation of a calibration curve with known concentrations of ProSeDMA spiked into HEK293T cell lysate. b. Extracted ion chromatogram (EIC) for ProSeDMA and MS spectrum at 17 min retention time in cell lysate. The fragmentation pattern was as detected by HR-ESI analysis of purified cofactor (shown in supporting information) c. Calibration curve of peak area versus injected amount of ProSeDMA; mean ± SD of three independent experiments. d. Schematic illustration of LC/MS analysis of ProSeDMA in the lysate of cells which were treated with various concentrations of ProSeDMA (0, 0.1, 0.5, 1, 3 mM in the medium). e. Detected ProSeDMA EIC chromatogram peak from cell samples. f. Detected peak area from the samples in e plotted on the calibration curve from c. g. ProSeDMA concentration in the cell lysate, calculated in nmol / 106 cells. Individual data points and the mean ± SD of three independent experiments are shown. Source data

References

    1. Klöcker N, Weissenboeck FP, Rentmeister A. Covalent labeling of nucleic acids. Chem. Soc. Rev. 2020;49:8749–8773. doi: 10.1039/D0CS00600A. - DOI - PMC - PubMed
    1. Depmeier H, Hoffmann E, Bornewasser L, Kath-Schorr S. Strategies for covalent labeling of long RNAs. ChemBioChem. 2021;22:2826–2847. doi: 10.1002/cbic.202100161. - DOI - PMC - PubMed
    1. Tomkuviene M, Mickute M, Vilkaitis G, Klimasauskas S. Repurposing enzymatic transferase reactions for targeted labeling and analysis of DNA and RNA. Curr. Opin. Biotechnol. 2019;55:114–123. doi: 10.1016/j.copbio.2018.09.008. - DOI - PMC - PubMed
    1. Deen J, et al. Methyltransferase-directed labeling of biomolecules and its applications. Angew. Chem. Int. Ed. 2017;56:5182–5200. doi: 10.1002/anie.201608625. - DOI - PMC - PubMed
    1. Fischer TR, et al. Chemical biology and medicinal chemistry of RNA methyltransferases. Nucleic Acids Res. 2022;50:4216–4245. doi: 10.1093/nar/gkac224. - DOI - PMC - PubMed

Publication types