. 2023 Oct;24(10):1654-1670.
doi: 10.1038/s41590-023-01605-y. Epub 2023 Sep 4.

Kunitz-type protease inhibitor TFPI2 remodels stemness and immunosuppressive tumor microenvironment in glioblastoma

Affiliations

Kunitz-type protease inhibitor TFPI2 remodels stemness and immunosuppressive tumor microenvironment in glioblastoma

Lizhi Pang et al. Nat Immunol. 2023 Oct.

Abstract

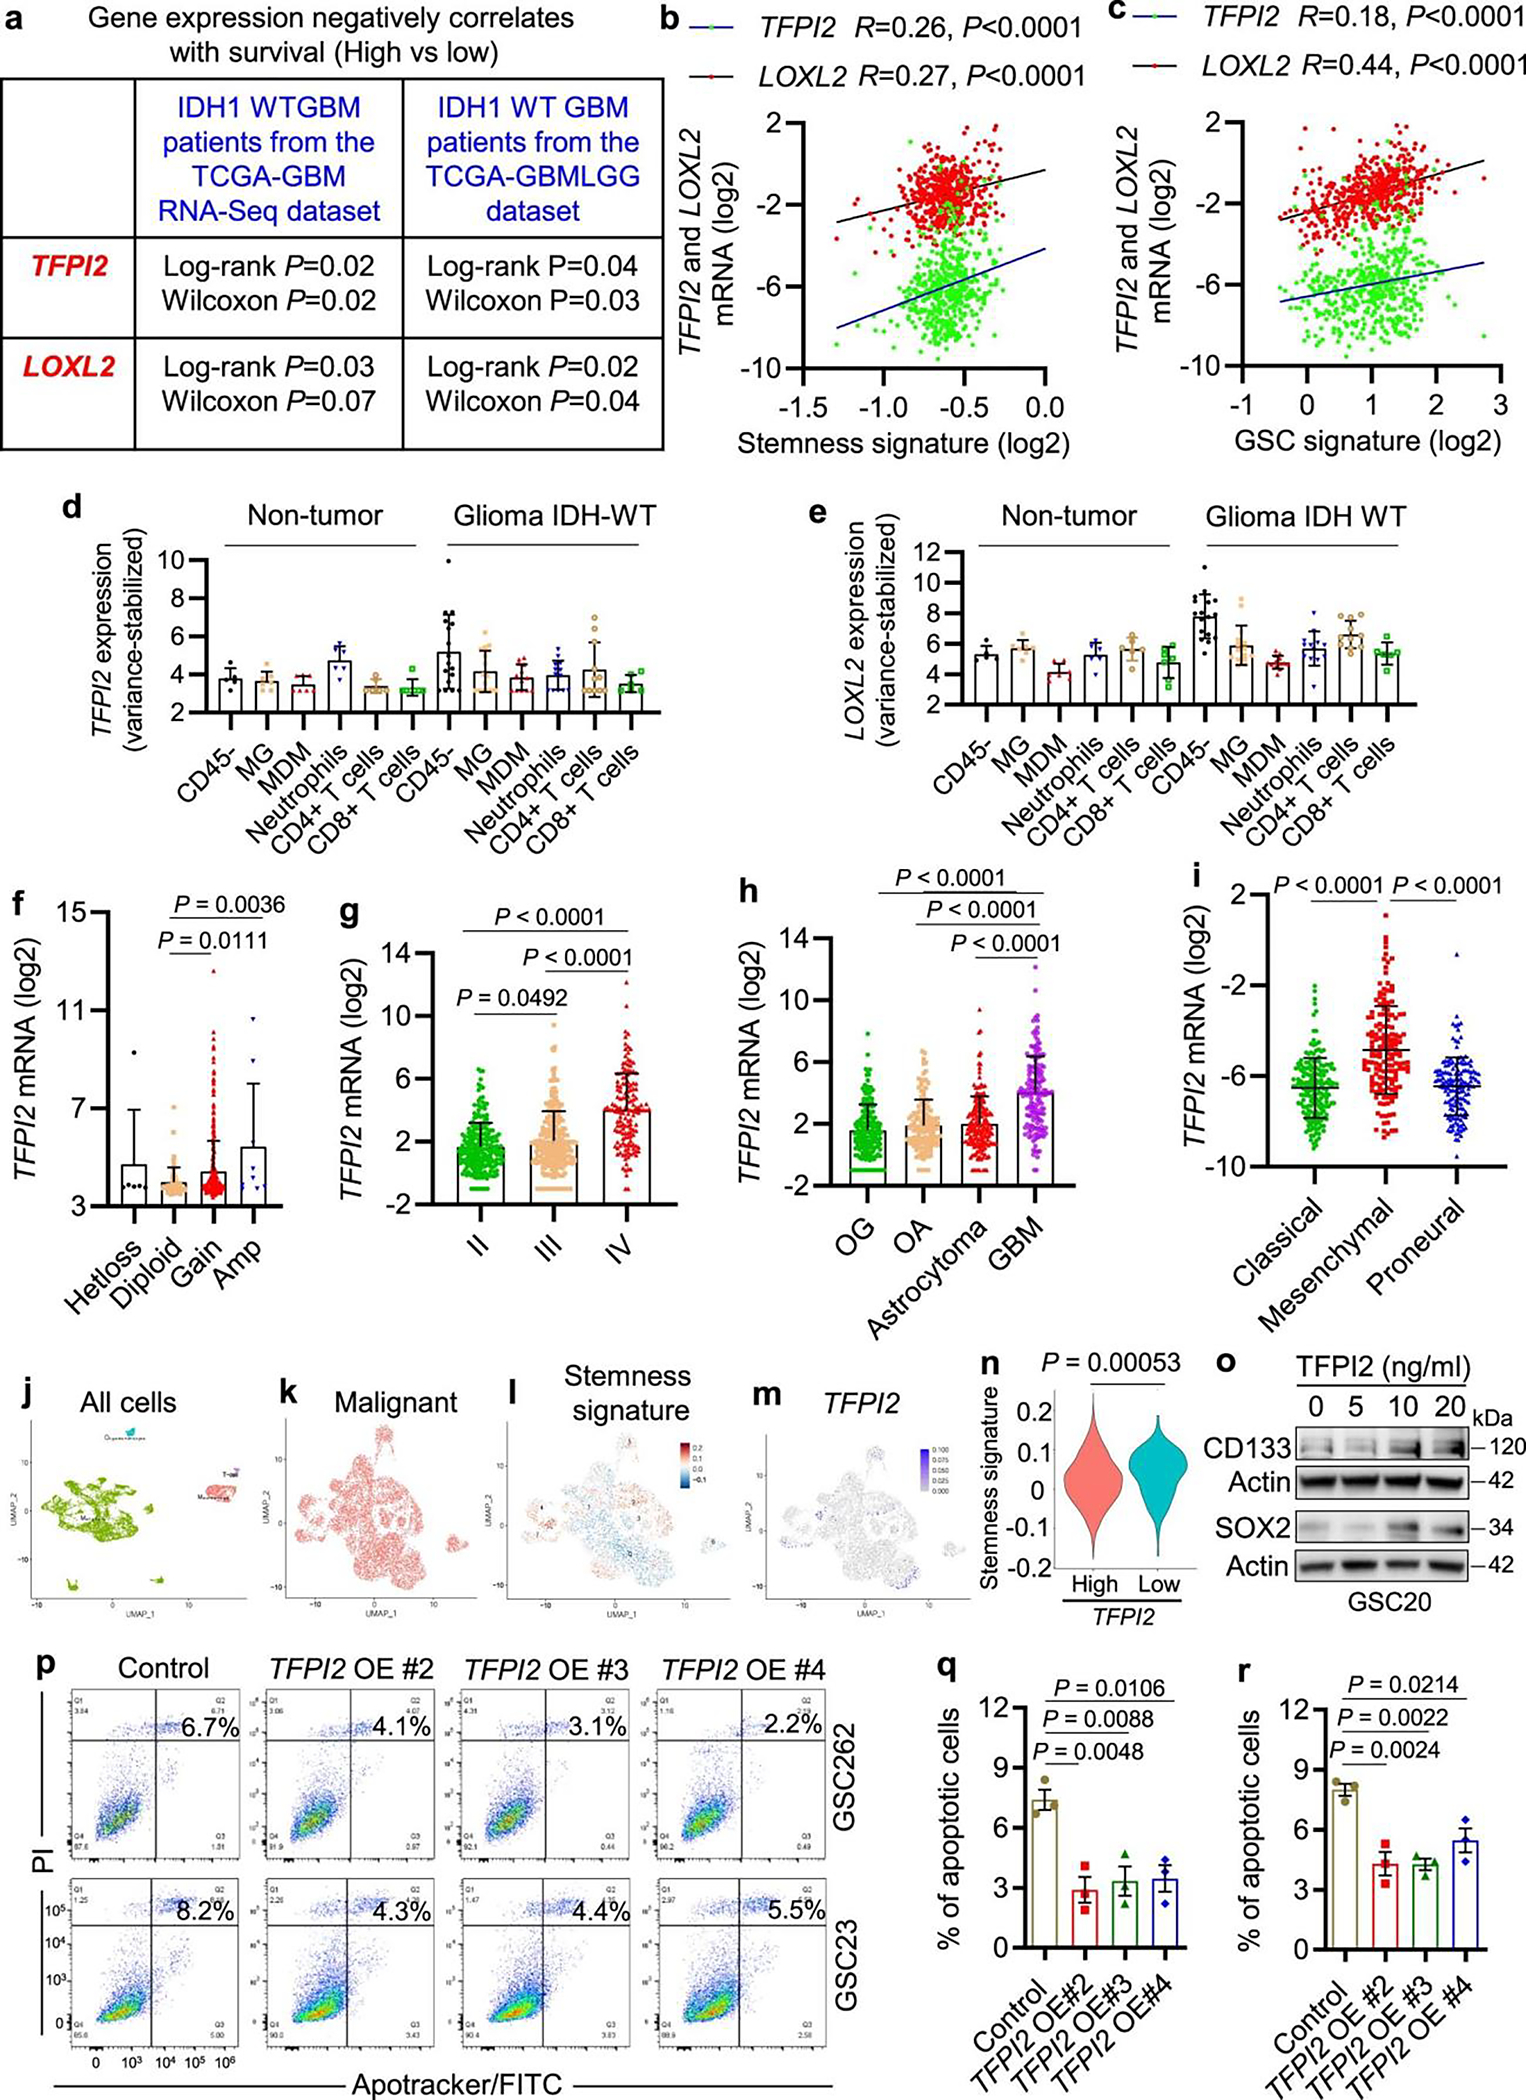
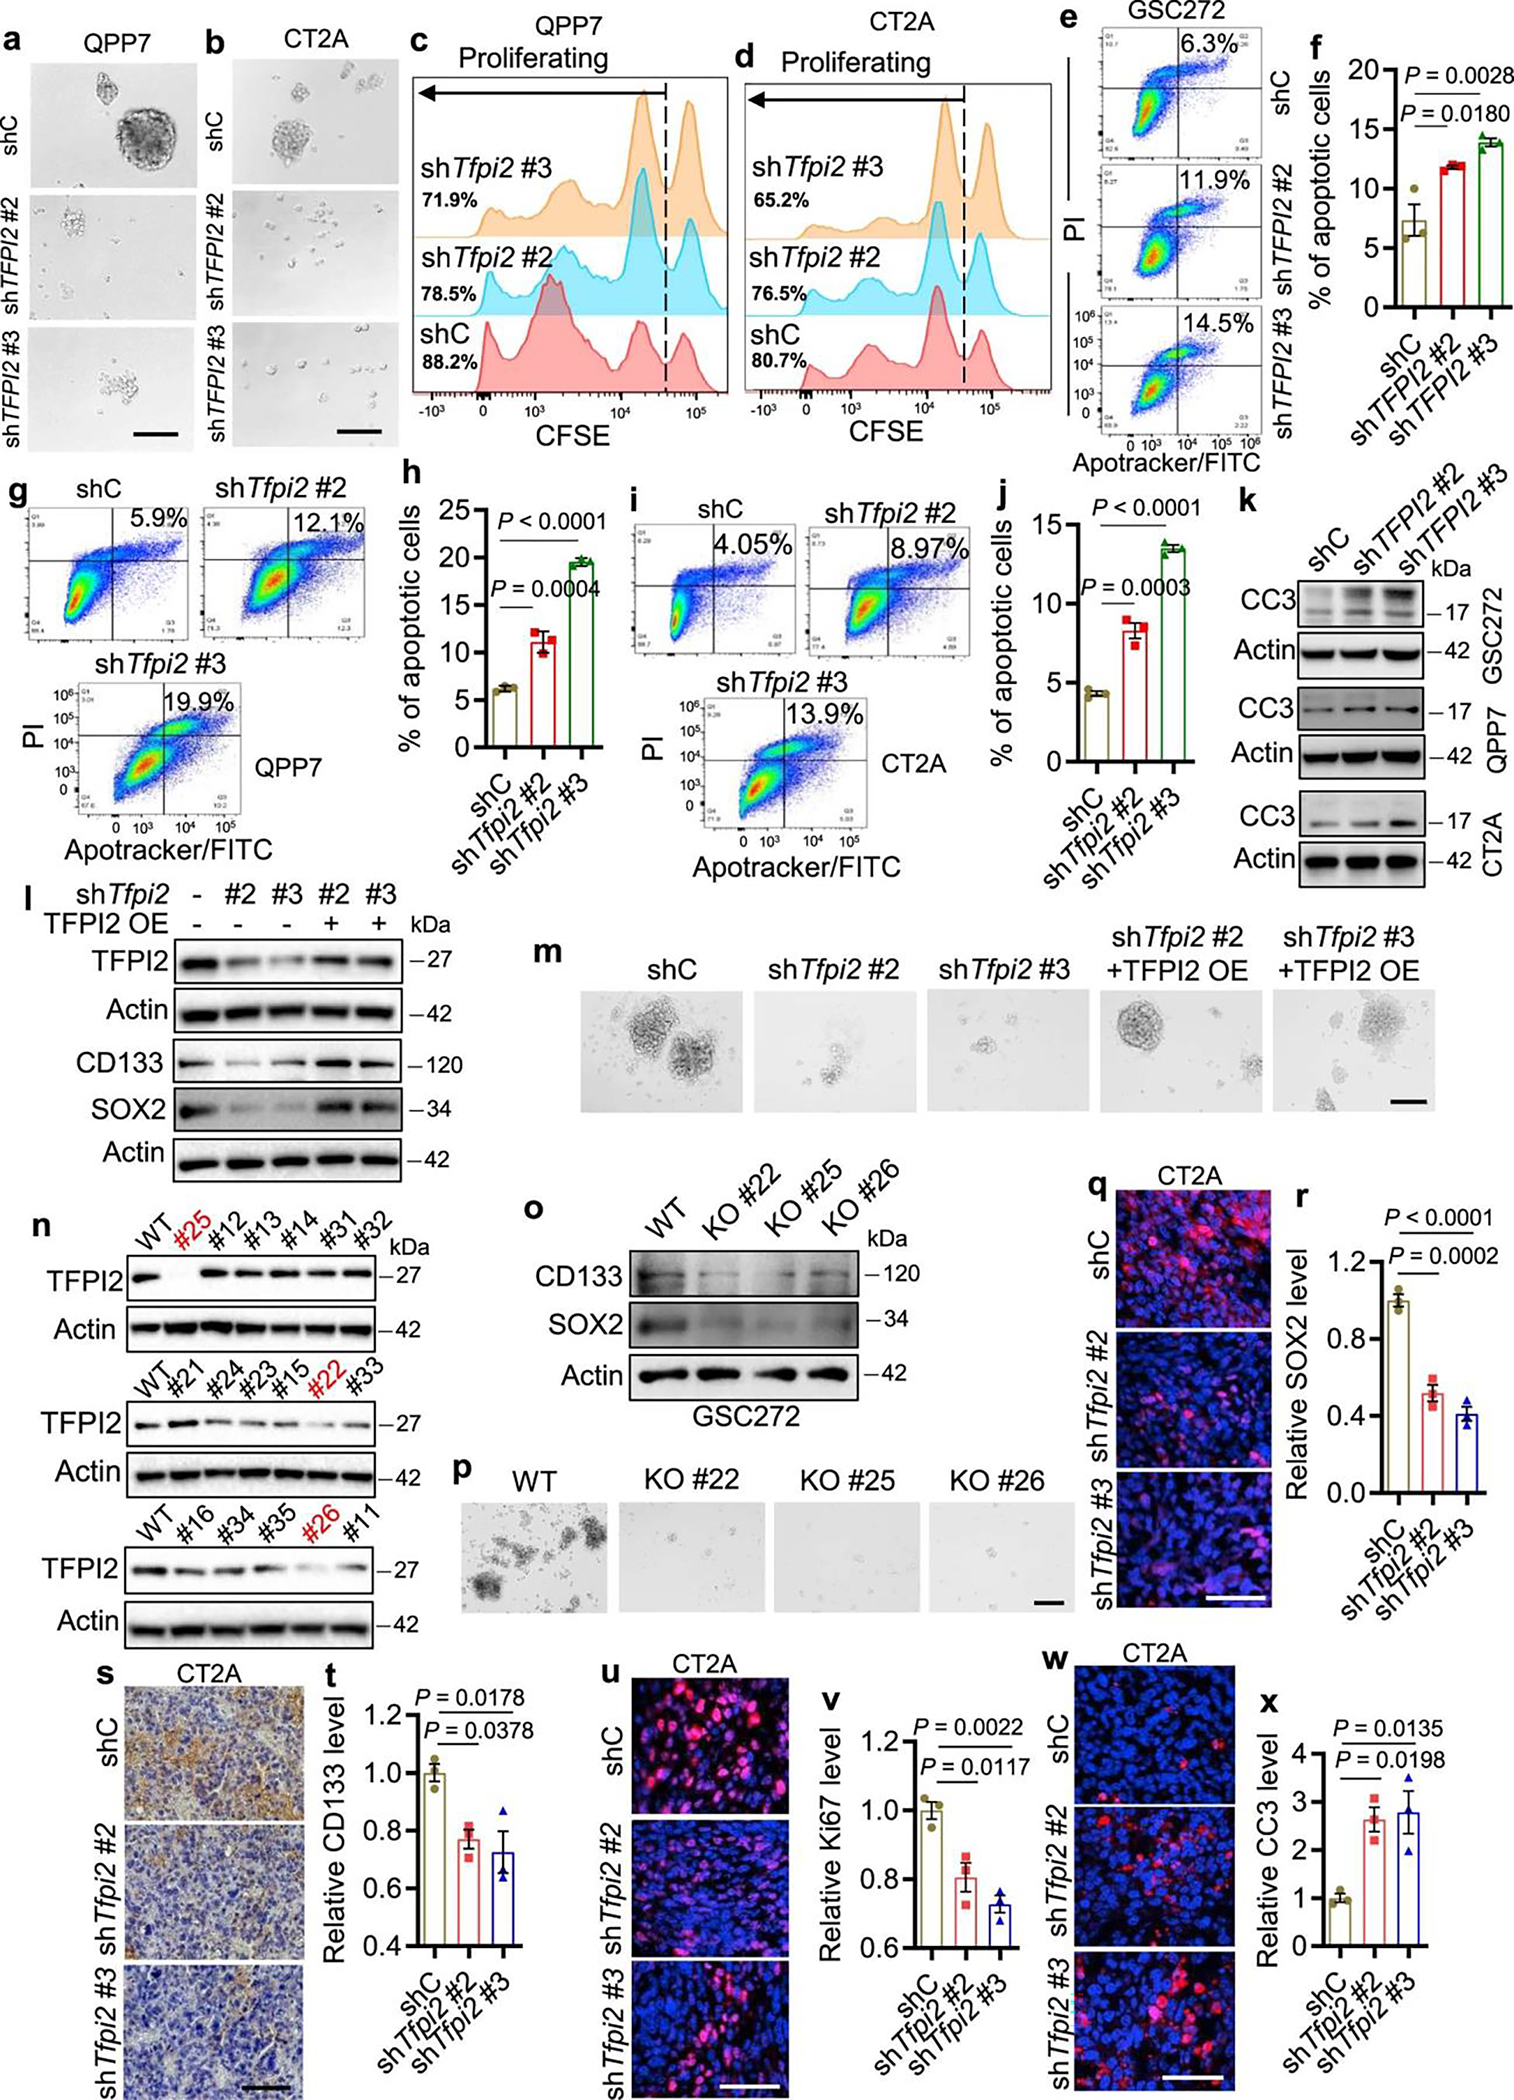
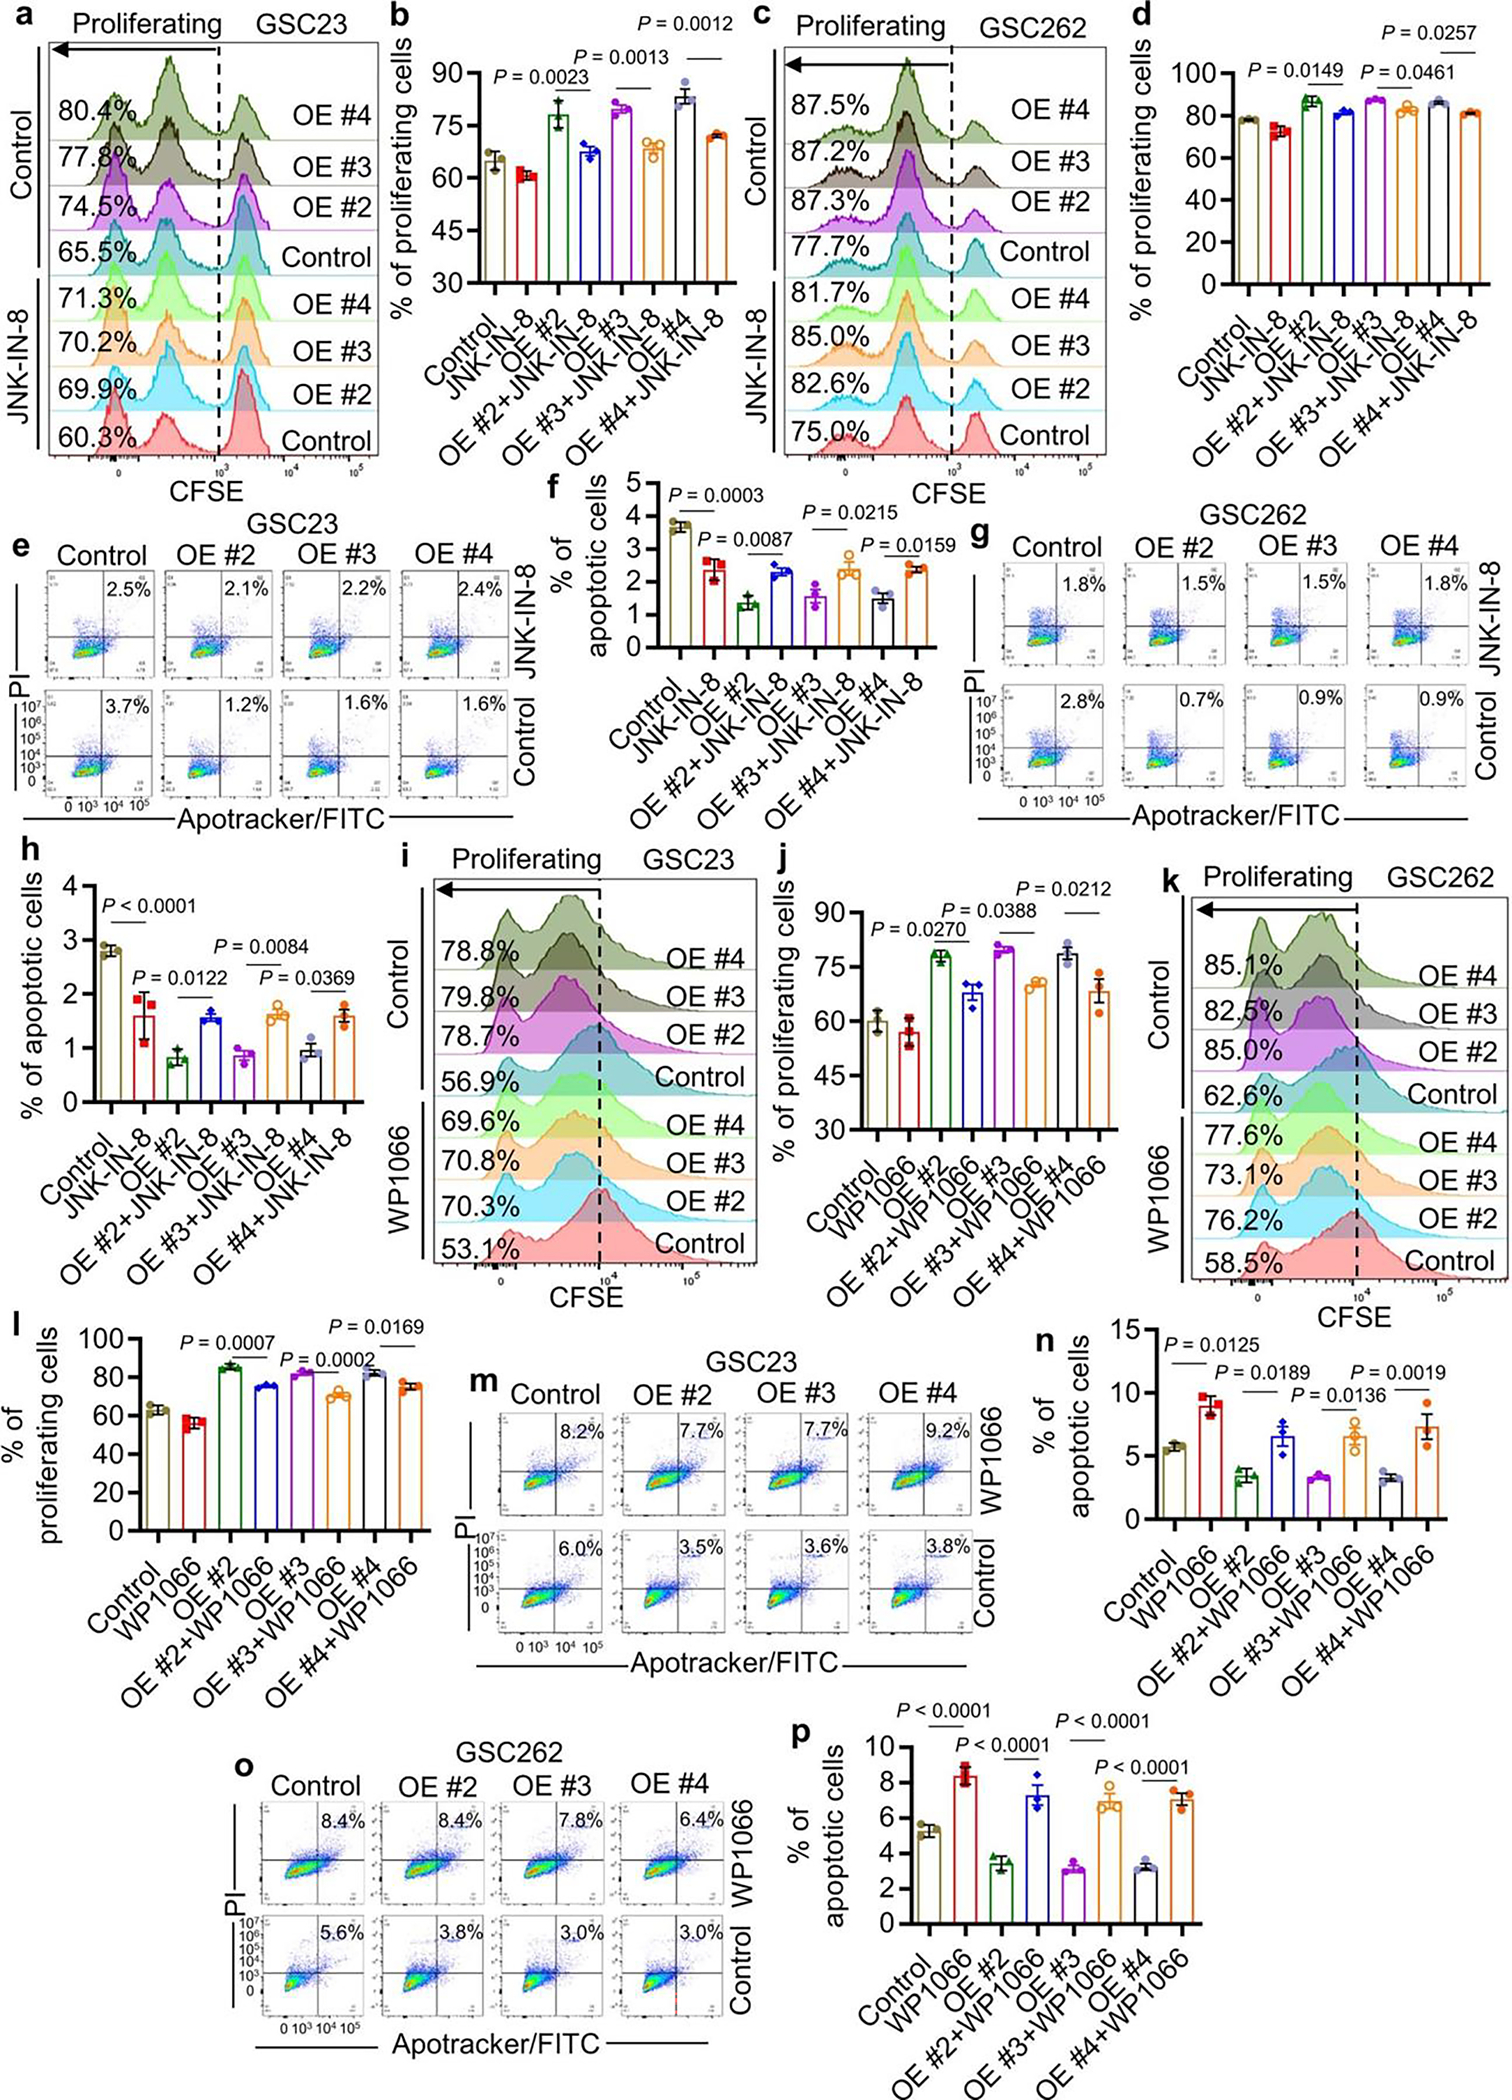
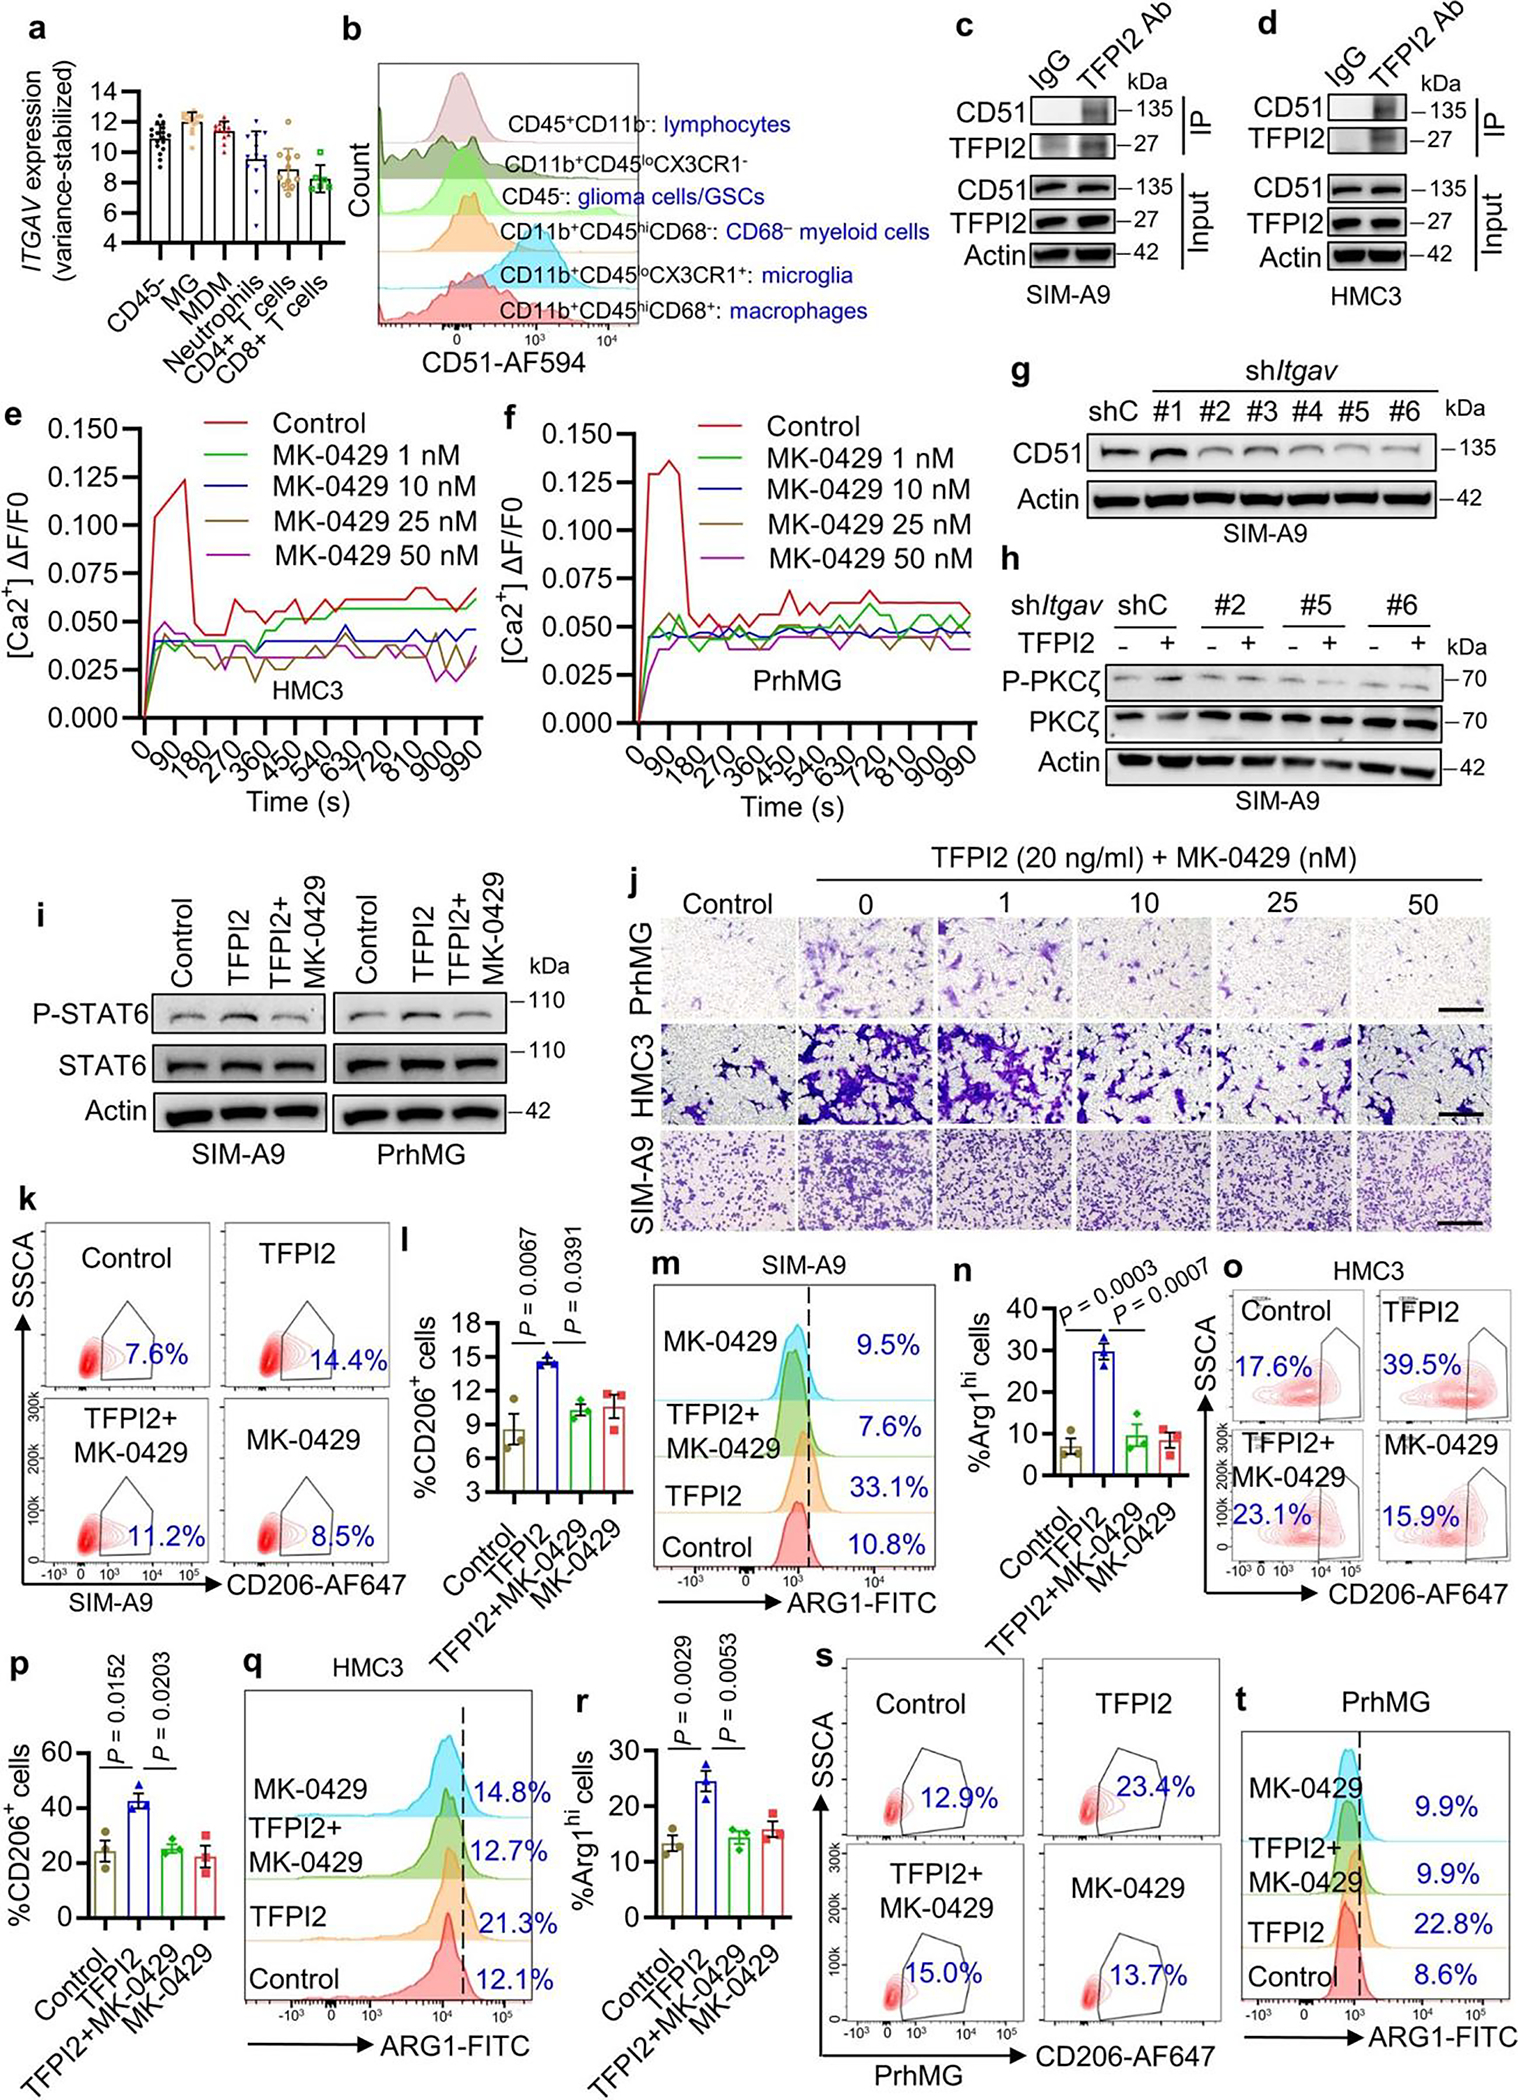
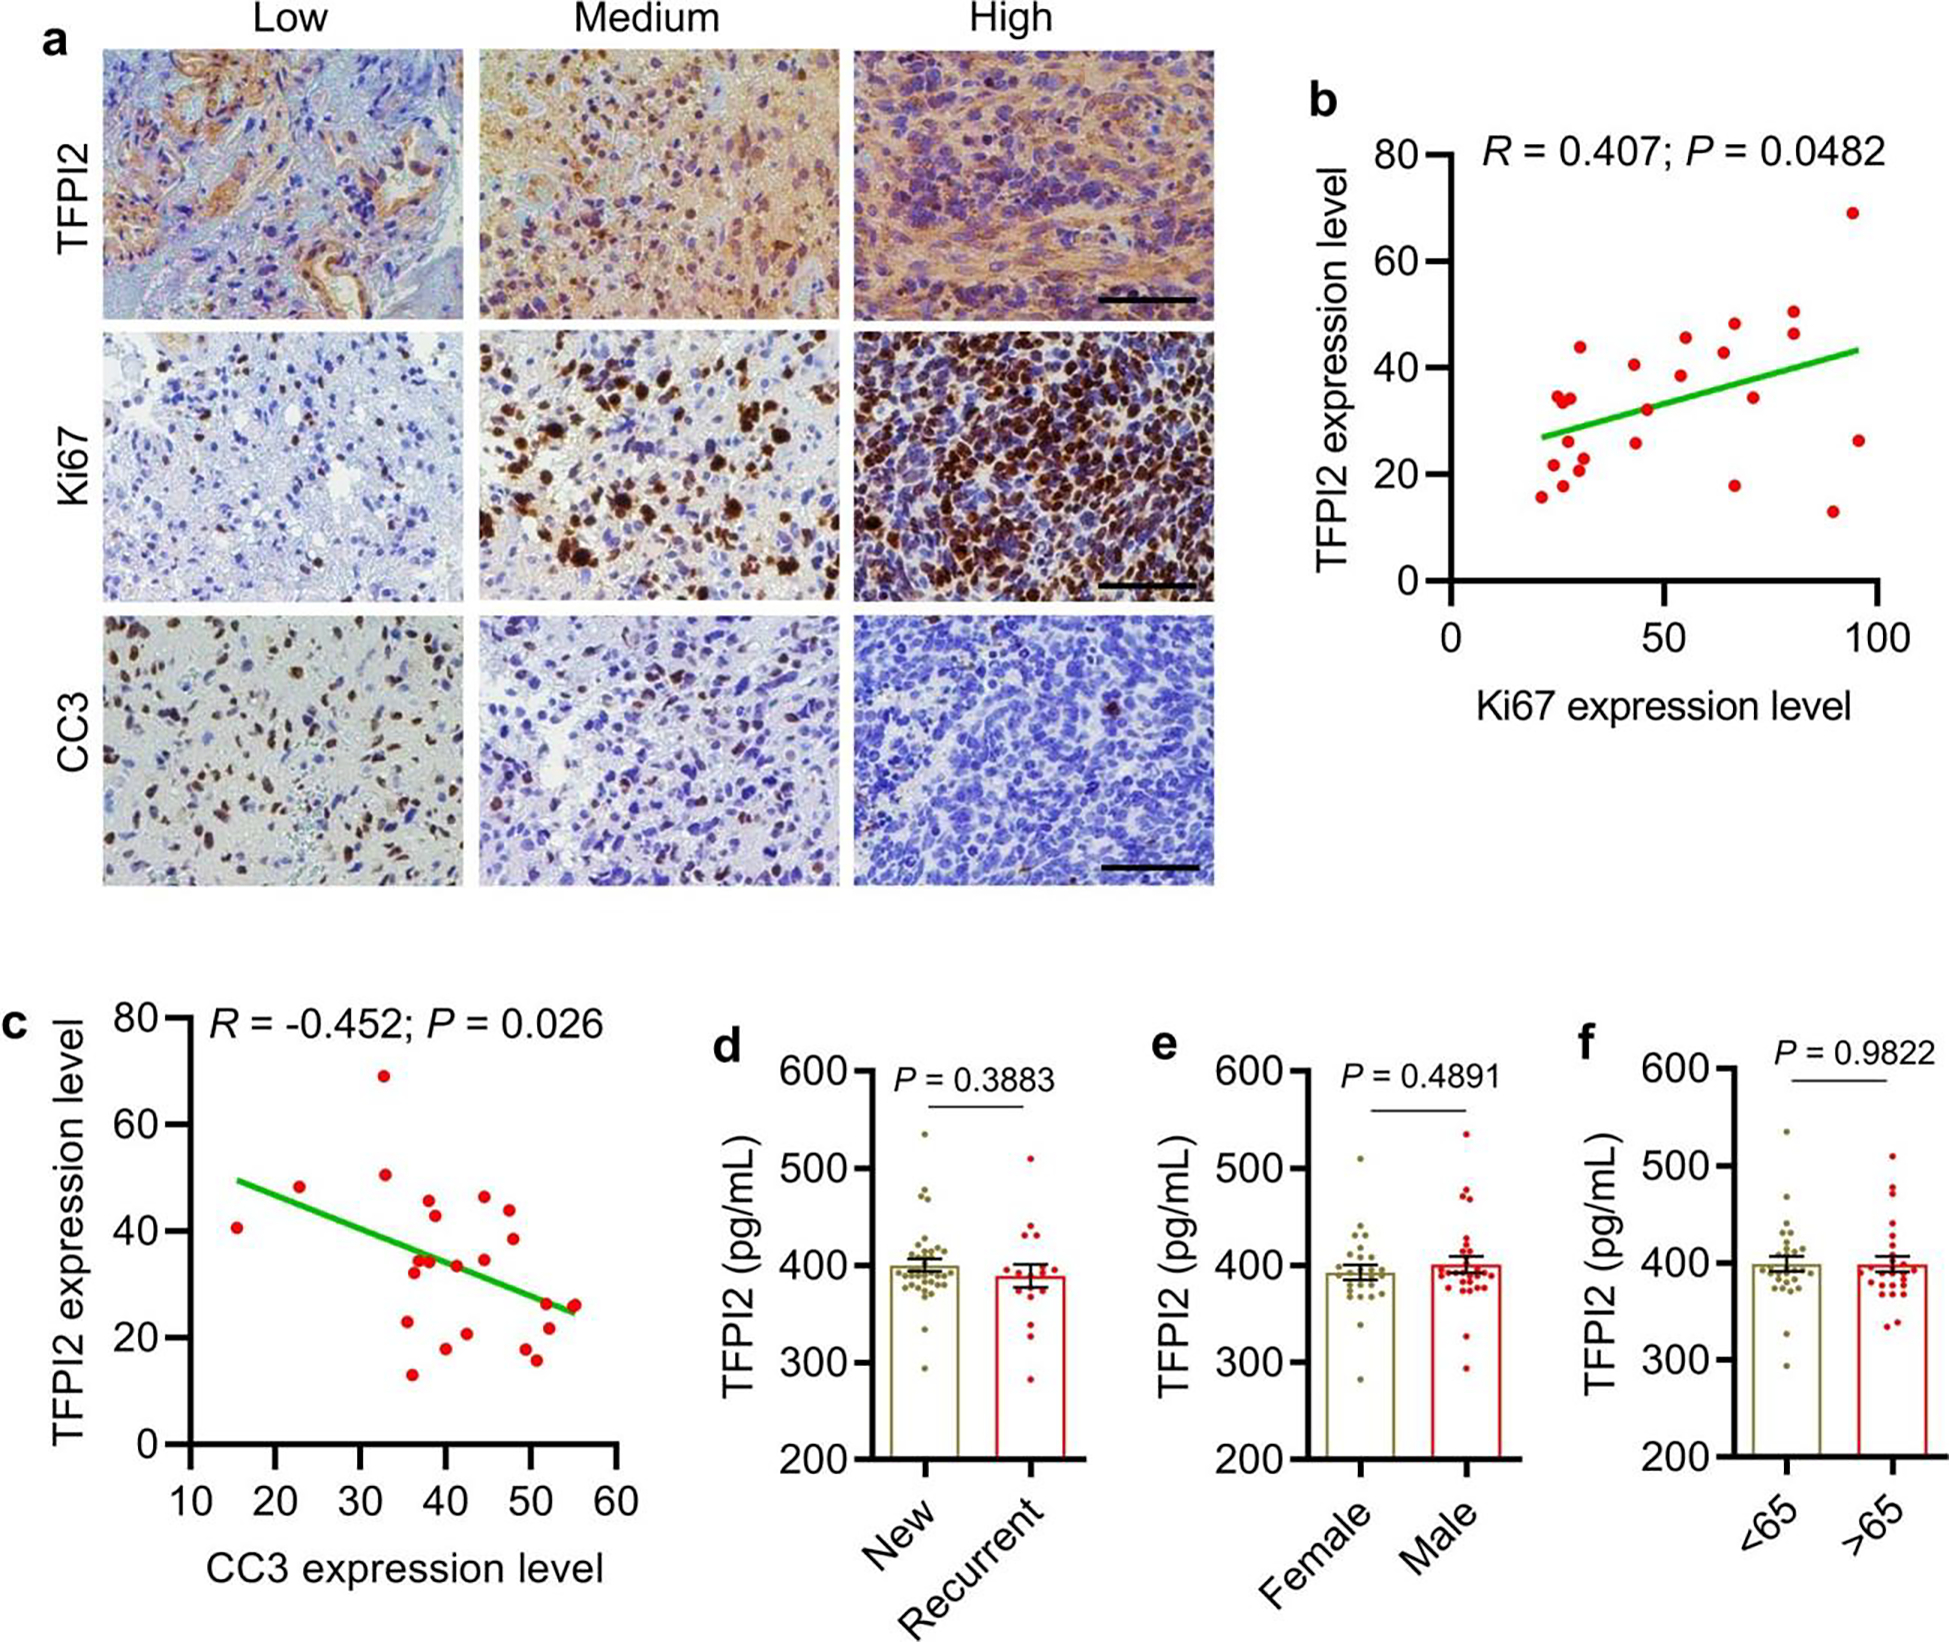
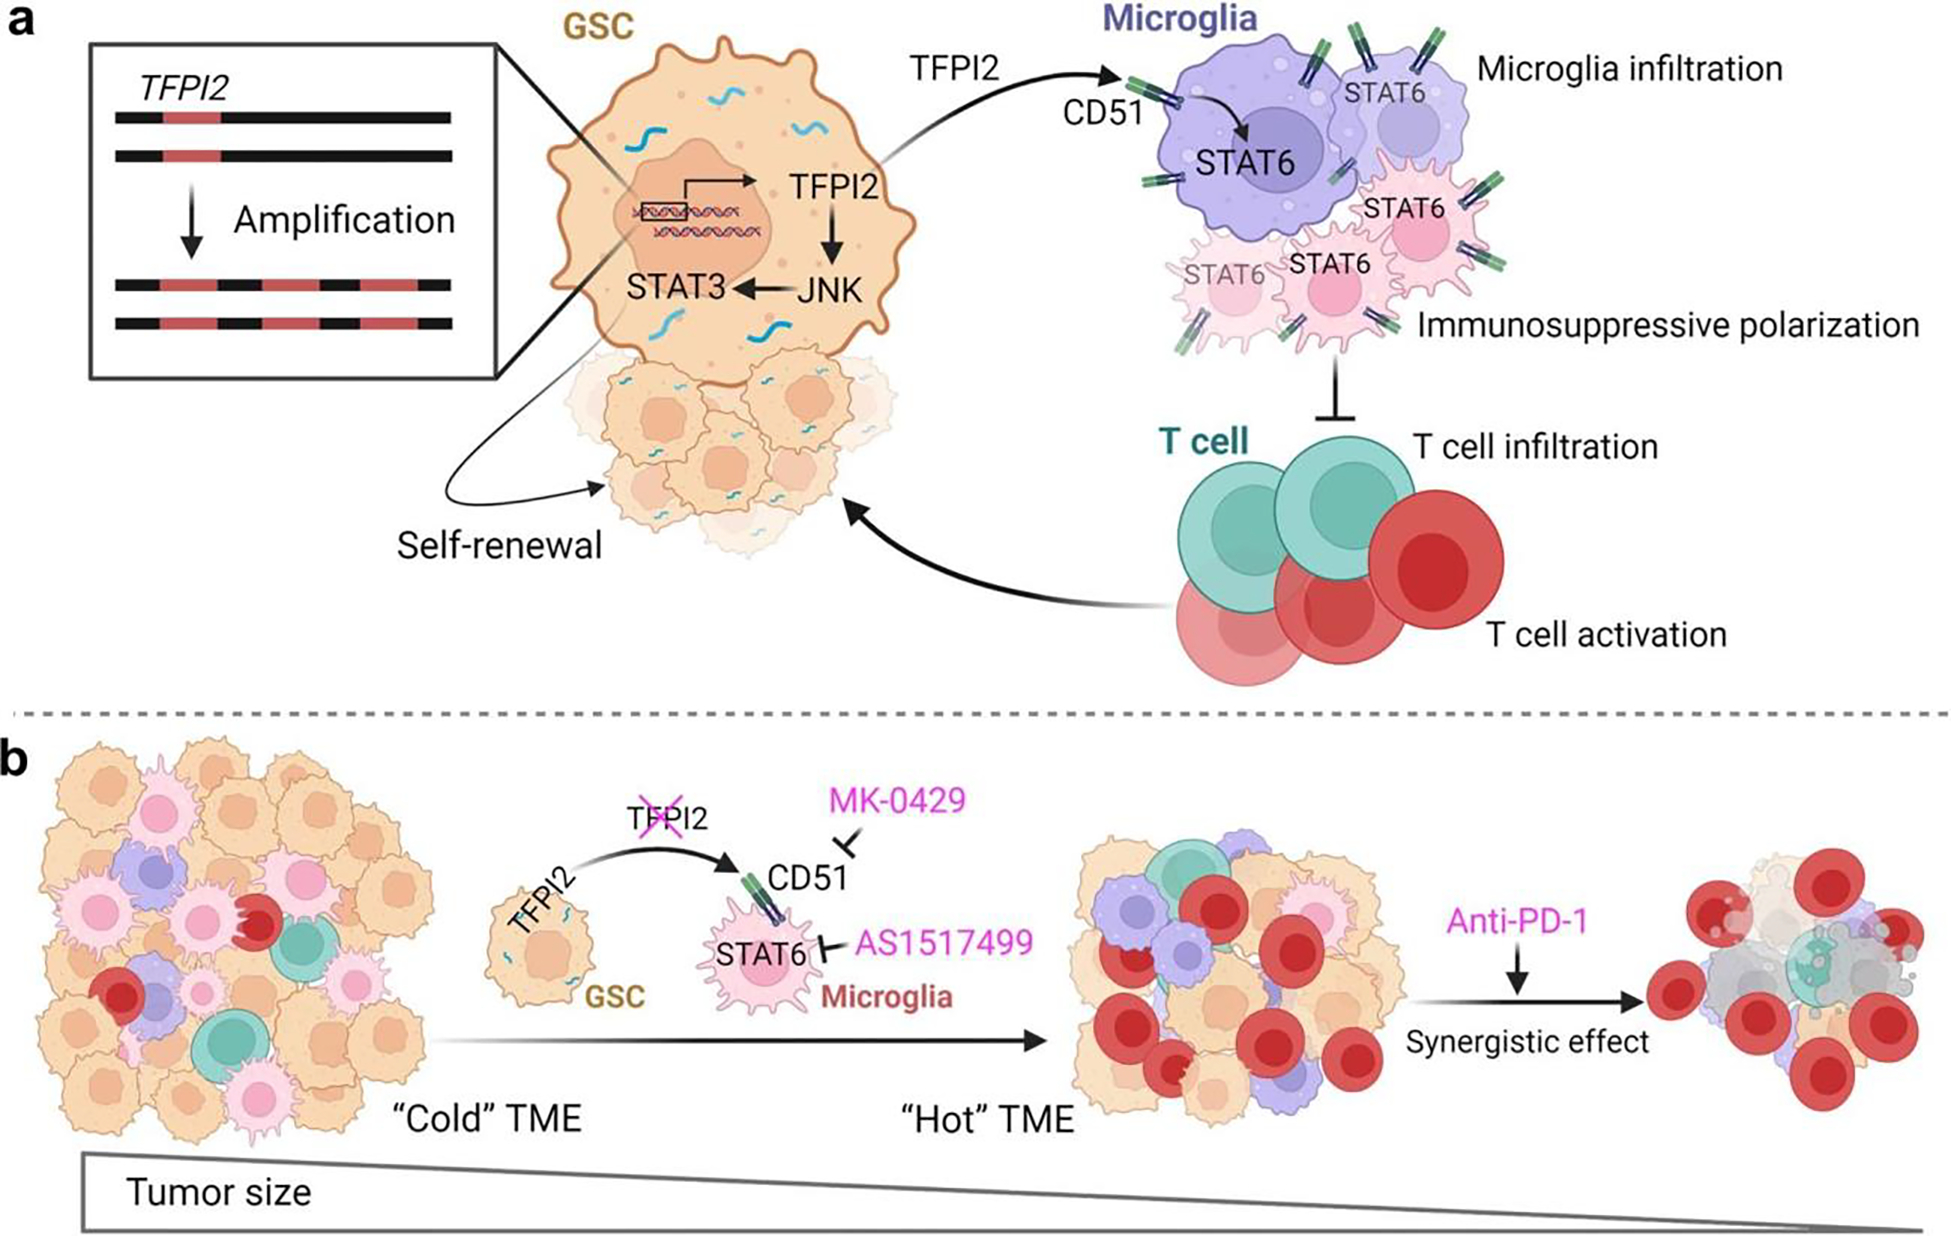
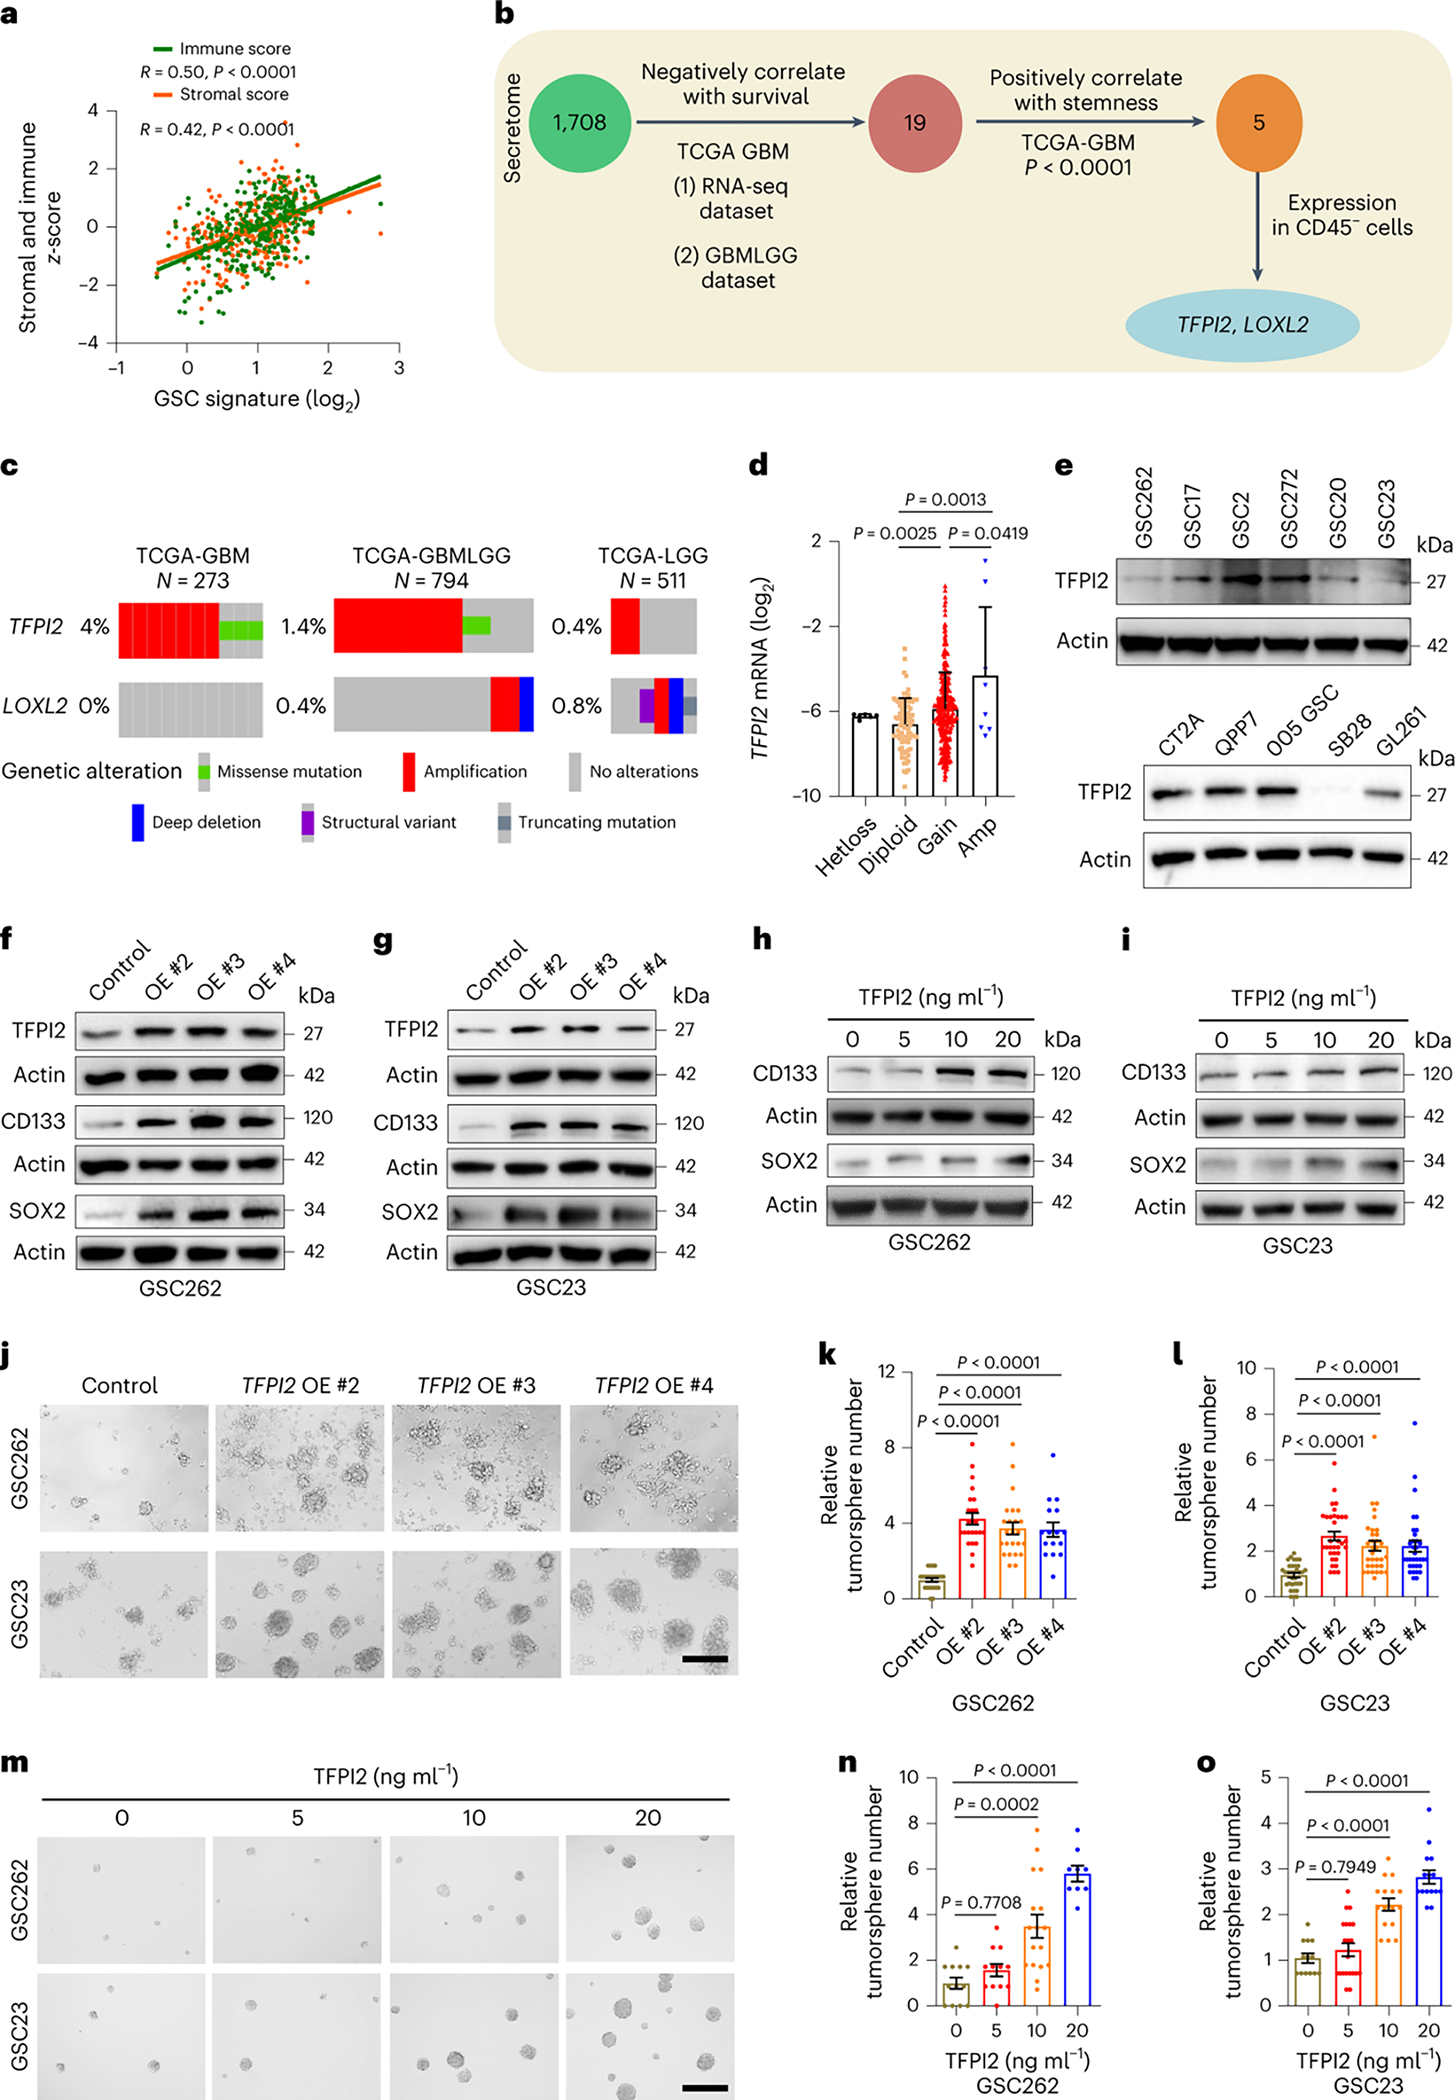
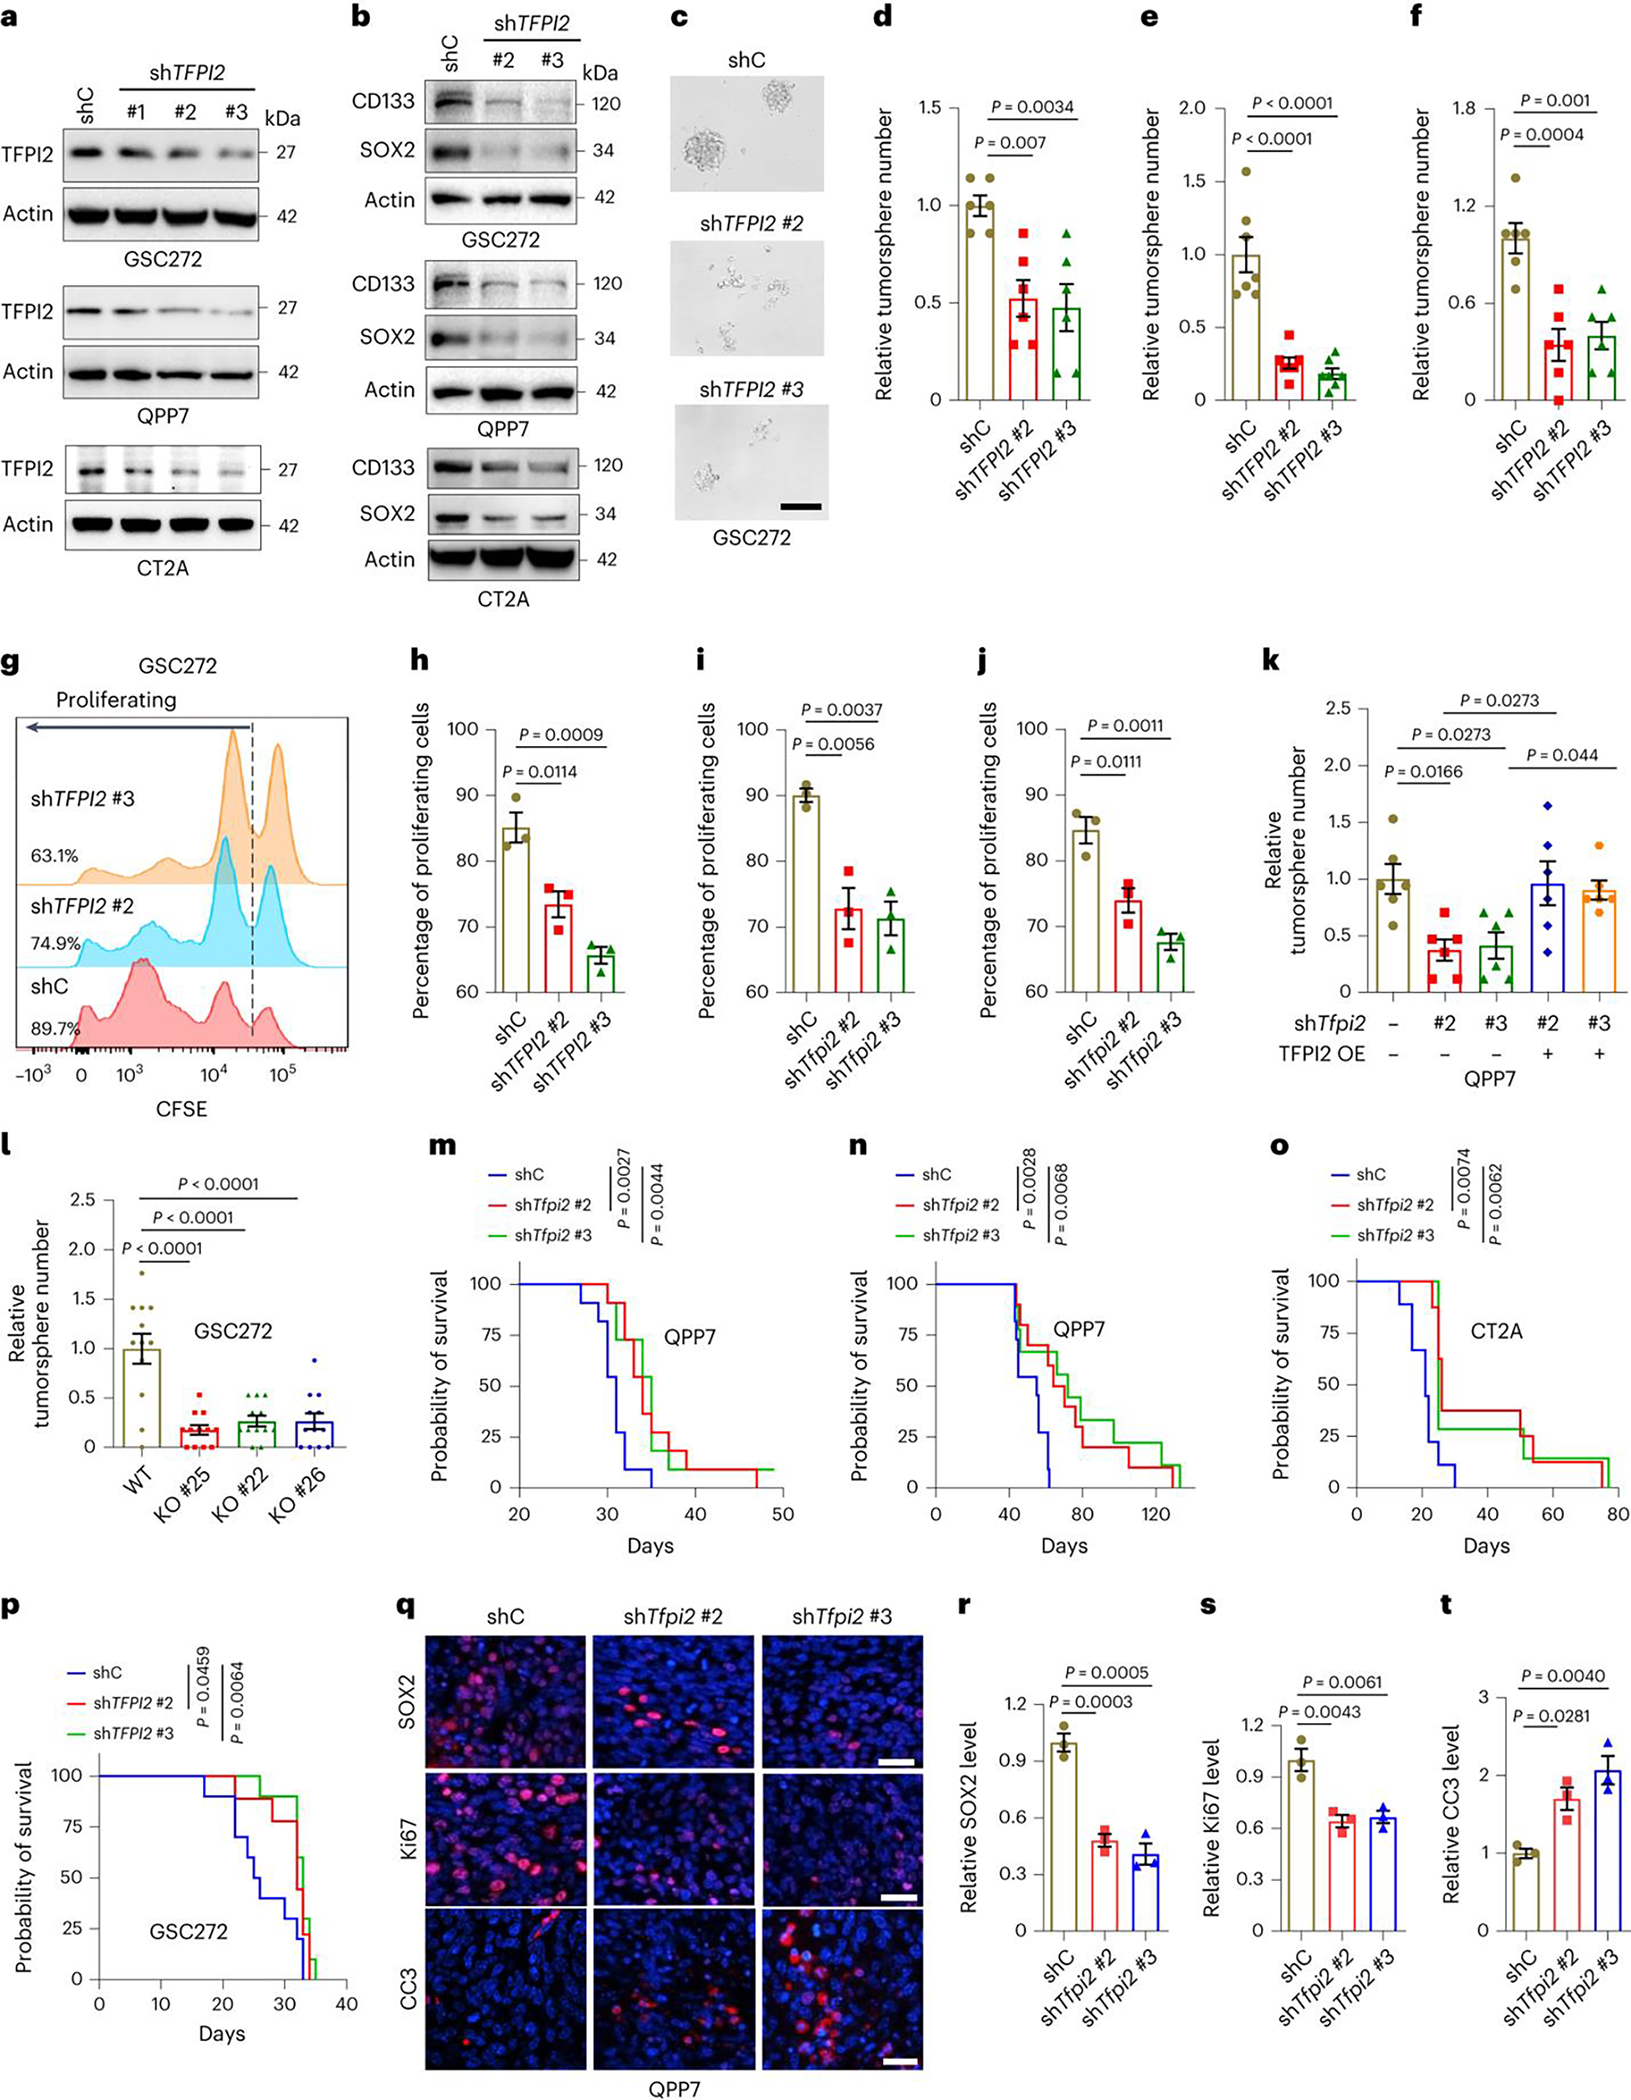
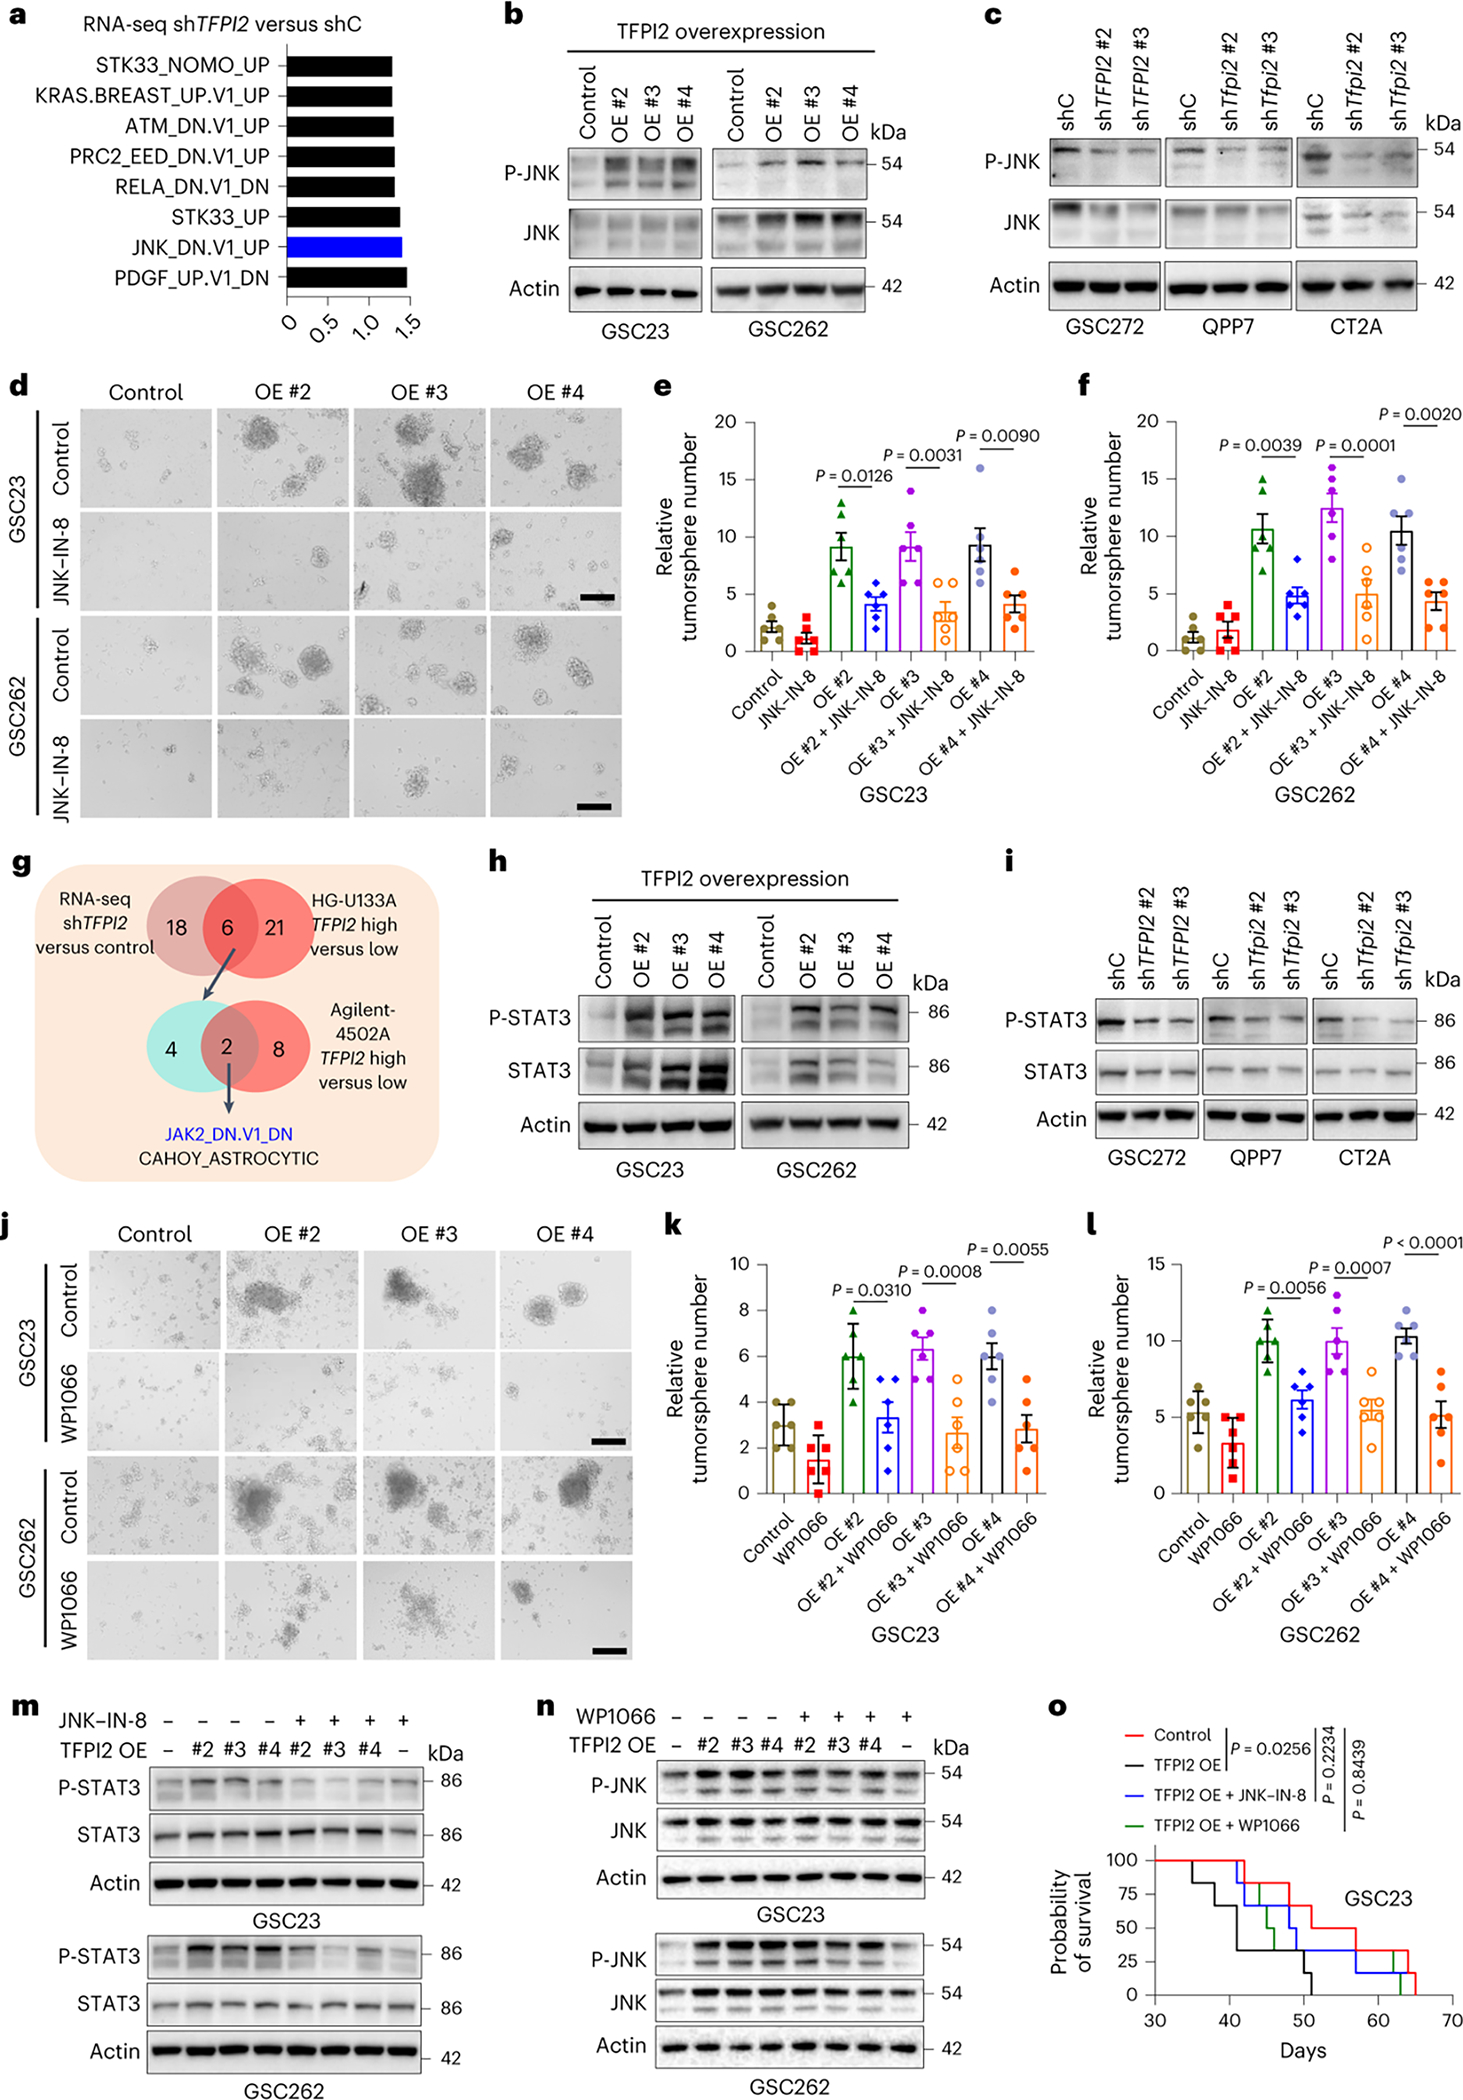
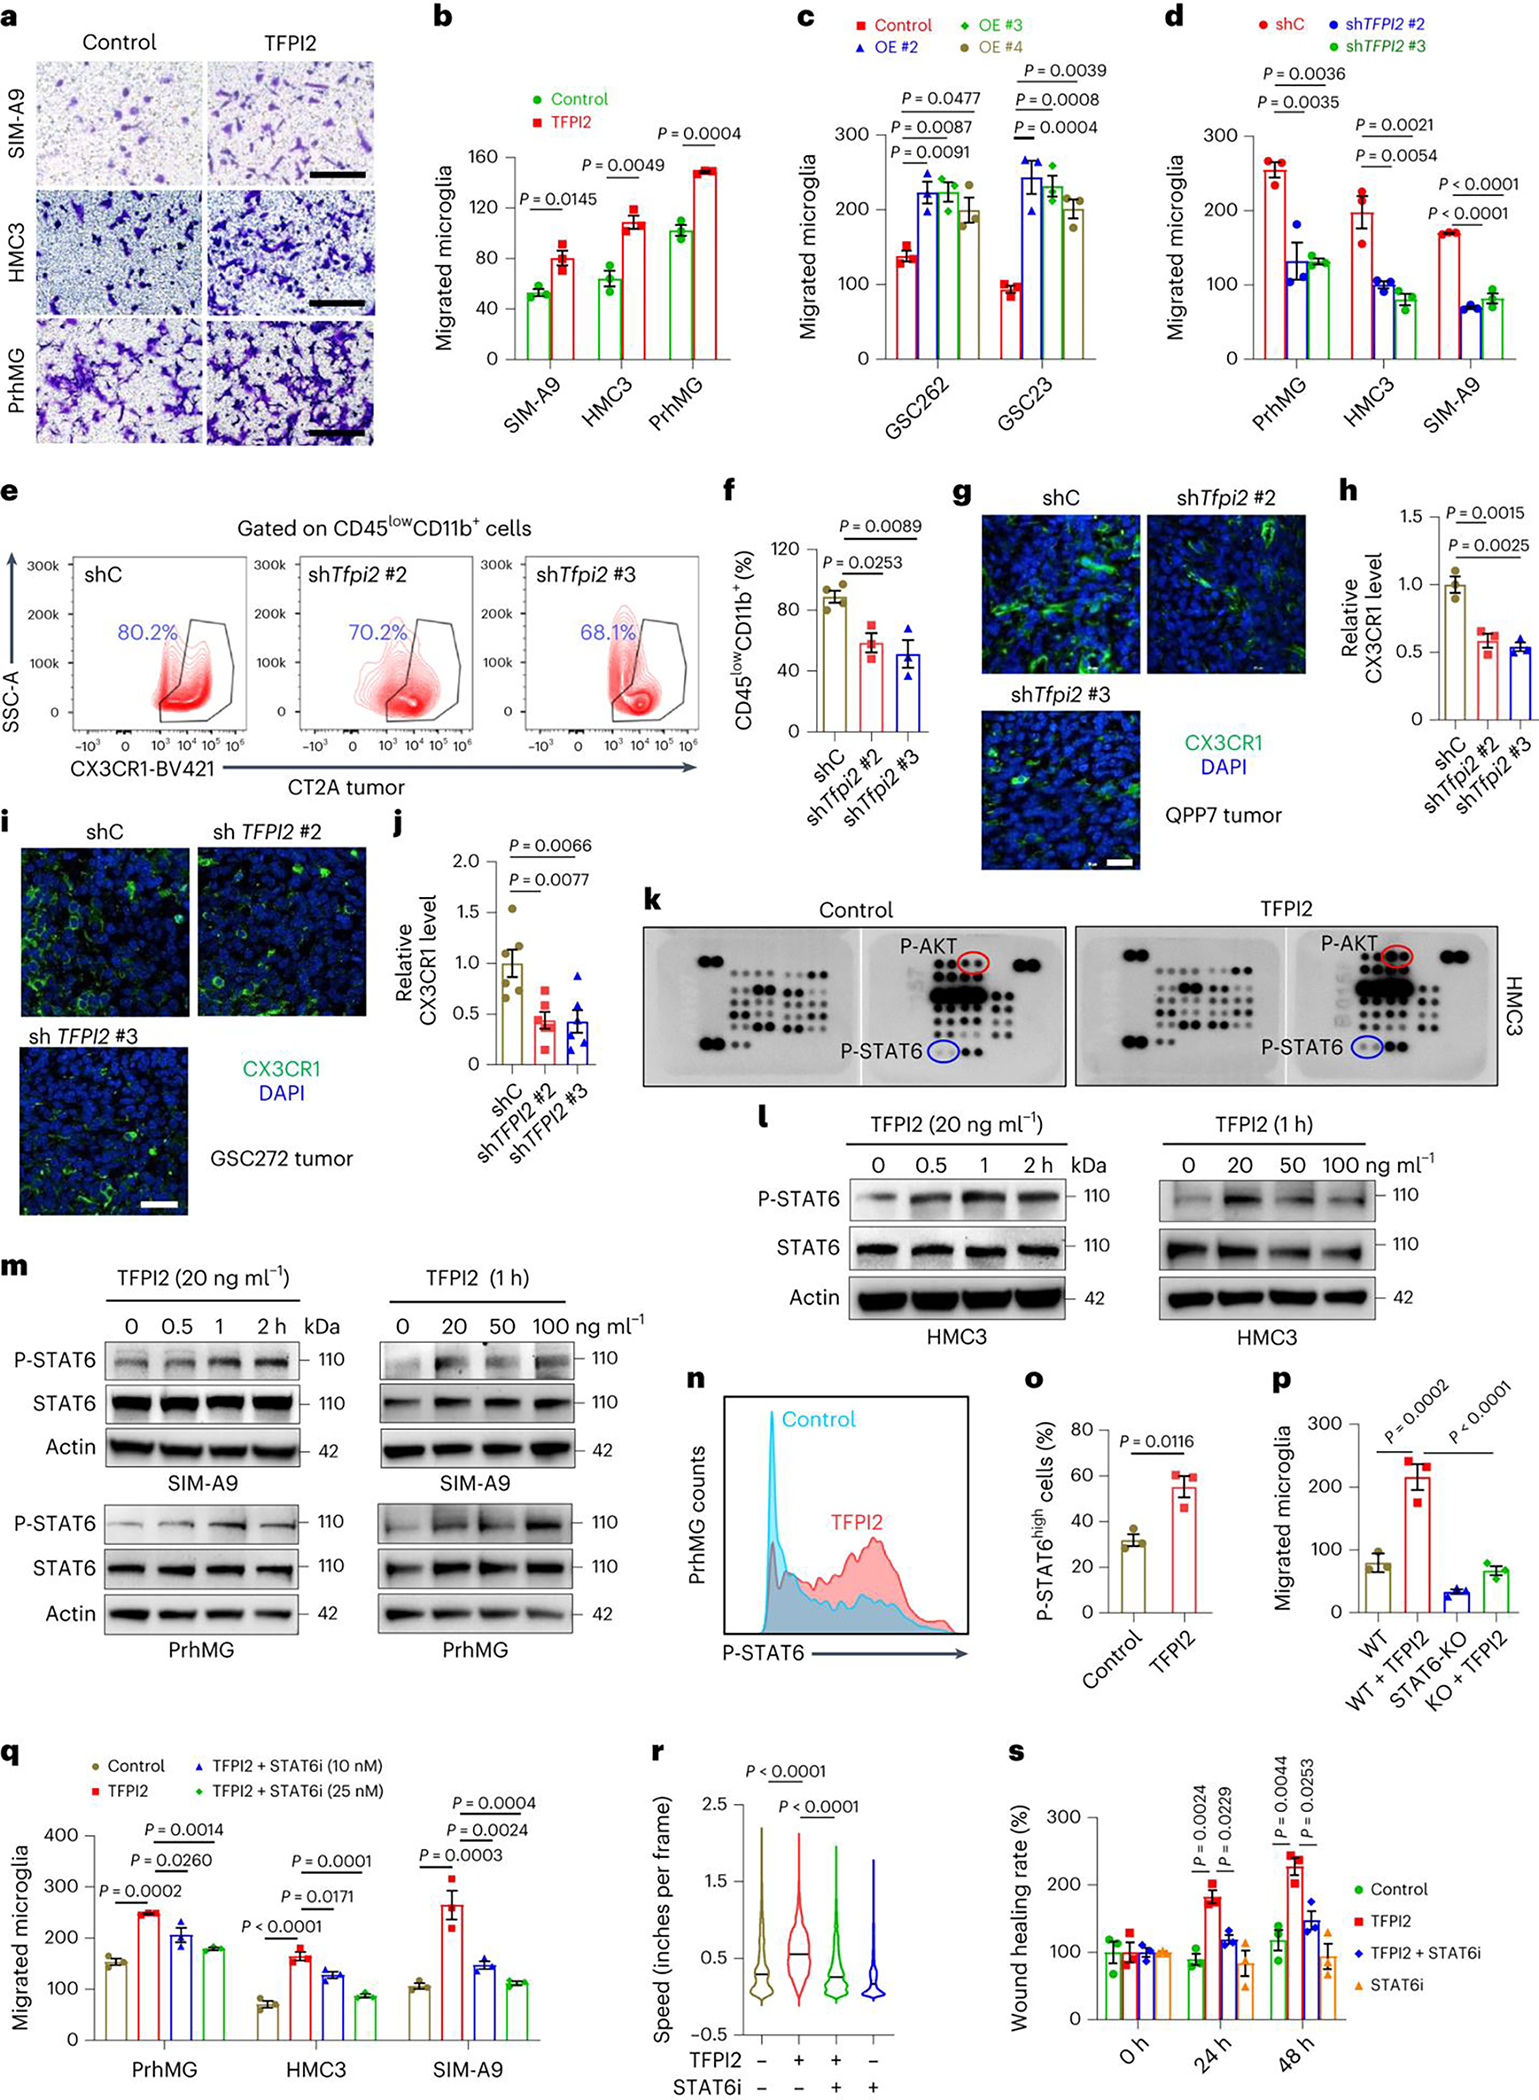
Glioblastoma (GBM) tumors consist of multiple cell populations, including self-renewing glioblastoma stem cells (GSCs) and immunosuppressive microglia. Here we identified Kunitz-type protease inhibitor TFPI2 as a critical factor connecting these cell populations and their associated GBM hallmarks of stemness and immunosuppression. TFPI2 promotes GSC self-renewal and tumor growth via activation of the c-Jun N-terminal kinase-signal transducer and activator of transcription (STAT)3 pathway. Secreted TFPI2 interacts with its functional receptor CD51 on microglia to trigger the infiltration and immunosuppressive polarization of microglia through activation of STAT6 signaling. Inhibition of the TFPI2-CD51-STAT6 signaling axis activates T cells and synergizes with anti-PD1 therapy in GBM mouse models. In human GBM, TFPI2 correlates positively with stemness, microglia abundance, immunosuppression and poor prognosis. Our study identifies a function for TFPI2 and supports therapeutic targeting of TFPI2 as an effective strategy for GBM.


Conflict of interest statement

Ethics declarations

Competing interests

L.P. and P.C. are listed as inventors on a patent related to targeting the TFPI2–CD51–STAT6 signaling axis combining with or without anti-PD1 therapy. All other authors declare no competing interests.

Figures

Extended Data Fig. 1
Extended Data Fig. 1. TFPI2 promotes GSC self-renewal.
a, Correlation between TFPI2 or LOXL2 expression and IDH1-WT GBM survival in TCGA datasets. P values are shown. b, c, Correlation between stemness (b) or GSC signature (c) and TFPI2 or LOXL2 expression in TCGA GBM dataset. R and P values were determined by Pearson correlation. d, e, Expression of TFPI2 (d) and LOXL2 (e) in CD45 cells and immune cells of non-tumor tissues and GBM tumors. n = 5 and 17 for CD45 cells, 8 and 15 for microglia (MG), 7 and 13 for macrophages (MDM), 6 and 13 for neutrophils, 6 and 11 for CD4+ T cells, as well as 7 and 6 for CD8+ T cells of non-tumor tissues and GBM, respectively. f, TFPI2 copy number correlates with TFPI2 in HG-U133A TCGA GBM tumors. n = 6, 88, 405 and 9 for Hetloss, Diploid, Gain and Amp, respectively. g, TFPI2 expression in glioma tumors at different stages. n = 256, 244, and 150 for stage II, III and IV, respectively. h, TFPI2 expression in different types of brain tumors. n = 191, 130, 194 and 152 for oligodendroglioma (OG), oligoastrocytoma (OA), astrocytoma and GBM, respectively. i, TFPI2 expression in different subtypes of GBM tumors. n = 182, 156 and 151 for classical, mesenchymal and proneural, respectively. j, k, High-resolution UMAP dimensional reduction of all cells (j) and malignant cells (k) from GBM patient tumors. l, m, UMAP dimensional reduction of the basis of the expression pattern of hallmark stemness signature (l) and TFPI2 (m) in malignant cells. n, Quantification of hallmark stemness signature in TFPI2-low and TFPI2-high tumors. o, Immunoblots for CD133 and SOX2 in cell lysates from GSC20 treated with TFPI2 protein at indicated concentrations. pr, Representative (p) and quantification (q,r) of flow cytometry analysis of apoptosis in GSC262 and GSC23. n = 3 biological replicates. Error bars indicate mean ± SD (f–i) or SEM (q, r). One-way ANOVA test (f–i, q, r) and two-tailed Student’s t-test (n).
Extended Data Fig. 2
Extended Data Fig. 2. TFPI2 regulates GSC self-renewal, proliferation, and apoptosis.
a, b, Representative of tumorspheres of QPP7 (a) and CT2A (b) cells expressing control shRNA (shC) and Tfpi2 shRNAs (shTfpi2). Scale bar, 200 μm. c, d, Representative of proliferation in shC and shTfpi2 QPP7 (c) and CT2A (d) cells. e–j, Representative and quantification of flow cytometry for apoptosis in GSC272 (e, f), QPP7 GSCs (g, h) and CT2A cells (i, j) expressing shC and shTFPI2. k, Immunoblots for cleaved caspase 3 (CC3) in cell lysates from GSC272, QPP7, and CT2A cells expressing shC and shTFPI2. l, Immunoblots for CD133 and SOX2 in cell lysates from QPP7 GSCs expressing shTfpi2 with or without reexpression of shRNA-resistant TFPI2 cDNA (OE). m, Representative of tumorspheres in QPP7 GSCs expressing shTfpi2 with or without TFPI2 OE. Scale bar, 400 μm. n, Immunoblots for TFPI2 in cell lysates from TFPI2 wild-type (WT) and different clones of CRISPR knockout (KO) GSC272. o, Immunoblots for CD133 and SOX2 in cell lysates from TFPI2-WT and TFPI2-GSC272. p, Representative of tumorspheres in TFPI2-WT and TFPI2-KO GSC272. Scale bar, 400 μm. q, r, Representative (q) and quantification (r) of immunofluorescence staining of SOX2 in size-matched tumors from C57BL/6 mice intracranially implanted with shC and shTfpi2 CT2A cells. Scale bar, 50 μm. s, t, Representative (s) and quantification (t) of immunochemistry staining of CD133 in tumors from C57BL/6 mice intracranially implanted with shC and shTfpi2 CT2A cells. Scale bar, 200 μm. u–x, Representative and quantification of immunofluorescence staining of Ki67 (u,v) and CC3 (w,x) in tumors from C57BL/6 mice intracranially implanted with shC and shTfpi2 CT2A cells. Scale bar, 50 μm. In (f, h, j, r, t, v, x), n = 3 biological replicates. Error bars indicate mean ± SEM. One-way ANOVA test.
Extended Data Fig. 3
Extended Data Fig. 3. TFPI2 regulates GSC proliferation and apoptosis via JNK and STAT3 pathways.
a, b, Representative (a) and quantification (b) of proliferation in GSC23 expressing control and TFPI2 overexpression (OE) plasmid treated with or without JNK inhibitor JNK-IN-8 (10 nM). n = 3 biological replicates. c, d, Representative (c) and quantification (d) of proliferation in GSC262 expressing control and TFPI2 OE plasmid treated with or without JNK-IN-8 (10 nM). n = 3 biological replicates. e, f, Representative (e) and quantification (f) of apoptosis in GSC23 expressing control and TFPI2 OE plasmid treated with or without JNK-IN-8 (10 nM). n = 3 biological replicates. g, h, Representative (g) and quantification (h) of apoptosis in GSC262 expressing control and TFPI2 OE plasmid treated with or without JNK-IN-8 (10 nM). n = 3 biological replicates. i, j, Representative (i) and quantification (j) of proliferation in GSC23 expressing control and TFPI2 OE plasmid treated with or without STAT3 inhibitor WP1066 (20 nM). n = 3 biological replicates. k, l, Representative (k) and quantification (l) of proliferation in GSC262 expressing control and TFPI2 OE plasmid treated with or without WP1066 (20 nM). n = 3 biological replicates. m, n, Representative (m) and quantification (n) of apoptosis in GSC23 expressing control and TFPI2 OE plasmid treated with or without WP1066 (20 nM). n = 3 biological replicates. o, p, Representative (o) and quantification (p) of apoptosis in GSC262 expressing control and TFPI2 OE plasmid treated with or without WP1066 (20 nM). n = 3 biological replicates. Error bars indicate mean ± SEM. One-way ANOVA test.
Extended Data Fig. 4
Extended Data Fig. 4. TFPI2 promotes microglia migration via activating STAT6 signaling.
a, Amplification pattern of TFPI2 and CLOCK in GBM and low-grade glioma (LGG) patient tumors. b, GSEA analysis shows the top 10 enriched hallmark pathways in TFPI2-high GBM patient tumors compared to TFPI2-low tumors. Blue highlighted pathways relate to immune response. c, Representative of transwell migration of PrhMG following stimulation with conditioned media (CM) from GSC262 or GSC23 expressing control and TFPI2 overexpression (OE) plasmid. Scale bar, 400 μm. d, Representative of transwell migration of PrhMG, HMC3 and SIM-A9 microglia following stimulation with CM from GSC272 (for PrhMG and HMC3) or QPP7 cells (for SIM-A9) expressing control shRNA (shC) and TFPI2 shRNAs (shTFPI2). Scale bars, 400 μm for PrhMG; 200 μm for HMC3 and SIM-A9. e, f, Representative (e) and quantification (f) of flow cytometry for the percentage of CD45lowCD11b+ and CD45highCD11b+ cells in size matched tumors from C57BL/6 mice intracranially implanted with shC and shTfpi2 CT2A cells. n = 4 and 3 biological replicates for shC and shTfpi2, respectively. g, h, Representative (g) and quantification (h) of flow cytometry for the percentage of CD45highCD11b+CD68+ macrophages in size matched tumors from C57BL/6 mice intracranially implanted with shC and shTfpi2 CT2A cells. n = 4 and 3 biological replicates for shC and shTfpi2, respectively. i, Correlation between microglia signature and STAT6, AKT1, AKT2 or AKT3 in TCGA GBM dataset. R and P values were determined by Pearson correlation. j, Representative of transwell migration of mouse primary microglia isolated from wild-type (WT) and STAT6 knockout (KO) mice treated with or without TFPI2 recombinant protein (20 ng/ml). Scale bar, 200 μm. k, Representative of transwell migration of PrhMG, HMC3 and SIM-A9 microglia following stimulation with TFPI2 protein (20 ng/ml) in the presence or absence of STAT6 inhibitor AS1517499 at indicated concentrations. Scale bars, 400 μm for PrhMG; 200 μm for HMC3 and SIM-A9. Error bars indicate mean ± SEM. One-way ANOVA test.
Extended Data Fig. 5
Extended Data Fig. 5. TFPI2-STAT6 axis regulates microglia polarization.
a, Representative of flow cytometry for CD206 in PrhMG treated with conditioned media (CM) from GSC23 expressing control and TFPI2 overexpression (OE) plasmid. b, Representative of flow cytometry for CD206 in HMC3 microglia treated with CM from GSC272 expressing shRNA control (shC) and TFPI2 shRNAs (shTFPI2). c, Representative of flow cytometry for CD206 in SIM-A9 microglia treated with CM from QPP7 GSCs expressing shC and shTfpi2 with or without reexpression of shRNA-resistant TFPI2 cDNA (OE). d, e, Representative (d) and quantification (e) of flow cytometry for the percentage of CD45hiCD11b+CD68+CD206+ macrophages in size matched tumors from C57BL/6 mice intracranially implanted with shC and shTfpi2 CT2A cells. n = 4 and 3 for shC and shTfpi2, respectively. f–i, Immunofluorescence and quantification of CX3CR1+CD206+ (f,g) and CX3CR1+CD163+ (h,i) cells in tumors from C57BL/6 mice intracranially implanted with shC and shTfpi2 CT2A cells. Scale bar, 25 μm. n = 3 (g) or 6 (i) biological replicates. j–m, Immunofluorescence and quantification of CX3CR1+CD206+ (j,k) and CX3CR1+CD163+ (l,m) cells in tumors from nude mice intracranially implanted with shC and shTFPI2 GSC272. Scale bar, 25 μm. n = 6 biological replicates. n, Representative of CD206 positive microglia isolated from wild-type (WT) and STAT6 knockout (KO) mice and treated with or without TFPI2 recombinant protein (20 ng/ml). o, p, Representative of flow cytometry for CD206 (o) and ARG1 (p) in SIM-A9 microglia treated with or without TFPI2 protein (20 ng/ml) and STAT6 inhibitor (STAT6i) AS1517499 (25 nM). q, r, Representative of flow cytometry for CD206 (q) and ARG1 (r) in HMC3 microglia treated with or without TFPI2 protein (20 ng/ml) and AS1517499 (25 nM). s, Relative mRNA expression of IL6, TNFA, LFNG, and HLA-DR in HMC3 microglia treated with or without TFPI2 protein (20 ng/ml) and AS1517499 (25 nM). n = 3 biological replicates. Error bars indicate mean ± SEM. A one-way ANOVA followed by a Tukey test was performed to compare more than two groups.
Extended Data Fig. 6
Extended Data Fig. 6. CD51 is a receptor for TFPI2 activities on microglia.
a, CD51 expression level in human GBM samples from the TIME dataset. n = 17, 15, 13, 13, 11, and 6 for CD45 cells, microglia (MG), macrophages (MDM), neutrophils, CD4+ T cells and CD8+ T cells, respectively. b, CD51 expression in different cell populations in mouse CT2A tumor tissues. c, d, Immunoprecipitation with TFPI2 antibody (TFPI2 Ab) and immunoblotting for the interaction between TFPI2 and CD51 in SIM-A9 (c) and HMC3 (d) microglia. e, f, Calcium mobilization triggered by TFPI2 protein in HMC3 microglia (e) and PrhMG (f) treated with or without CD51 inhibitor MK-0429 at indicated concentrations. g, Immunoblots for CD51 in cell lysates of SIM-A9 microglia expressing shRNA control (shC) and Itgav shRNAs (shItgav). h, Immunoblots for P-PKCζ and PKCζ in cell lysates of shC and shItgav SIM-A9 microglia treated with or without TFPI2 protein. i, Immunoblots for P-STAT6 and STAT6 in cell lysates from SIM-A9 microglia and PrhMG treated with TFPI2 protein and MK-0429. j, Representative of transwell migration of PrhMG human HMC3, and mouse SIM-A9 microglia treated with or without TFPI2 protein and MK-0429 at indicated concentrations. Scale bars, 200 μm for HMC3 and SIM-A9, and 400 μm for PrhMG. k–n, Representative and quantification of flow cytometry for the percentage of CD206+ (k,l) and ARG1+ (m,n) SIM-A9 microglia treated with or without TFPI2 protein and MK-0429. n = 3 biological replicates. o–r, Representative (o) and quantification (p) of flow cytometry for the percentage of CD206+ (o,p) and ARG1+ (q,r) HMC3 microglia treated with or without TFPI2 recombinant protein and MK-0429 (50 nM). n = 3 biological replicates. s, t, Representative of flow cytometry for the percentage of CD206+ (s) and ARG1+ (t) PrhMG treated with or without TFPI2 protein and MK-0429. TFPI2 protein at 20 ng/ml and MK-0429 at 50 nM were used unless indicated. Error bars indicate mean ± SEM. One-way ANOVA test.
Extended Data Fig. 7
Extended Data Fig. 7. TFPI2-STAT6 signaling mediates microglia-induced T cell suppression.
a, b, Survival curves of nude mice implanted with QPP7 cells (2×10⁴ cells; a) or CT2A cells (2×10⁴ cells; b) expressing control shRNA (shC) and Tfpi2 shRNAs (shTfpi2). n = 8 biological replicates. c, d, Immunofluorescence (c) and quantification (d) of CD8 in size matched tumors from C57BL/6 mice intracranially implanted with shC and shTfpi2 CT2A cells expressing. Scale bar, 50 μm. n = 3 biological replicates. e, f, Immunofluorescence (e) and quantification (f) of CD4 in size matched tumors from C57BL/6 mice intracranially implanted with shC and shTfpi2 QPP7 GSCs. Scale bar, 50 μm. n = 3 biological replicates. g, Representative of flow cytometry analysis for CD45+CD3+CD8+PD1high and CD45+CD3+CD4+PD1high T cells in the spleens of C57BL/6 mice bearing size matched shC and shTfpi2 CT2A tumors. h, Representative of flow cytometry for IFNγ+CD8+ T cells cocultured with SIM-A9 mouse microglia treated with or without TFPI2 recombinant protein (20 ng/ml) and STAT6 inhibitor (STAT6i) AS1517499 (25 nM). i, Representative of flow cytometry for fixable viability dye-labeled JURKAT T cells cocultured with PrhMG treated with or without TFPI2 protein (20 ng/ml) and AS1517499 (25 nM). Percentage of live cells and dead cells are indicated. j, k, Representative (j) and quantification (k) of flow cytometry for the percentage of HLA-DR+ cells out of total JURKAT T cells cocultured with PrhMG treated with TFPI2 protein (20 ng/ml) in the presence or absence of AS1517499 (25 nM). n = 3 biological replicates. l, Representative of flow cytometry for CD69+ JURKAT T cells cocultured with PrhMG treated with or without TFPI2 protein (20 ng/ml) and AS1517499 (25 nM). m, Representative of flow cytometry analysis for IFNγ+ JURKAT T cells cocultured with PrhMG treated with TFPI2 protein (20 ng/ml) in the presence or absence of AS1517499 (25 nM). Error bars indicate mean ± SEM. One-way ANOVA test. In (a,b), log-rank test.
Extended Data Fig. 8
Extended Data Fig. 8. TFPI2-CD51-STAT6 signaling mediates microglia-induced T cell suppression.
cer cell cytotoxicity induced by activated mouse primary CD8+ T cells cocultured with SIM-A9 microglia treated with TFPI2 recombinant protein (20 ng/ml) in the presence or absence of STAT6 inhibitor (STAT6i) AS1517499 (25 nM). The ratios between CD8+ T cells and CT2A cells are indicated. n = 10 biological replicates. c, GSC272 cytotoxicity induced by activated JURKAT T cells cocultured with PrhMG treated with TFPI2 protein (20 ng/ml) in the presence or absence of AS1517499 (25 nM). The ratios between CD8+ T cells and CT2A cells are indicated. n = 10 biological replicates. d, Correlation between CD274 (PD-L1) and TFPI2, STAT6, or ITGAV (CD51) in TCGA GBM dataset. e, Correlation between PDCD1LG2 (PD-L2) and TFPI2, STAT6, or ITGAV (CD51) in TCGA GBM dataset. In (d, e), R and P values were determined by Pearson correlation. Error bars indicate mean ± SEM. One-way ANOVA test.
Extended Data Fig. 9
Extended Data Fig. 9. TFPI2 correlates with proliferation and apoptosis markers in GBM patient tumors.
a, Representative images show low, medium, and high expression of TFPI2, Ki67, and cleaved caspase 3 (CC3) in human GBM tumor samples based on immunohistochemistry staining. Scale bar, 100 μm. b,c, Quantification of immunohistochemistry staining showing strong positive correlation between TFPI2 and Ki67 (b) and negative correlation between TFPI2 and CC3 (c) in human GBM tumor samples (n = 24). R and P values were determined by Pearson correlation. d-f, The plasma TFPI2 level in newly diagnosed (n = 38) and recurrent (n = 17) (d), female (n = 26) and male (n = 29) (e), as well as old (>65) (n = 29) and young (<65) (n = 26) GBM patients (f). Error bars indicate mean ± SEM. Student’s t-test.
Extended Data Fig. 10
Extended Data Fig. 10. Working model.
a, Illustration shows a proposed mechanism for the TFPI2 and its associated signaling axis in regulating self-renewal of glioma stem cells (GSCs) and GSC-microglia symbiosis in GBM. TFPI2 is amplified in GBM and essential for tumor progression. Upon secreting from GSCs, TFPI2 promotes GSC self-renewal by activating the JNK-STAT3 signaling pathway. Secreted TFPI2 binds to CD51 on microglia to promote microglia infiltration and immunosuppressive polarization via activation of STAT6 signaling. Consequently, these activated microglia inhibit the infiltration and activation of T cells and damage their tumor killing potential. b, Inhibition of TFPI2-CD51-STAT6 signaling axis impairs tumor progression by reducing immunosuppressive microglia and activating T cell-mediated antitumor immunity and synergizes with anti-PD1 therapy in GBM. This image was created with BioRender.com.
Fig. 1:
Fig. 1:. TFPI2 overexpression promotes GSC self-renewal.
a, The correlation between GSC signature and immune/stromal scores in TCGA GBM dataset (n = 300). R and P values were determined by Pearson correlation. b, Strategy for identification of TFPI2 and LOXL2 that encode secreted proteins, correlate negatively with patient survival and positively with the stemness signature in TCGA GBM patient tumors, and are highly expressed in CD45 cells of GBM tumors. c, Amplification of TFPI2 and LOXL2 in GBM and LGG patient tumors. d, TFPI2 gene copy number correlates with TFPI2 mRNA level in TCGA GBM patient tumors under the Agilent-4502A platform. n = 6, 83, 372 and 8 biological replicates for Hetloss, Diploid, Gain and Amp, respectively. e, Immunoblot for TFPI2 in cell lysates of GBM patient-derived GSCs (top) and mouse-derived GSCs and GBM cells (bottom). Based on the expression levels, GSC272, GSC2, QPP7 GSC, CT2A and 005 GSC are considered as TFPI2-high cells. f,g, Immunoblots for TFPI2, CD133 and SOX2 in cell lysates of GSC262 (f) and GSC23 (g) cells with or without TFPI2 overexpression (OE). h,i, Immunoblots for CD133 and SOX2 in cell lysates of GSC262 (h) and GSC23 (i) cells treated with or without TFPI2 recombinant protein at indicated concentrations for 24 h. j, Representative of tumorspheres of GSC262 and GSC23 cells expressing control and TFPI2 OE plasmids. Scale bar, 400 μm. k,l, Quantification of tumorspheres of GSC262 (k) and GSC23 (l) cells expressing control and TFPI2 OE plasmids. In k, n = 24 and 16 biological replicates for control, OE #2 and OE #3 groups and OE #4 group, respectively. In l, n = 33 biological replicates. m, Representative of tumorspheres of GSC262 and GSC23 cells treated with TFPI2 recombinant protein at indicated concentrations. Scale bar, 400 μm. n,o, Quantification of tumorspheres of GSC262 (n) and GSC23 (o) cells treated with TFPI2 recombinant protein. In n, n = 12, 17 and 9 biological replicates for TFPI2 at 0 and 5, 10 and 20 ng ml−1, respectively. In o, n = 13, 21, 16 and 15 biological replicates for TFPI2 at 0, 5, 10 and 20 ng ml−1, respectively. Error bars indicate mean ± s.d. or s.e.m. One-way ANOVA test.
Fig. 2:
Fig. 2:. TFPI2 depletion impairs stemness and extends survival of GSC-bearing mice.
a,b, Immunoblots for TFPI2 (a), CD133 and SOX2 (b) in cell lysates from human GSC272, and mouse QPP7 GSCs and CT2A cells expressing shRNA control (shC) and TFPI2 shRNAs (shTFPI2). c,d, Representative (c) and quantification (d) of tumorspheres in GSC272 cells expressing shC and shTFPI2. n = 6 biological replicates. Scale bar, 200 μm. e,f, Quantification of tumorspheres in QPP7 GSCs (e, n = 6) and CT2A cells (f, n = 7) expressing shC and shTfpi2. g,h, Representative (g) and quantification (h) of proliferation in GSC272 cells expressing shC and shTFPI2. The percentage of proliferating cells for each group is indicated. n = 3 biological replicates. i,j, Quantification of proliferation in QPP7 GSCs (i) and CT2A cells (j) expressing shC and shTfpi2. n = 3 biological replicates. k, Quantification of tumorspheres in QPP7 GSCs expressing shTfpi2 with or without reexpression of shRNA-resistant TFPI2 cDNA. n = 6 biological replicates. l, Quantification of tumorspheres in TFPI2 WT and CRISPR KO GSC272 cells. n = 12 biological replicates. m,n, Survival curves of C57BL/6 mice implanted with 2 × 10⁵ (m) or 2 × 10⁴ (n) QPP7 GSCs expressing shC and shTfpi2. n = 11 biological replicates. o, Survival curves of C57BL/6 mice implanted with 2 × 10⁴ shC and shTfpi2 CT2A cells. n = 7–9 biological replicates. p, Survival curves of nude mice implanted with 2 × 10⁵ shC and shTFPI2 GSC272 cells. n = 9–10 biological replicates. q, Representative of immunofluorescence staining of SOX2, Ki67 and cleaved caspase 3 (CC3) in tumors from C57BL/6 mice intracranially implanted with shC and shTfpi2 QPP7 GSCs. Scale bar, 50 μm. rt, Quantification of the relative expression levels of SOX2 (r), Ki67 (s) and CC3 (t) in tumors from C57BL/6 mice intracranially implanted with QPP7 GSCs expressing shC and shTfpi2. n = 3 biological replicates. Error bars indicate mean ± s.e.m. One-way ANOVA test. In mp, log-rank test was carried out.
Fig. 3:
Fig. 3:. TFPI2 promotes stemness and tumor growth by activating JNK–STAT3 signaling.
a, Transcriptomic profiling in GSC272 cells following TFPI2 depletion and GSEA analysis shows the eight oncogenic pathways affected by TFPI2 depletion. b, Immunoblots for P-JNK and JNK in GSC23 and GSC262 cells expressing control and TFPI2 overexpression (OE) plasmid. c, Immunoblots for P-JNK and JNK in GSC272, QPP7 GSCs and CT2A cells expressing shRNA control (shC) and TFPI2 shRNAs (shTFPI2). d, Representative images of tumorspheres in GSC23 and GSC262 expressing control and TFPI2 OE plasmid treated with or without JNK inhibitor JNK-IN-8 (10 nM). Scale bar, 400 μm. e,f, Quantification of tumorspheres in GSC23 (e) and GSC262 (f) expressing control and TFPI2 OE plasmid treated with or without JNK-IN-8 (10 nM). n = 6 biological replicates. g, Identification of two oncogenic pathways (as indicated) in distinct datasets with three comparisons (GSC272 RNA-seq data: shC versus shTFPI2 and two TCGA GBM datasets: TFPI2-high versus TFPI2-low). h, Immunoblots for P-STAT3 and STAT3 in GSC23 and GSC262 expressing control and TFPI2 OE plasmid. i, Immunoblots for P-STAT3 and STAT3 in GSC272, QPP7 GSCs and CT2A cells expressing shC and shTFPI2. j, Representative images of tumorspheres in GSC23 and GSC262 expressing control and TFPI2 OE plasmid treated with or without STAT3 inhibitor WP1066 (20 nM). Scale bar, 400 μm. k,l, Quantification of tumorspheres in GSC23 (k) and GSC262 (l) expressing control and TFPI2 OE plasmid treated with or without WP1066 (20 nM). n = 6 biological replicates. m, Immunoblots for P-STAT3 and STAT3 in GSC23 and GSC262 expressing control and TFPI2 OE plasmid treated with or without JNK inhibitor JNK-IN-8 (10 nM). n, Immunoblots for P-JNK and JNK in GSC23 and GSC262 expressing control and TFPI2 OE plasmid treated with or without STAT3 inhibitor WP1066 (20 nM). o, Survival curves of nude mice implanted with 2 × 10⁴ GSC23 expressing control and TFPI2 overexpression (OE) plasmid. Mice were treated with JNK inhibitor JNK-IN-8 (30 mg kg−1 body weight, i.p., every day) or STAT3 inhibitor WP1066 (30 mg kg−1 body weight, i.p., every day) on day 7. n = 6 biological replicates. Error bars indicate mean ± s.e.m. One-way ANOVA test. In o, log-rank test was carried out.
Fig. 4:
Fig. 4:. TFPI2 activates STAT6 to promote microglia infiltration.
a,b, Representative (a) and quantification (b) of relative migration of SIM-A9, HMC3, and primary human microglia (PrhMG) following stimulation with TFPI2 recombinant protein. Scale bars, 200 μm for HMC3 and SIM-A9, and 400 μm for PrhMG. c, Quantification of transwell migration of PrhMG following stimulation with CM from GSC262 or GSC23 cells expressing control and TFPI2 overexpression (OE) plasmid. d, Quantification of transwell migration of PrhMG, HMC3 and SIM-A9 following stimulation with CM from GSC272 cells (for PrhMG and HMC3) or QPP7 cells (for SIM-A9) expressing control shRNA (shC) and TFPI2 shRNAs (shTFPI2). e,f, Representative images (e) and quantification (f) of flow cytometry for the percentage of CD45lowCD11b+CX3CR1+ microglia in size-matched shC and shTfpi2 CT2A tumors. n = 4 and 3 for shC and shTfpi2, respectively. g,h, Immunofluorescence (g) and quantification (h) of CX3CR1 in size-matched shC and shTfpi2 QPP7 tumors. Scale bar, 25 μm. i,j, Immunofluorescence (i) and quantification (j) of CX3CR1 in size-matched shC and shTFPI2 GSC272 tumors. Scale bar, 25 μm. n = 6 biological replicates. k, Representative of human phospho-kinases in HMC3 cells treated with or without TFPI2 protein. Affected kinases are indicated. l,m, Immunoblots for P-STAT6 and STAT6 in cell lysates of HMC3 (l), SIM-A9 and PrhMG (m) incubated with TFPI2 protein at indicated concentrations and timepoints. n,o, Representative (n) and quantification (o) of flow cytometry for P-STAT6 expression in PrhMG treated with or without TFPI2 protein. p, Quantification of transwell migration of mouse primary microglia isolated from WT and STAT6 KO mice following stimulation with TFPI2 protein. q, Quantification of transwell migration of PrhMG, HMC3, and SIM-A9 microglia following stimulation with TFPI2 protein in the presence or absence of STAT6 inhibitor AS1517499 (25 nM). r,s, Quantification of incucyte live-cell (r) and scratch wound healing (s) migration of HMC3 microglia following TFPI2 protein stimulation with or without AS1517499 (25 nM). In r, n = 6,289, 2,934, 7,966 and 34,440 cells for control, TFPI2, TFPI2 + STAT6i, and STAT6i, respectively. In bd, h, oq and s, n = 3 biological replicates. TFPI2 protein was used at 20 ng ml−1 unless indicated. Error bars indicate mean ± s.e.m. A two-tailed Student’s t-test was performed for comparisons between two groups. A one-way ANOVA followed by a Tukey test was performed to compare more than two groups.
Fig. 5:
Fig. 5:. TFPI2–STAT6 signaling axis triggers microglia immunosuppressive polarization.
a,b, Representative (a) and quantification (b) of flow cytometry for the percentage of CD206+ PrhMG treated with CM from GSC262 expressing control and TFPI2 overexpression (OE) plasmid. c, Quantification of flow cytometry for the percentage of CD206+ PrhMG treated with CM from control and TFPI2 OE GSC23. d, Quantification of flow cytometry for the percentage of CD206+ cells in HMC3 microglia treated with CM from GSC272 expressing shRNA control (shC) and TFPI2 shRNAs (shTFPI2). e, Quantification of flow cytometry for the percentage of CD206+ cells in SIM-A9 microglia treated with CM from shC and shTfpi2 QPP7 GSCs with or without reexpression of shRNA-resistant TFPI2 cDNA (OE). f,g, Representative images (f) and quantification (g) of flow cytometry for the percentage of CD45lowCD11b+CX3CR1+CD206+ microglia in size-matched shC and shTfpi2 CT2A tumors. n = 4 and 3 for shC and shTfpi2, respectively. hj, Immunofluorescence (h) and quantification of CX3CR1+ CD206+ (i) or CX3CR1+CD163+ (j) cells in size-matched shC and shTfpi2 QPP7 tumors. Scale bar, 25 μm. n = 6 biological replicates. k, Quantification of flow cytometry for the percentage of CD206+ cells in primary microglia isolated from WT and STAT6 KO mice following stimulation with TFPI2 protein. l,m, Representative (l) and quantification (m) of flow cytometry for arginase 1 (ARG1) in primary microglia isolated from WT and STAT6 KO mice following stimulation with TFPI2 protein. n,o, Quantification of flow cytometry for the percentage of CD206+ cells (n) and ARG1 expression (o) in SIM-A9 microglia treated with TFPI2 protein in the presence or absence of STAT6i AS1517499. p,q, Quantification of flow cytometry for the percentage of CD206+ cells (p) and ARG1 expression (q) in HMC3 microglia treated with TFPI2 protein combining with or without AS1517499. r, Relative mRNA expression of indicated genes in SIM-A9 cells treated with TFPI2 protein in the presence or absence of AS1517499. s, Relative mRNA expression of indicated genes in HMC3 cells treated with TFPI2 protein in the presence or absence of AS1517499. n = 3 or 4 biological replicates. In be, k and mr, n = 3 biological replicates. Error bars indicate mean ± s.e.m. One-way ANOVA test. TFPI2 protein at 20 ng ml−1 and AS1517499 at 25 nM were used.
Fig. 6:
Fig. 6:. CD51 is a membrane receptor for TFPI2 on microglia.
a, Working flow for identifying TFPI2 receptor on microglia. FC, fold change. b,c, IP with CD51 antibody (CD51 Ab) and immunoblotting for the interaction between TFPI2 and CD51 in SIM-A9 (b) and HMC3 (c) microglia. d, Calcium mobilization triggered by TFPI2 recombinant protein (20 ng ml−1) in SIM-A9 microglia expressing shRNA control (shC) or Itgav shRNAs (shItgav). ΔF, change of fluorescence intensity at the given time; F0, resting fluorescence intensity. e, Calcium mobilization triggered by TFPI2 protein in SIM-A9 microglia treated with or without CD51 inhibitor MK-0429 at indicated concentrations. f, Immunoblots for P-PLCγ1, PLCγ1, P-PKCζ and PKCζ in cell lysates of HMC3 microglia incubated with TFPI2 protein in the presence or absence of MK-0429 (50 nM). g, Immunoblots for P-STAT6 and STAT6 in cell lysates from SIM-A9 microglia expressing shC and shItgav treated with or without TFPI2 protein. h, Immunoblots for P-STAT6 and STAT6 in cell lysates from HMC3 microglia treated with or without TFPI2 protein and MK-0429 (50 nM). i,j, Representative images (i) and quantification (j) of relative migration of mouse SIM-A9 microglia expressing shC and shItgav following stimulation with TFPI2 protein. Scale bars, 400 μm. n = 3 biological replicates. k, Quantification of relative migration of PrhMG, human HMC3 and mouse SIM-A9 microglia treated with or without TFPI2 protein in the presence or absence of MK-0429 at indicated concentrations. n = 3 biological replicates. l,m, Representative (l) and quantification (m) of flow cytometry analysis for the percentage of CD206+ SIM-A9 microglia expressing shC and shItgav following stimulation with or without TFPI2 protein. n = 3 biological replicates. n,o, Representative (n) and quantification (o) of flow cytometry analysis for the percentage of ARG1+ SIM-A9 microglia expressing shC and shItgav following stimulation with or without TFPI2 protein. n = 3 biological replicates. p,q, Quantification of flow cytometry analysis for the percentage of CD206+ (p) and ARG1+ (q) PrhMG treated with TFPI2 protein in the presence or absence of MK-0429 (50 nM). n = 3 biological replicates. Error bars indicate mean ± s.e.m. One-way ANOVA test. TFPI2 protein at 20 ng ml−1 was used.
Fig. 7:
Fig. 7:. TFPI2–CD51–STAT6 axis inhibition activates antitumor immunity and synergizes with anti-PD1 therapy.
a,b, Representative (a) and quantification (b) of flow cytometry analysis for CD45+CD3+ T cells in the spleens of C57BL/6 mice bearing size-matched CT2A tumors expressing shRNA control (shC) and Tfpi2 shRNAs (shTfpi2). cf, Quantification of flow cytometry analysis for CD45+CD3+CD8+ T cells (c), CD45+CD3+CD4+ T cells (d), CD45+CD3+CD8+PD1hi T cells (e) and CD45+CD3+CD4+PD1hi T cells (f) in the spleens of C57BL/6 mice bearing size-matched shC and shTfpi2 CT2A tumors. n = 4 and 3 for shC and shTfpi2, respectively. g,h, Representative (g) and quantification (h) of the viability of primary CD8+ T cells cocultured with SIM-A9 microglia treated with or without TFPI2 protein (20 ng ml−1) and STAT6 inhibitor AS1517499 (25 nM). i,j, Representative (i) and quantification (j) of the percentage of CD69+ cells out of total CD8+ T cells cocultured with SIM-A9 microglia treated with TFPI2 protein (20 ng ml−1) in the presence or absence of AS1517499 (25 nM). k, Quantification of the percentage of IFNγ+ cells out of total CD8+ T cells cocultured with SIM-A9 microglia treated with or without TFPI2 protein (20 ng ml−1) and AS1517499 (25 nM). ln, Quantification the viability (l), CD69+ cells (m) and IFNγ+ cells (n) in JURKAT T cells cocultured with PrhMG treated with or without TFPI2 protein (20 ng ml−1) and AS1517499 (25 nM). In b, h, j, k and ln, n = 3 biological replicates. o, Survival curves of C57BL/6 mice implanted with shC and shTfpi2 CT2A cells (2 × 10⁴ cells). Mice were treated with anti-PD1 (10 mg kg−1, i.p.) on days 11, 14 and 17. n = 6 for shC and shTfpi2 #2+anti-PD1, 7 for shC+anti-PD1, shTfpi2 #3 and shTfpi2 #3+anti-PD1, and 8 for shTfpi2 #2. ps, Survival curves of C57BL/6 mice implanted with 005 GSCs (2 × 10⁵ cells) or CT2A cells (2 × 10⁴ cells). Mice were treated with MK-0429 (30 mg kg−1, i.p., every other day; p and q) or AS1517499 (10 mg kg−1, i.p., every other day; r and s) on day 7, and then received anti-PD1 treatment on days 11, 14 and 17. In p, n = 8, 7, 9 and 9; and in q, n = 8, 7, 8 and 7 for control, anti-PD1, MK-0429 and MK-0429+anti-PD1, respectively. In r and s, n = 6 biological replicates. Error bars indicate mean ± s.e.m. One-way ANOVA test. In os, log-rank test was carried out.
Fig. 8:
Fig. 8:. TFPI2 is a prognostic biomarker correlating with GSC stemness and microglia abundance in GBM.
a, Representative images show low, medium and high expression of TFPI2, CD133, SOX2 and CX3CR1 in human GBM tumor samples based on immunohistochemistry staining. Scale bar, 100 μm. bd, Quantification of immunohistochemistry staining showing strong positive correlations between TFPI2 and CD133 (b), TFPI2 and SOX2 (c), or TFPI2 and CX3CR1 (d) in human GBM tumor samples (n = 60). R and P values were determined by Pearson correlation. e, Quantification of microglia signature in GBM patient tumors with GBM cell TFPI2 high and low based on scRNA-seq data (EGAS00001004422 and GSE131928). n = 22 and 13 patients for TFPI2 low and high, respectively. fh, GSEA for stemness signature (f), microglia signature (g) and activated CD8+ T-cell signature (h) in TFPI2-high patient tumors compared with TFPI2-low patient tumors from TCGA GBM dataset. Normalized enrichment scores (NES) and false discovery rate (FDR) are shown. i, ELISA for TFPI2 in the plasma from healthy controls (n = 6) and patients with GBM (n = 55). j, Correlation between Ki67 expression in tumors and TFPI2 plasma concentration in patients with GBM (n = 55). k, Correlation between overall survival and TFPI2 plasma concentration in patients with GBM (n = 35). In j and k, R and P values were determined by Pearson correlation. l, Overall survival of patients with high (n = 23) and low (n = 31) TFPI2 plasma concentration (cut-off at median). Log-rank test and P value is shown. Error bars indicate mean ± s.e.m. A two-tailed Student’s t-test was performed for comparisons between two groups.

Similar articles

Cited by

References

    1. Prager BC, Bhargava S, Mahadev V, Hubert CG & Rich JN Glioblastoma stem cells: driving resilience through chaos. Trends Cancer 6, 223–235 (2020). - PMC - PubMed
    1. Couturier CP et al. Single-cell RNA-seq reveals that glioblastoma recapitulates a normal neurodevelopmental hierarchy. Nat. Commun. 11, 3406 (2020). - PMC - PubMed
    1. Guilhamon P et al. Single-cell chromatin accessibility profiling of glioblastoma identifies an invasive cancer stem cell population associated with lower survival. eLife 10, e64090 (2021). - PMC - PubMed
    1. Chen P, Hsu WH, Han J, Xia Y & DePinho RA Cancer stemness meets immunity: from mechanism to therapy. Cell Rep. 34, 108597 (2021). - PMC - PubMed
    1. Xuan W, Lesniak MS, James CD, Heimberger AB & Chen P Context-dependent glioblastoma-macrophage/microglia symbiosis and associated mechanisms. Trends Immunol. 42, 280–292 (2021). - PMC - PubMed