

doi: 10.1038/s41587-023-01937-y.
Epub 2023 Sep 4.
Spatial multimodal analysis of transcriptomes and metabolomes in tissues
Affiliations
- PMID: 37667091
- PMCID: PMC11251988
- DOI: 10.1038/s41587-023-01937-y
Item in Clipboard
Spatial multimodal analysis of transcriptomes and metabolomes in tissues
Nat Biotechnol.
2024 Jul.
Abstract
We present a spatial omics approach that combines histology, mass spectrometry imaging and spatial transcriptomics to facilitate precise measurements of mRNA transcripts and low-molecular-weight metabolites across tissue regions. The workflow is compatible with commercially available Visium glass slides. We demonstrate the potential of our method using mouse and human brain samples in the context of dopamine and Parkinson's disease.
© 2023. The Author(s).
Conflict of interest statement
M.V., R.M., L.L., M.N. and J.L. are scientific consultants for 10X Genomics. The other authors declare no competing interests.
Figures
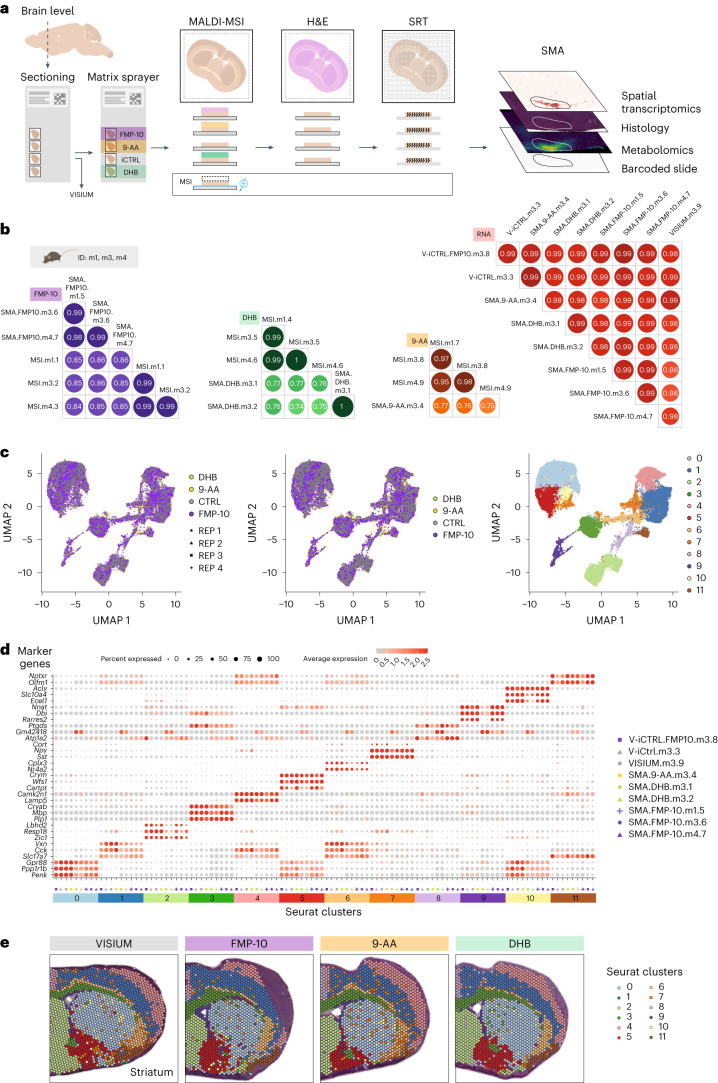
a, The SMA workflow and quality control design—nonembedded, snap-frozen samples are sectioned and thaw-mounted onto noncharged, barcoded Visium Gene Expression arrays. Tissue sections are then sprayed with MALDI matrices and MSI is performed. This is followed by H&E staining and imaging with bright field microscopy. Finally, sections are processed for SRT. We also designed the following three types of control samples: (1) MSI—samples processed with standard MALDI-MSI protocol on ITO conductive slides; (2) VISIUM—samples processed with standard Visium protocol on all four capture areas of a Visium Gene Expression array and (3) V-iCTRL—samples processed with Visium protocol, but MALDI-MSI was performed on other capture areas of a Visium Gene Expression array. b, Pairwise gene-to-gene and molecule-to-molecule correlations across biological replicates. Samples are named with short identifiers that reflect the technical conditions under which the sample was analyzed: MSI, stand-alone MALDI-MSI; SMA, SMA protocol; VISIUM, stand-alone Visium. Additional acronyms indicate the matrix used in the SMA protocol (FMP-10, DHB and 9-AA), the sample (m1, m3 or m4) and the serial number of the tissue section (one to nine for each section placed on either ITO or Visium slides). c, UMAP of SMA ST spots colored by sections (left), MALDI matrices (middle) and clusters (right). d, Top three marker genes with highest average log2 fold change for each spatial cluster across biological replicates. e, Spatial plot of mouse brain tissue sections (striatal level, 0.49 mm from bregma) that illustrates clusters of transcripts for samples sprayed with three different MALDI matrices (FMP-10, 9-AA and DHB) and one sample processed with the stand-alone Visium protocol.
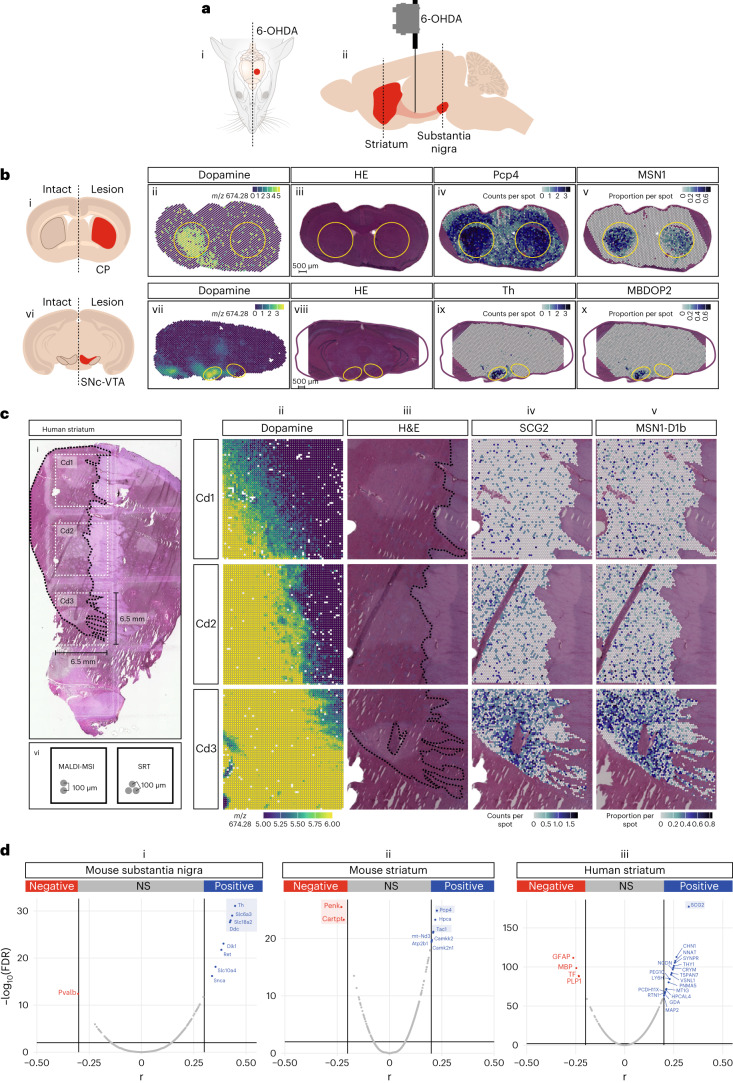
a, Cartoon showing the injection of 6-OHDA only in one hemisphere in the MFB. Dashed lines indicate the depth (0.49 and −3.39 mm, distance from bregma) for the substantia nigra and striatum, respectively. b, Representative sections from the substantia nigra and striatum of the mouse PD model. From left to right: cartoon showing the dopamine-depleted regions (i and vi), dopamine expression (ii and vii), H&E staining (iii and viii), spatial gene expression of the gene with the highest correlation to dopamine (iv and ix), proportions of MSN1 (v) and MBDOP2 (x). The remaining two striatal and two nigral sections processed with SMA and FMP-10 present in our dataset show similar results. c, Human postmortem striatum sample. From left to right: images are presented in the same order as in b. The demarcated area indicates the caudate nucleus of the striatum. See Fig. 2 for gene counts statistics. d, From left to right (i, ii and iii): dopamine-to-gene correlations in the mouse substantia nigra, mouse striatum and human striatum. Cd, caudate nucleus; CP, caudoputamen; NS, not significant.
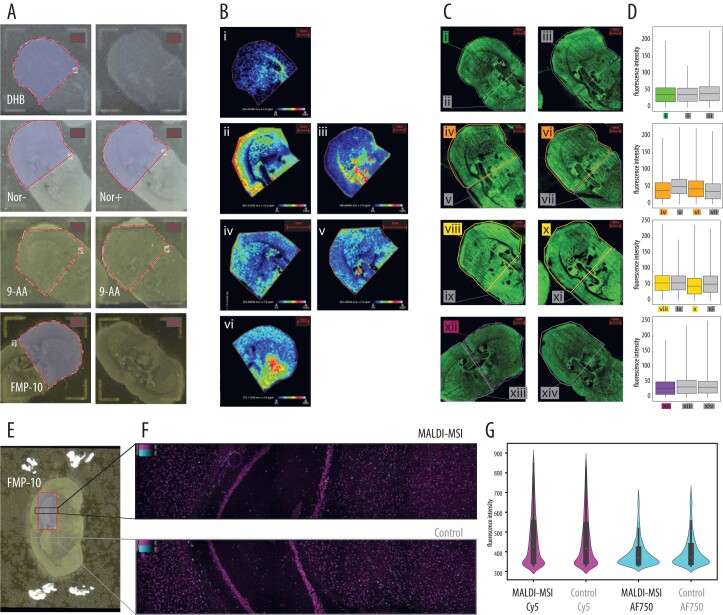
(a) Eight mouse brain tissue sections from the striatal level of the same animal (n = 8) were mounted onto a Visium Tissue Optimization slide and sprayed with four different MALDI matrices (DHB, norharmane (analyzed in both positive and negative mode, shown as Nor+ and Nor-), 9-AA and FMP-10). Areas delimited by red lines: regions of interest imaged with MALDI-MSI. Scalebars: 1 mm. (b) Representative MSI results from: i) m/z 426.36, C18:1 L-Carnitine (DHB); ii) m/z 857.52, PI(36:4) (Nor-); iii) m/z 788.62 PC(36:1) (Nor+); iv,v) m/z 303.24, arachidonic acid (9-AA); vi) m/z 371.17, GABA (FMP-10). Nor+ and Nor-: Norharmane analyzed in positive and negative mode, respectively. Scalebars: 1 mm, except iv and v where it is 2 mm. (c) Fluorescence microscopy images of mRNA footprint captured with polydT probes after MALDI-MSI. Colored lines (i, iv, vi, viii, x, xii) demarcate areas imaged with MALDI-MSI, while gray lines (ii, iii, v, vii, ix, xi, xiii, xiv) demarcate areas not imaged with MALDI-MSI and used as controls. Scalebars: 1 mm. (d) Fluorescence intensity of tissue areas imaged or not with MALDI-MSI. The upper and lower limit of the box represent the +1 and −1 standard deviation from the mean, the horizontal line inside the box represents the mean fluorescence intensity, and the upper and lower limits of the whiskers represent the maximum and minimum fluorescence intensity values. The results shown in panels (A-C) belong to eight consecutive tissue sections from n = 1 biologically independent sample examined over one independent experiment (all the sections were placed on one Visium Tissue Optimization array). The areas in square pixels over which the statistics is derived are the following: i = 768047, ii=355349, iii=843707, iv=866085, v = 578711, vi=805789, vii=562179, viii=846042, ix=317398, x = 843416, xi=611982, xii=779667, xiii=727089, xiv=751797. (e) A mouse brain tissue sections (n = 1) from the hippocampus level was mounted onto an ITO slide and sprayed FMP-10. The area delimited by a red line demarcates the region of interest imaged with MALDI-MSI. (f) Targeted In Situ Sequencing data demonstrate similar rolling circle product (RCP) density generated from MALDI-MSI processed region (upper right panel) and non-processed region (lower right panel) for demarcated regions of interest in the mouse coronal section (n = 1). Targeted ISS simultaneously probed for housekeeping gene, Gapdh labeled in Magenta (Cy5), and a panel of five control genes - Foxj1, Plp1, Lamp5, Rorb and Kcnip2 that are labeled in Cyan (AF750). (g) Mean Cy5 and AF750 fluorescence intensity of rolling circle products in tissue areas imaged or not with MALDI-MSI.The results shown in panels (E-G) belong to one tissue section from n = 1 biologically independent sample examined over one independent experiment. The number of RCPs detected in the MALDI-MSI processed region in AF750 and Cy5 and the number of RCPs detected in the non-processed region in AF750 and Cy5 respectively, which the statistics is derived from, are the following: n = 3830,n = 18231, n = 3051,n = 18193. The lower and upper hinges of the boxplot correspond to the first and third quartiles (the 25th and 75th percentiles), the central white dot corresponds to the median, the upper and lower whiskers extend from the hinge to the maximum or minimum respectively.
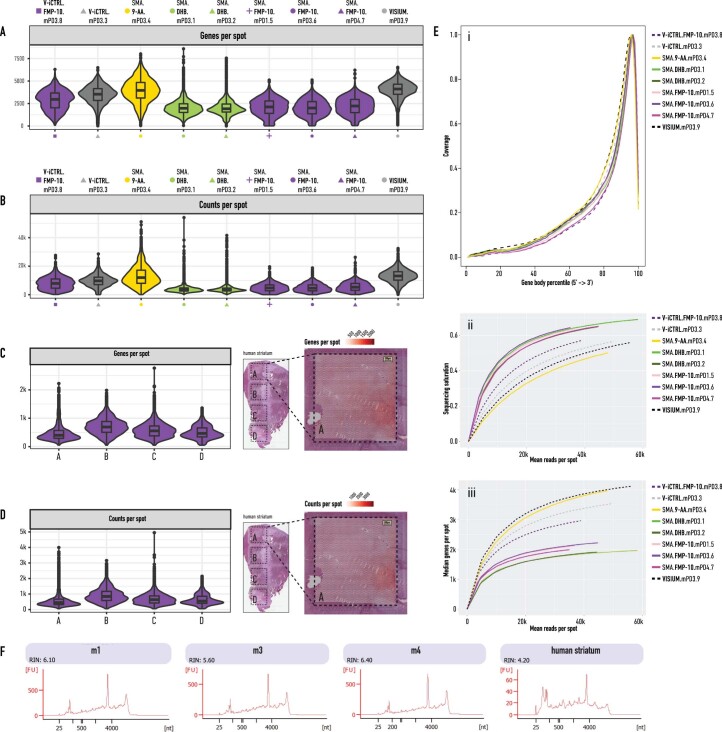
Violin plots and box plots illustrating the number of unique genes per spot (a) and the number of unique molecular identifiers (UMIs) per spot (b) across biological conditions of the mouse striatum data (n = 9). The numbers of spots per section from which the statistics is derived are the same for the corresponding sections in panels A and B, and are the following: V-iCTRL.FMP10.mPD3.8 = 3017, V-iCTRL.nM.mPD3.3 = 3163, SMA.9AA.mPD3.4 = 2913, SMA.DHB.mPD3.1 = 2856, SMA.DHB.mPD3.2 = 3002, SMA.FMP10.mPD1.5 = 2675, SMA.FMP10.mPD3.6 = 3120, SMA.FMP10.mPD4.7 = 2918, VISIUM.mPD3.9 = 3116. n = 9 sections examined over 3 biologically independent samples. Violin plots and box plots illustrating the number of unique genes per spot (c) and the number of unique molecular identifiers (UMIs) per spot (d) of the human striatum data (n = 1). The human sample H&E was used as a legend to indicate the four capture areas A-D. The numbers of spots per capture area from which the statistics is derived are the same for corresponding sections in panels C and D and are the following: A = 4770, B = 4875, C = 4740, D = 4387. n = 4 capture areas examined over 1 biologically independent sample. For all boxplots presented in (A-D) the lower and upper hinges of the boxplot correspond to the first and third quartiles (the 25th and 75th percentiles), the central line corresponds to the median, the upper and lower whiskers extend from the hinge to the largest or smallest value respectively no further than 1.5 times the inter-quartile range, data beyond the end of the whiskers are plotted individually as black dots. On the right, spatial featureplot representing the number of genes per spot and the number of UMIs per spot of a representative capture area (that is, capture area A). (e) Sequencing metrics: i) Gene body coverage plot illustrating the sequencing coverage at different percentiles of gene body for all the genes in the quality control dataset; ii) sequencing saturation as a function of mean reads per spot; iii) median genes per spot as a function of mean reads per spot. (f) RNA integrity plots of mouse and human post-mortem samples.
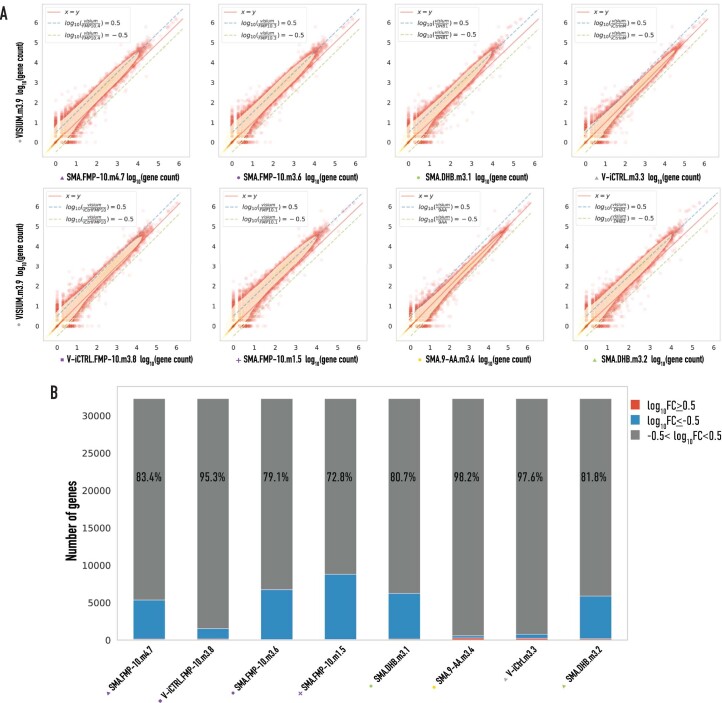
(a) Scatterplots of log10 gene counts of SMA-SRT data vs. stand-alone Visium data. The red line highlights a 1-to-1 relationship, whereas the dashed green and blue lines highlight a log10 0.5 or −0.5 relationship. (b) Stacked barplot illustrating the percentage of genes with log10 higher, lower or within the log10 fold change range −0.5-0.5. The percentages inside the gray bars illustrate the percentages of peaks with absolute log10 below 0.5.
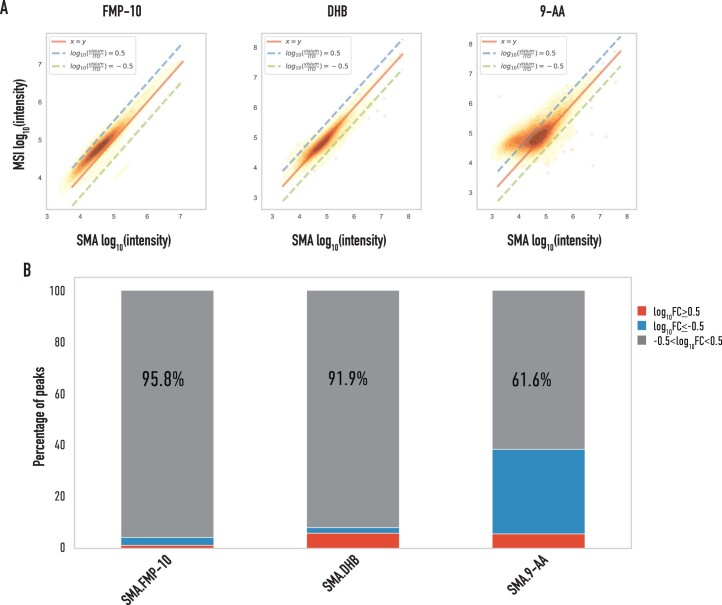
(a) Scatterplots of log10 peak intensities of SMA-MSI data vs stand-alone MALDI-MSI data. The red line highlights a 1-to-1 relationship, whereas the dashed green and blue lines highlight a log10 0.5 or −0.5 relationship. (b) Stacked barplot illustrating the percentage of peaks with log10 higher, lower or within the log10 fold change range −0.5-0.5. The percentages inside the gray bars illustrate the percentages of peaks with absolute log10 below 0.5.
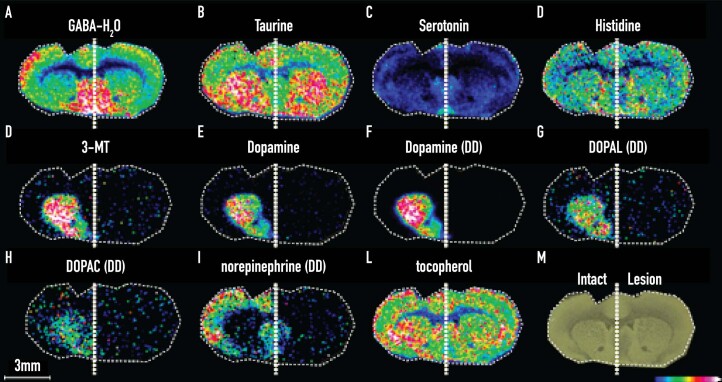
Ion distribution images of (a) GABA-H2O, (b) taurine, (c) serotonin, (d) histidine, (e) 3-MT, (f) dopamine, (g) dopamine, double derivatized (DD), (h) DOPAL (DD), (i) DOPAC (DD), (j) norepinephrine (DD), (k) tocopherol, and (l) scanned image of the coronal mouse tissue section that was analyzed. All ion distribution images are scaled to 50% of max intensity and presented as single derivatized species, unless otherwise stated.
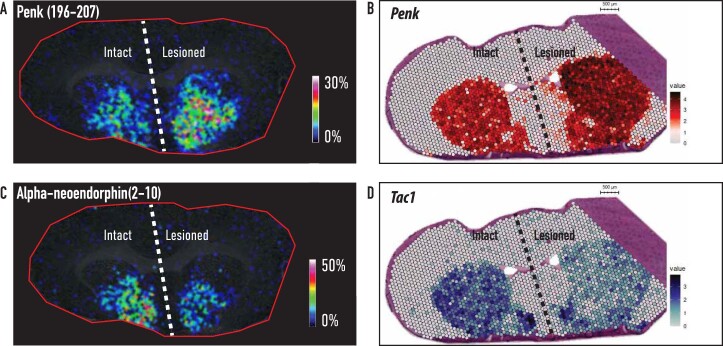
Ion distribution images of (a) Penk(197-208) (SPQLEDEAKELQ, m/z 1386.67) and (c) Alpha-neoendorphin(2-10) (GGFLRKYPK, m/z 1065.62). Spatial gene expression of (b)
Penk and (d)
Tac1.
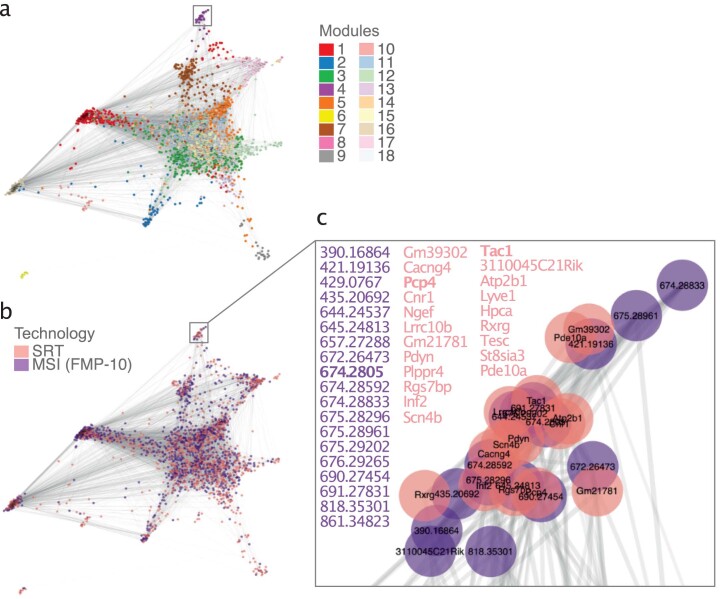
Force directed layout of 10K-nearest neighbors was run on cosine distance graph (represented by edge thickness and shade). Nodes (genes and peaks) were split in 18 spatially co-detected modules using the Spinglass algorithm (a) and by technology of origin (b). Genes and peaks whose expression were associated with dopamine (m/z 674.2805) were enriched in module 4 and shown in (c).
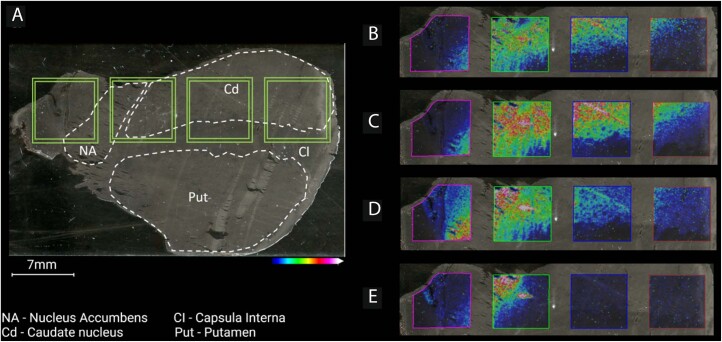
(a) Whole tissue scan with annotated brain regions, where green squares indicate the areas coated with oligonucleotides. Ion images of (b) dopamine, (c) 3-MT, (d) serotonin, and (e) norepinephrine (double derivatized). All ion distributions are scaled to 50% of the maximum intensity and are all displayed as single derivatized species, unless otherwise stated.
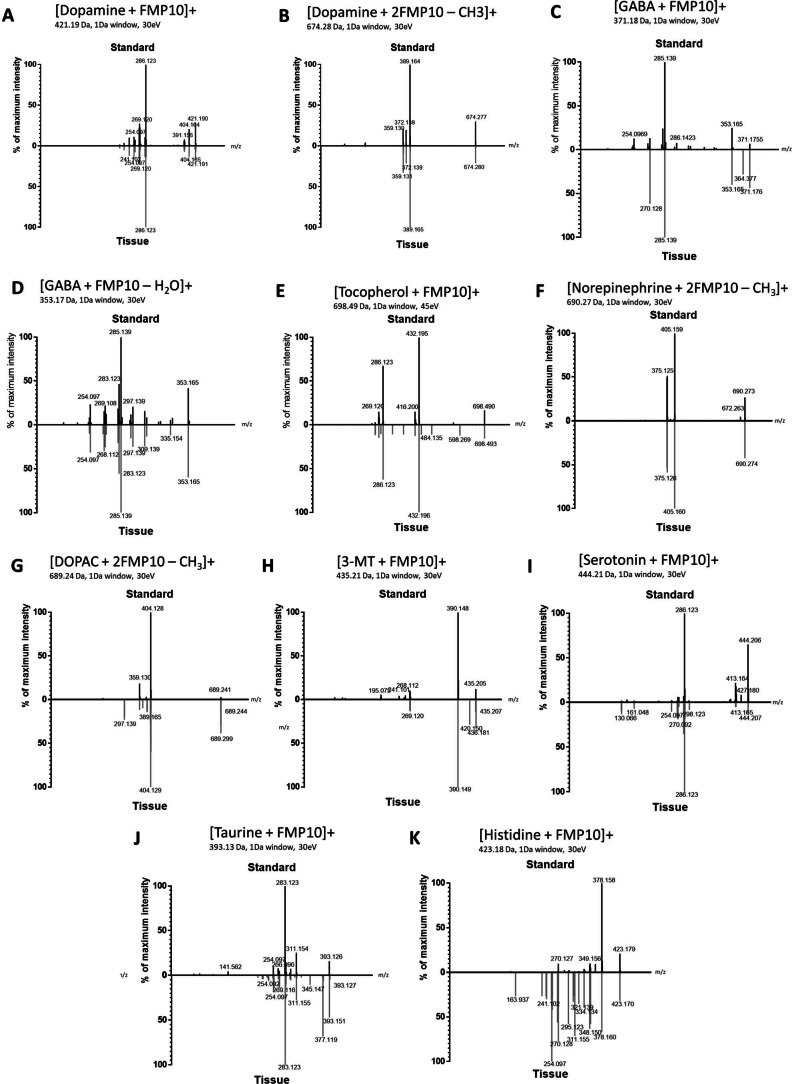
Mirrored spectra obtained from standards and mouse tissue sections derivatized with FMP-10, respectively. (a) Dopamine, m/z 421.19, (b) dopamine double derivatized, m/z 674.28, (c) GABA, m/z 371.18, (d) GABA-H20, m/z 353.17, (e) tocopherol, m/z 698.49, (f) norepinephrine double derivatized, m/z 690.27, (g) DOPAC double derivatized, m/z 698.24, (h) 3-MT, m/z 435.21, (i) serotonin, m/z 444.21, (j) taurine, m/z 393.13, and (k) histidine, m/z 423.18.
References
MeSH terms
Substances
Grants and funding
- KAW 2018.172/Knut och Alice Wallenbergs Stiftelse (Knut and Alice Wallenberg Foundation)
- 2022-03984/Vetenskapsrådet (Swedish Research Council)
- 2021-03293/Vetenskapsrådet (Swedish Research Council)
- 2022-04198/Vetenskapsrådet (Swedish Research Council)
- 2020-06182/Vetenskapsrådet (Swedish Research Council)
LinkOut - more resources
Full Text Sources
Medical
Molecular Biology Databases
