. 2023 Oct;3(10):1237-1250.
doi: 10.1038/s43587-023-00480-4. Epub 2023 Sep 4.

The YAP-TEAD complex promotes senescent cell survival by lowering endoplasmic reticulum stress

Affiliations

The YAP-TEAD complex promotes senescent cell survival by lowering endoplasmic reticulum stress

Carlos Anerillas et al. Nat Aging. 2023 Oct.

Abstract

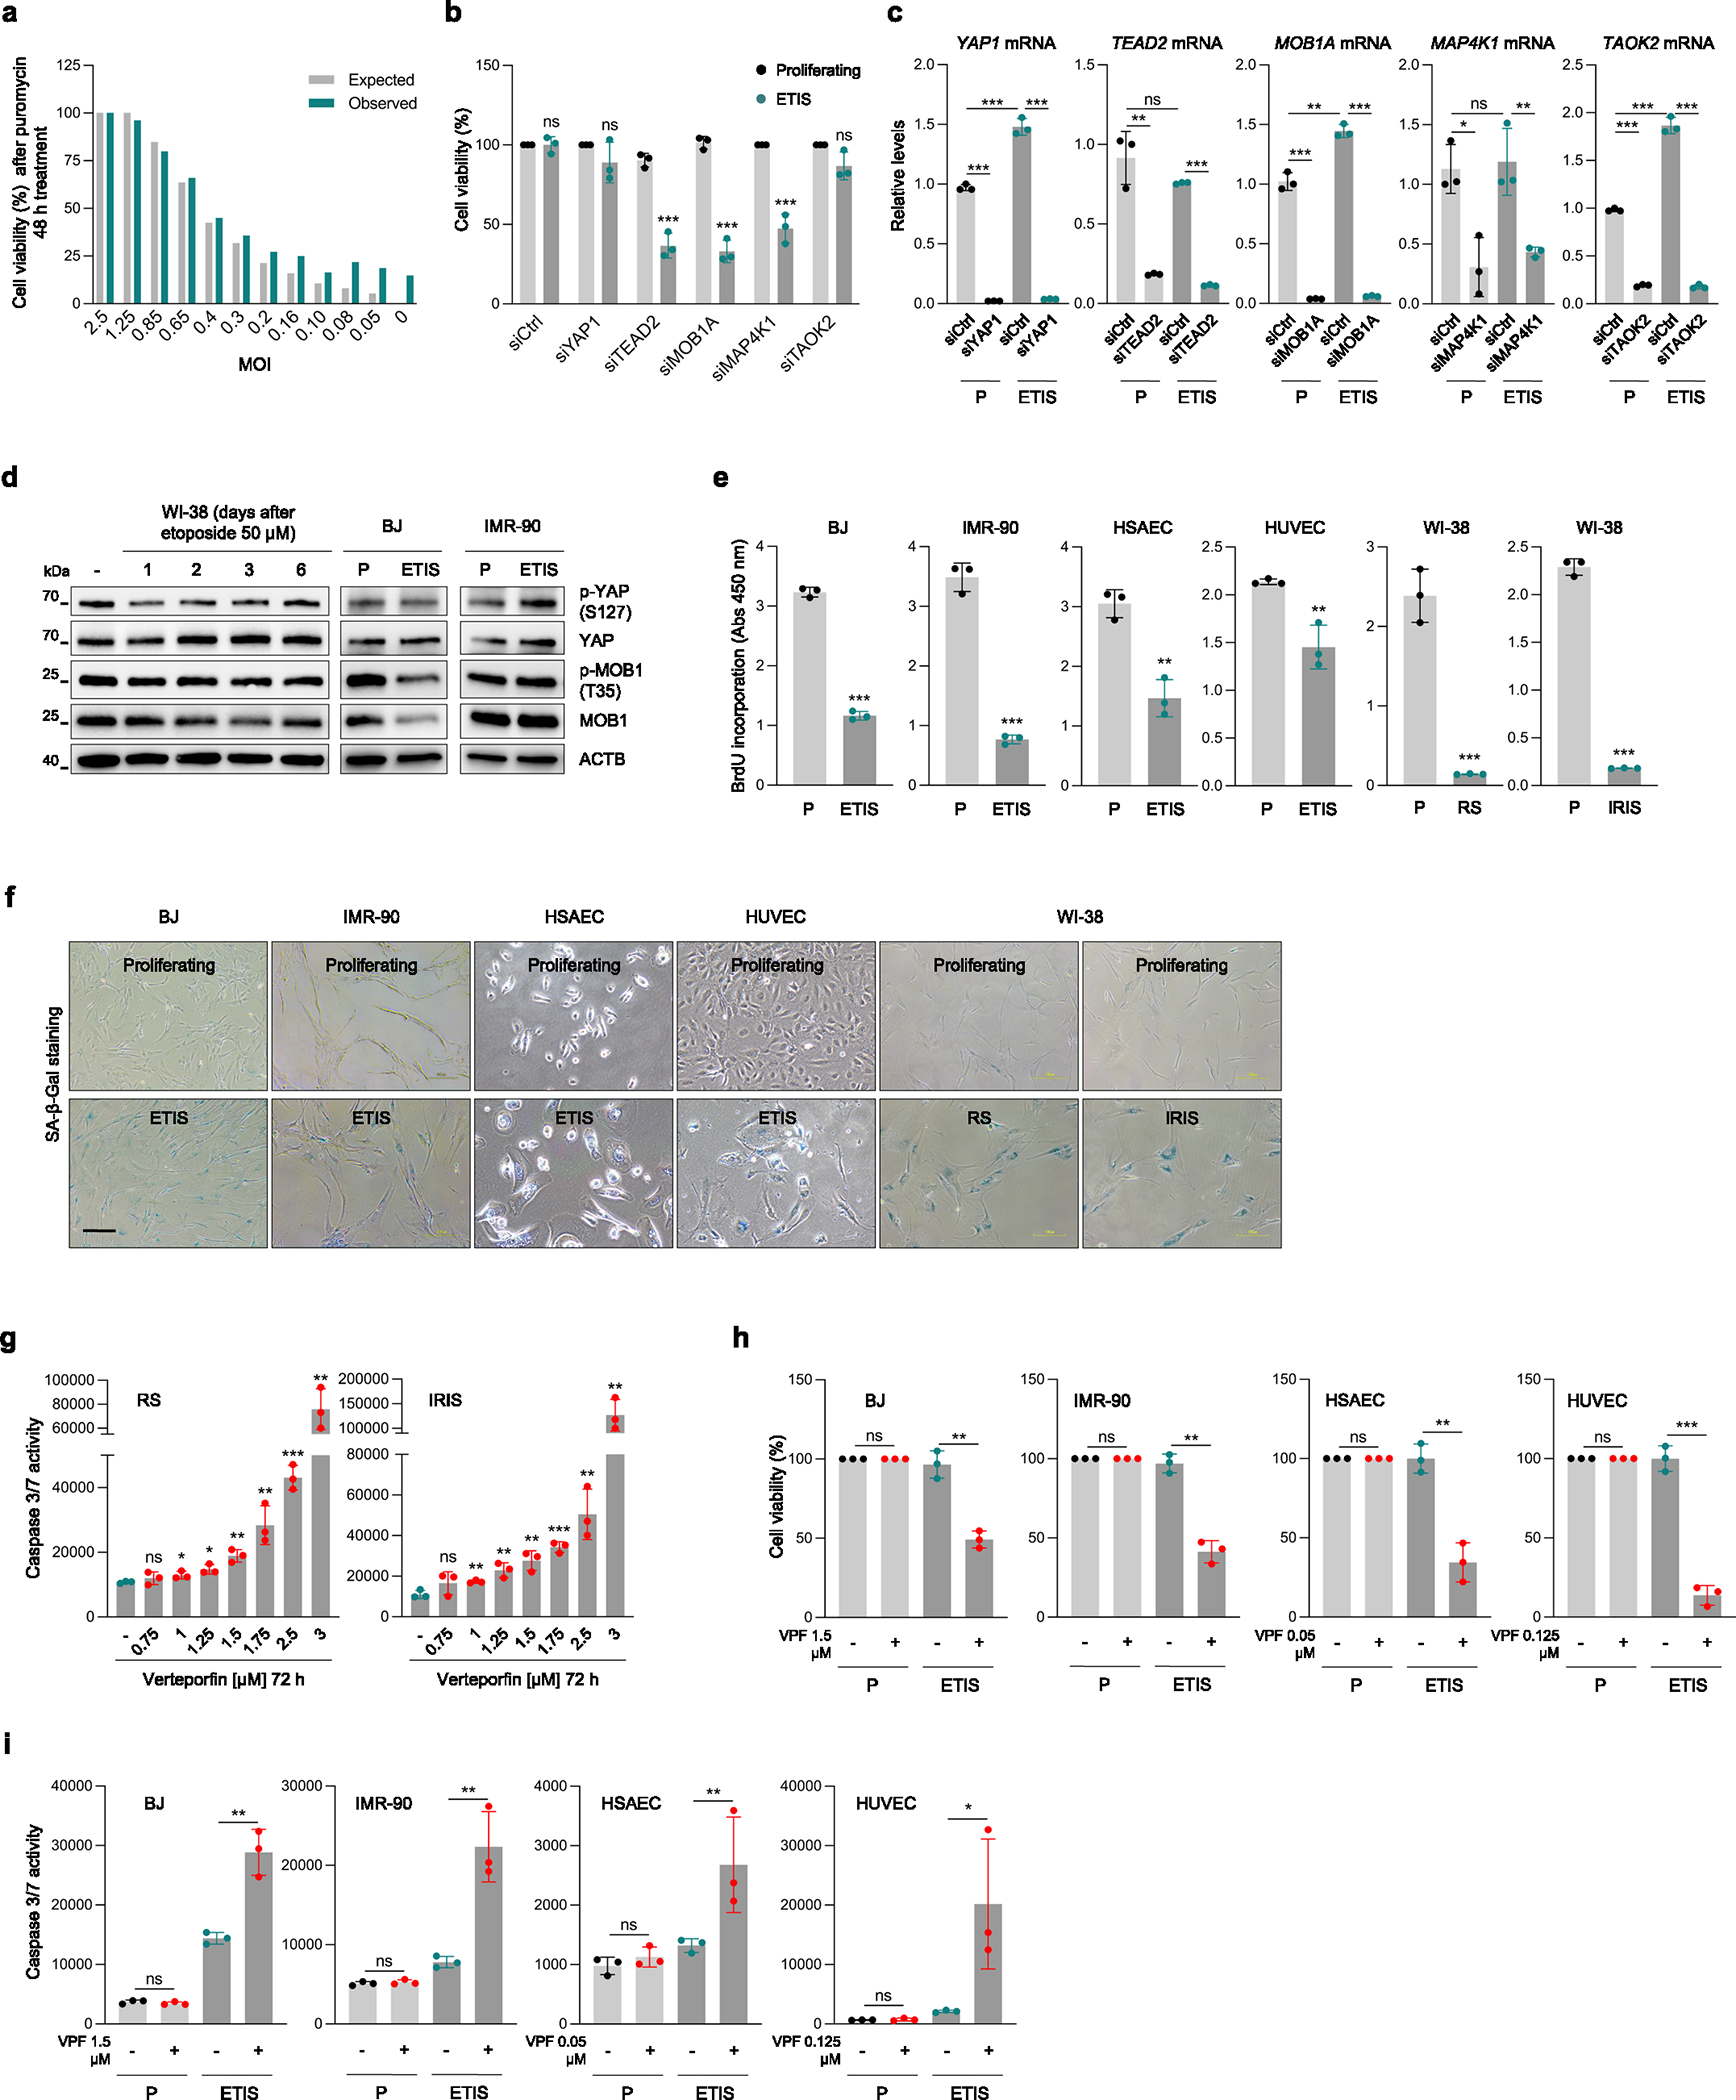
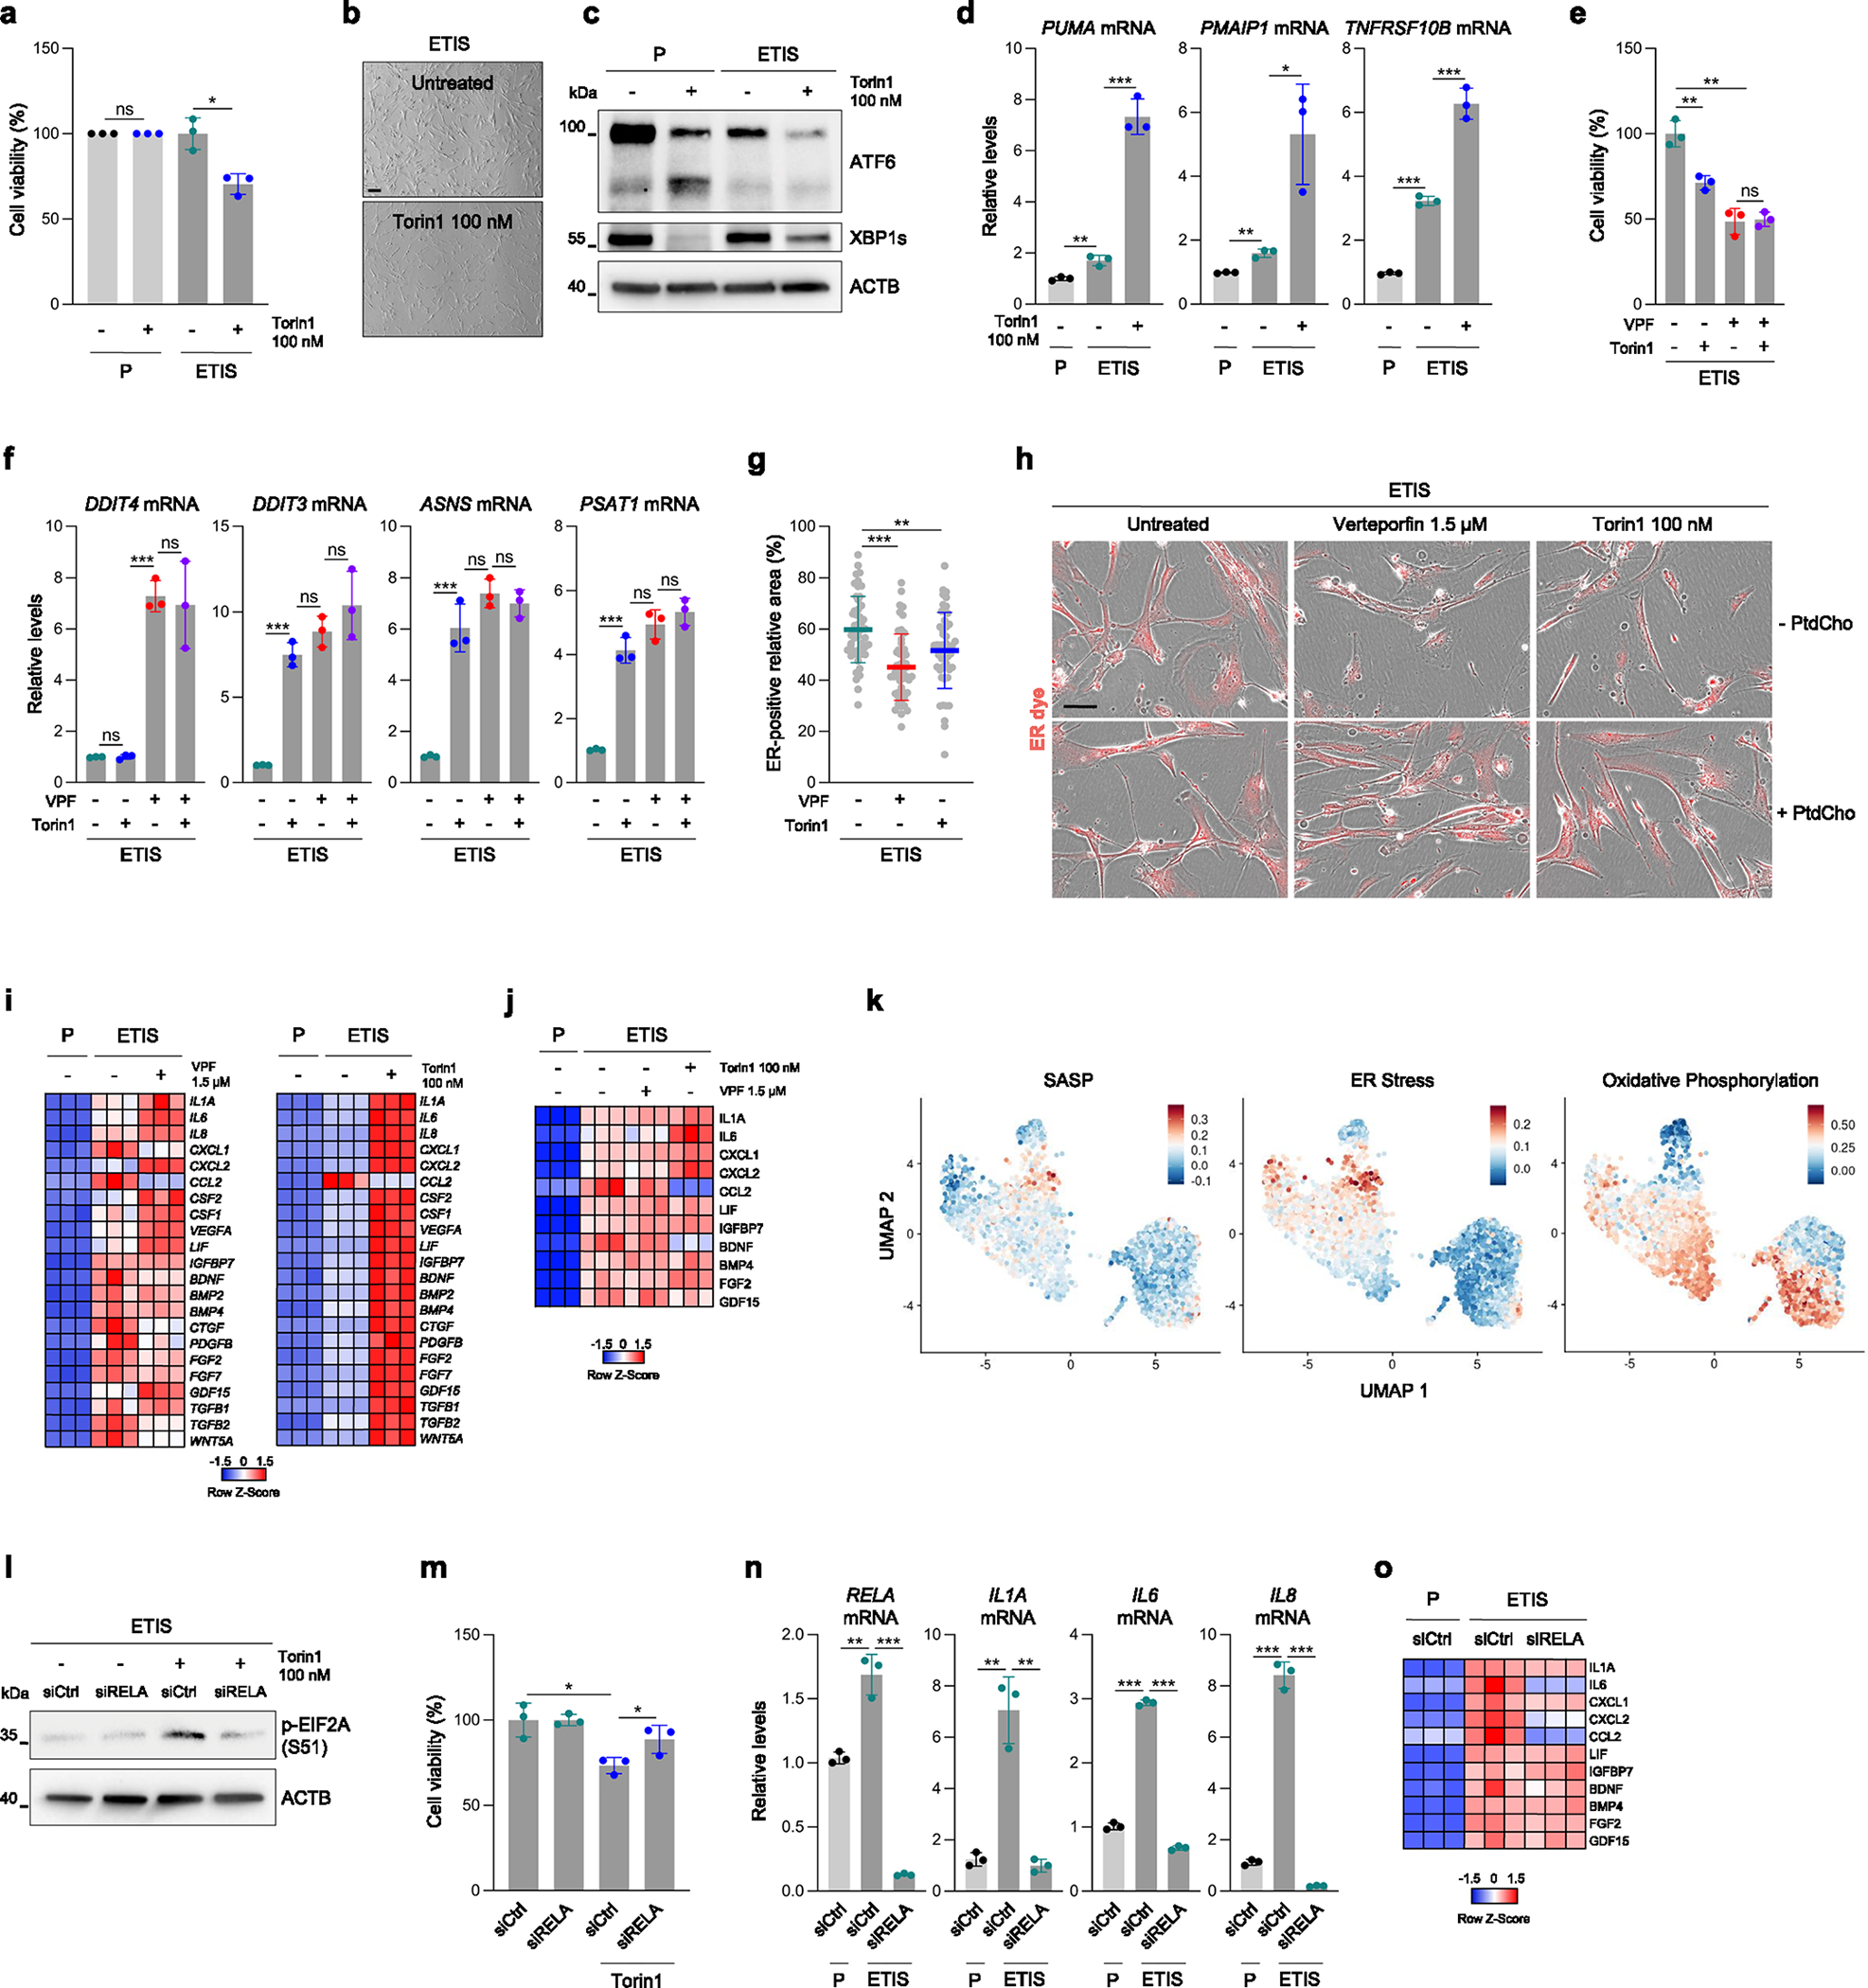
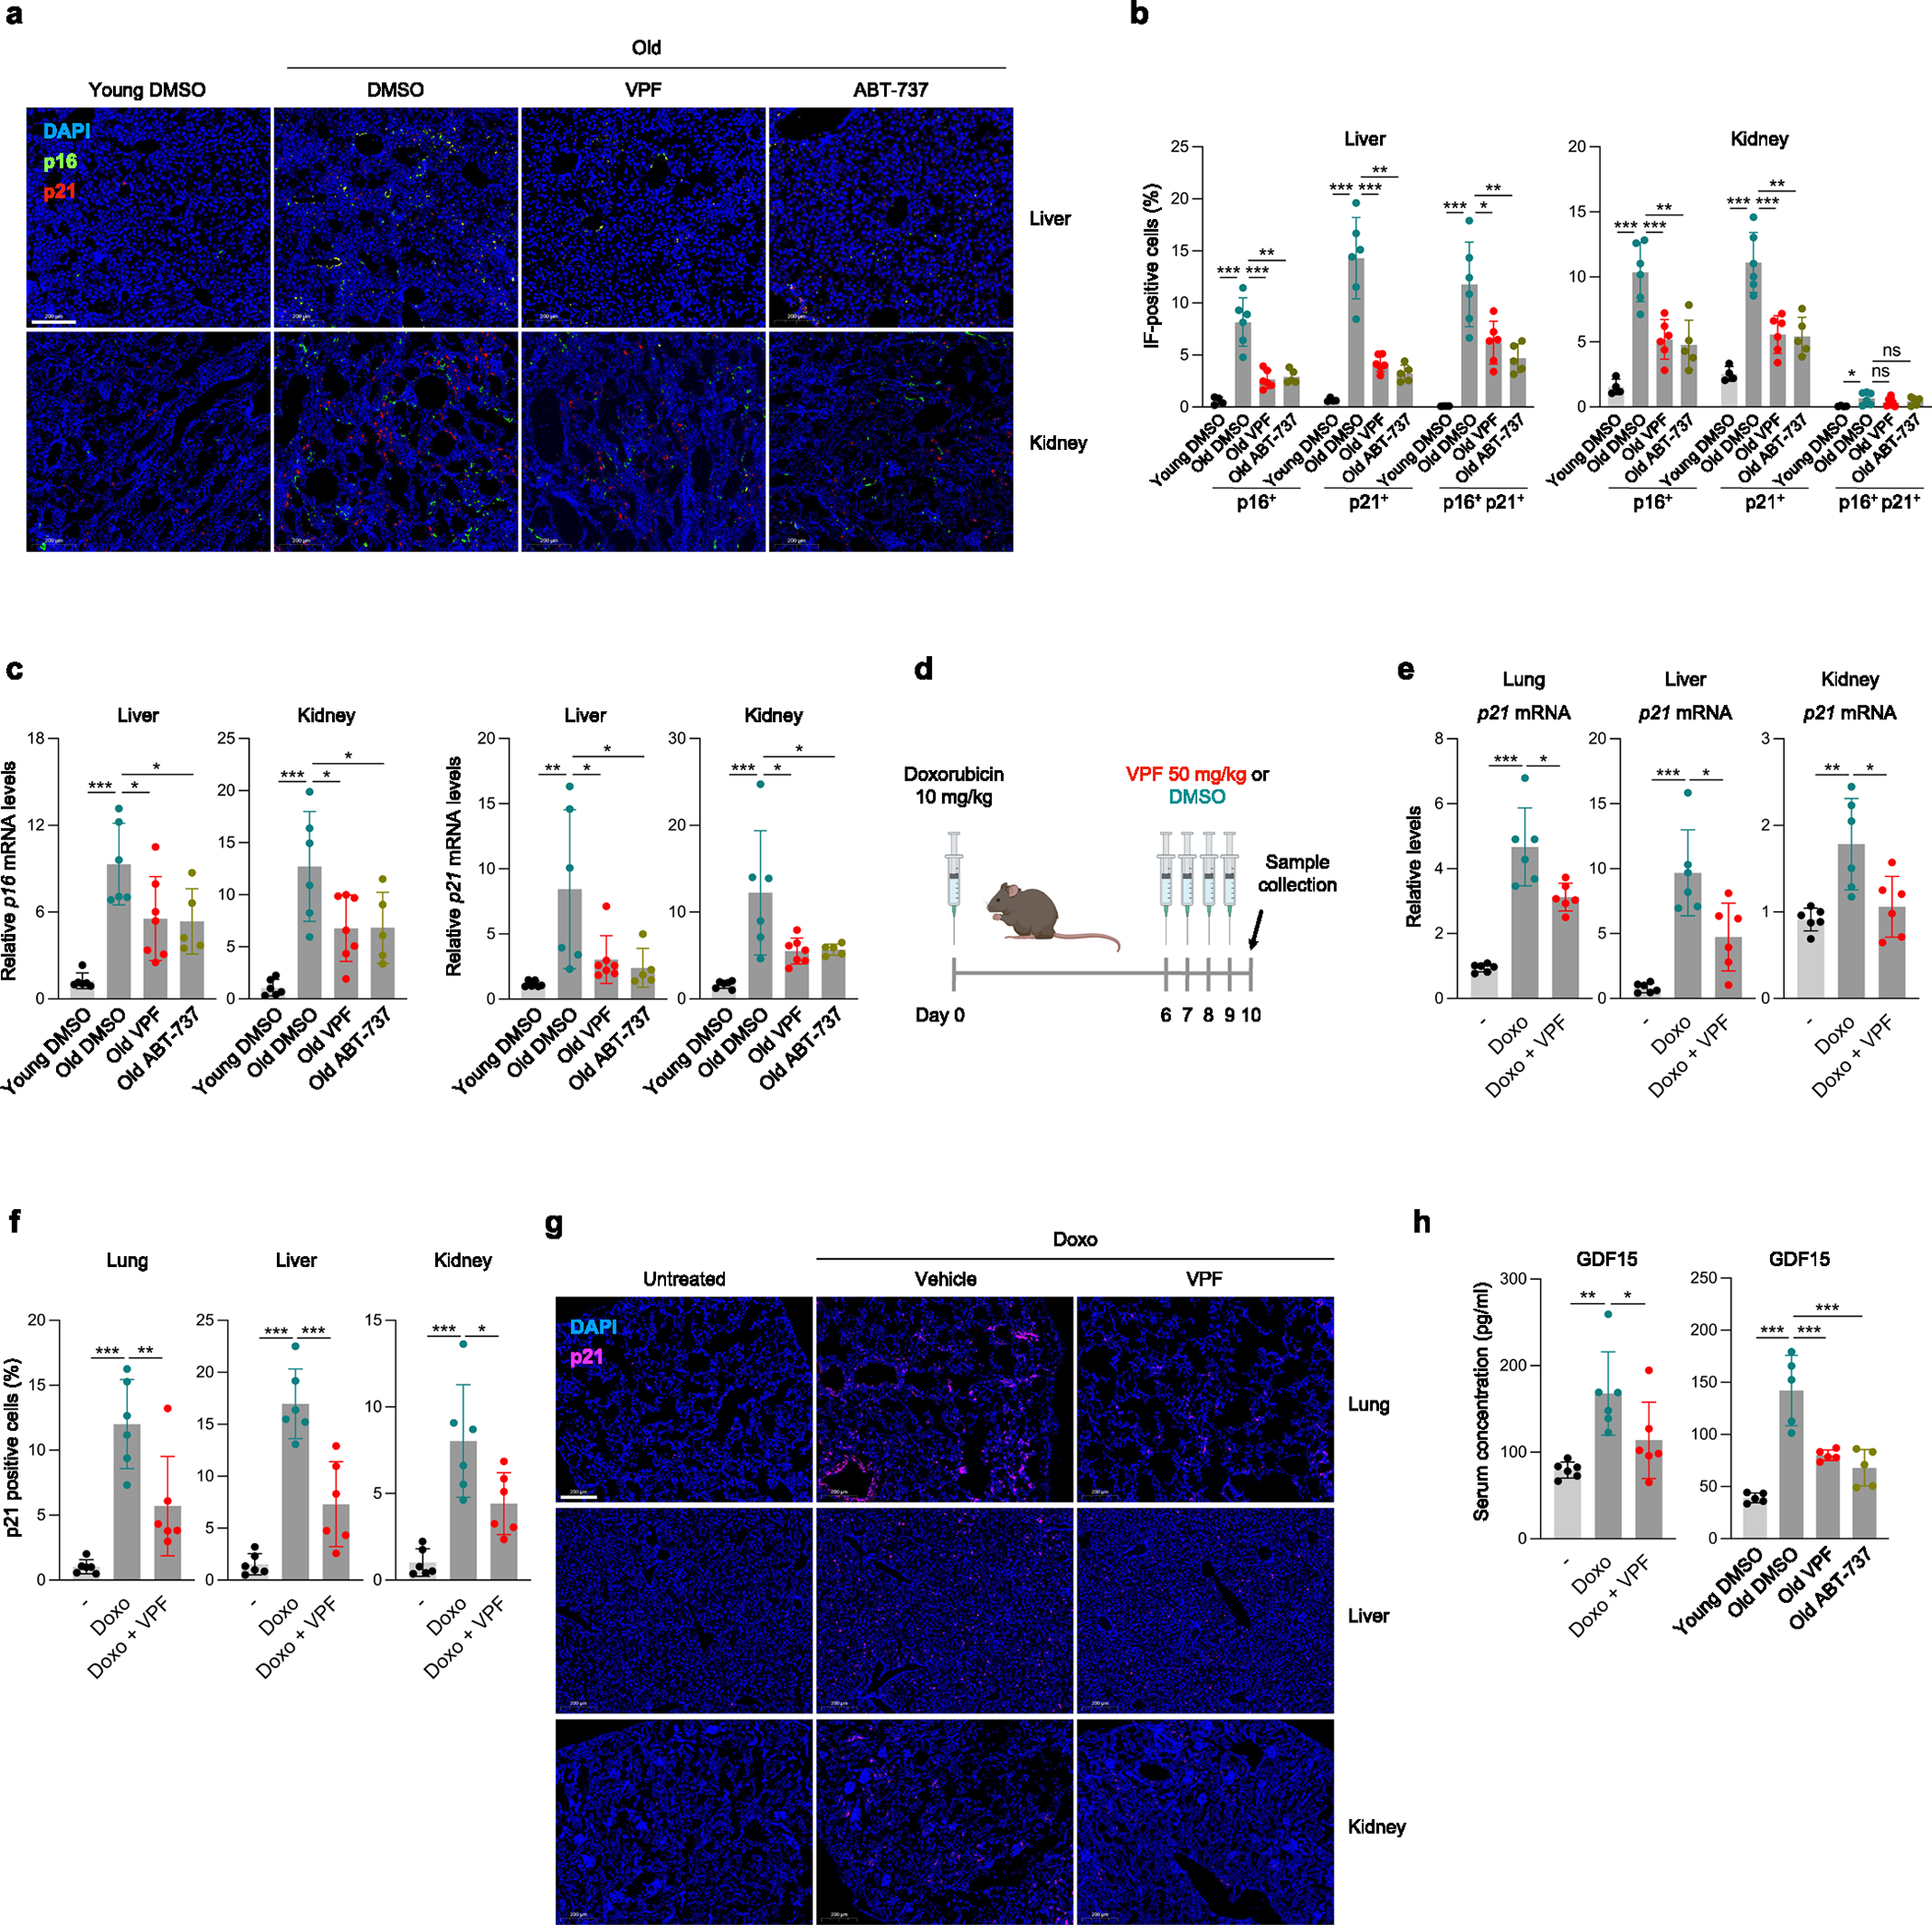
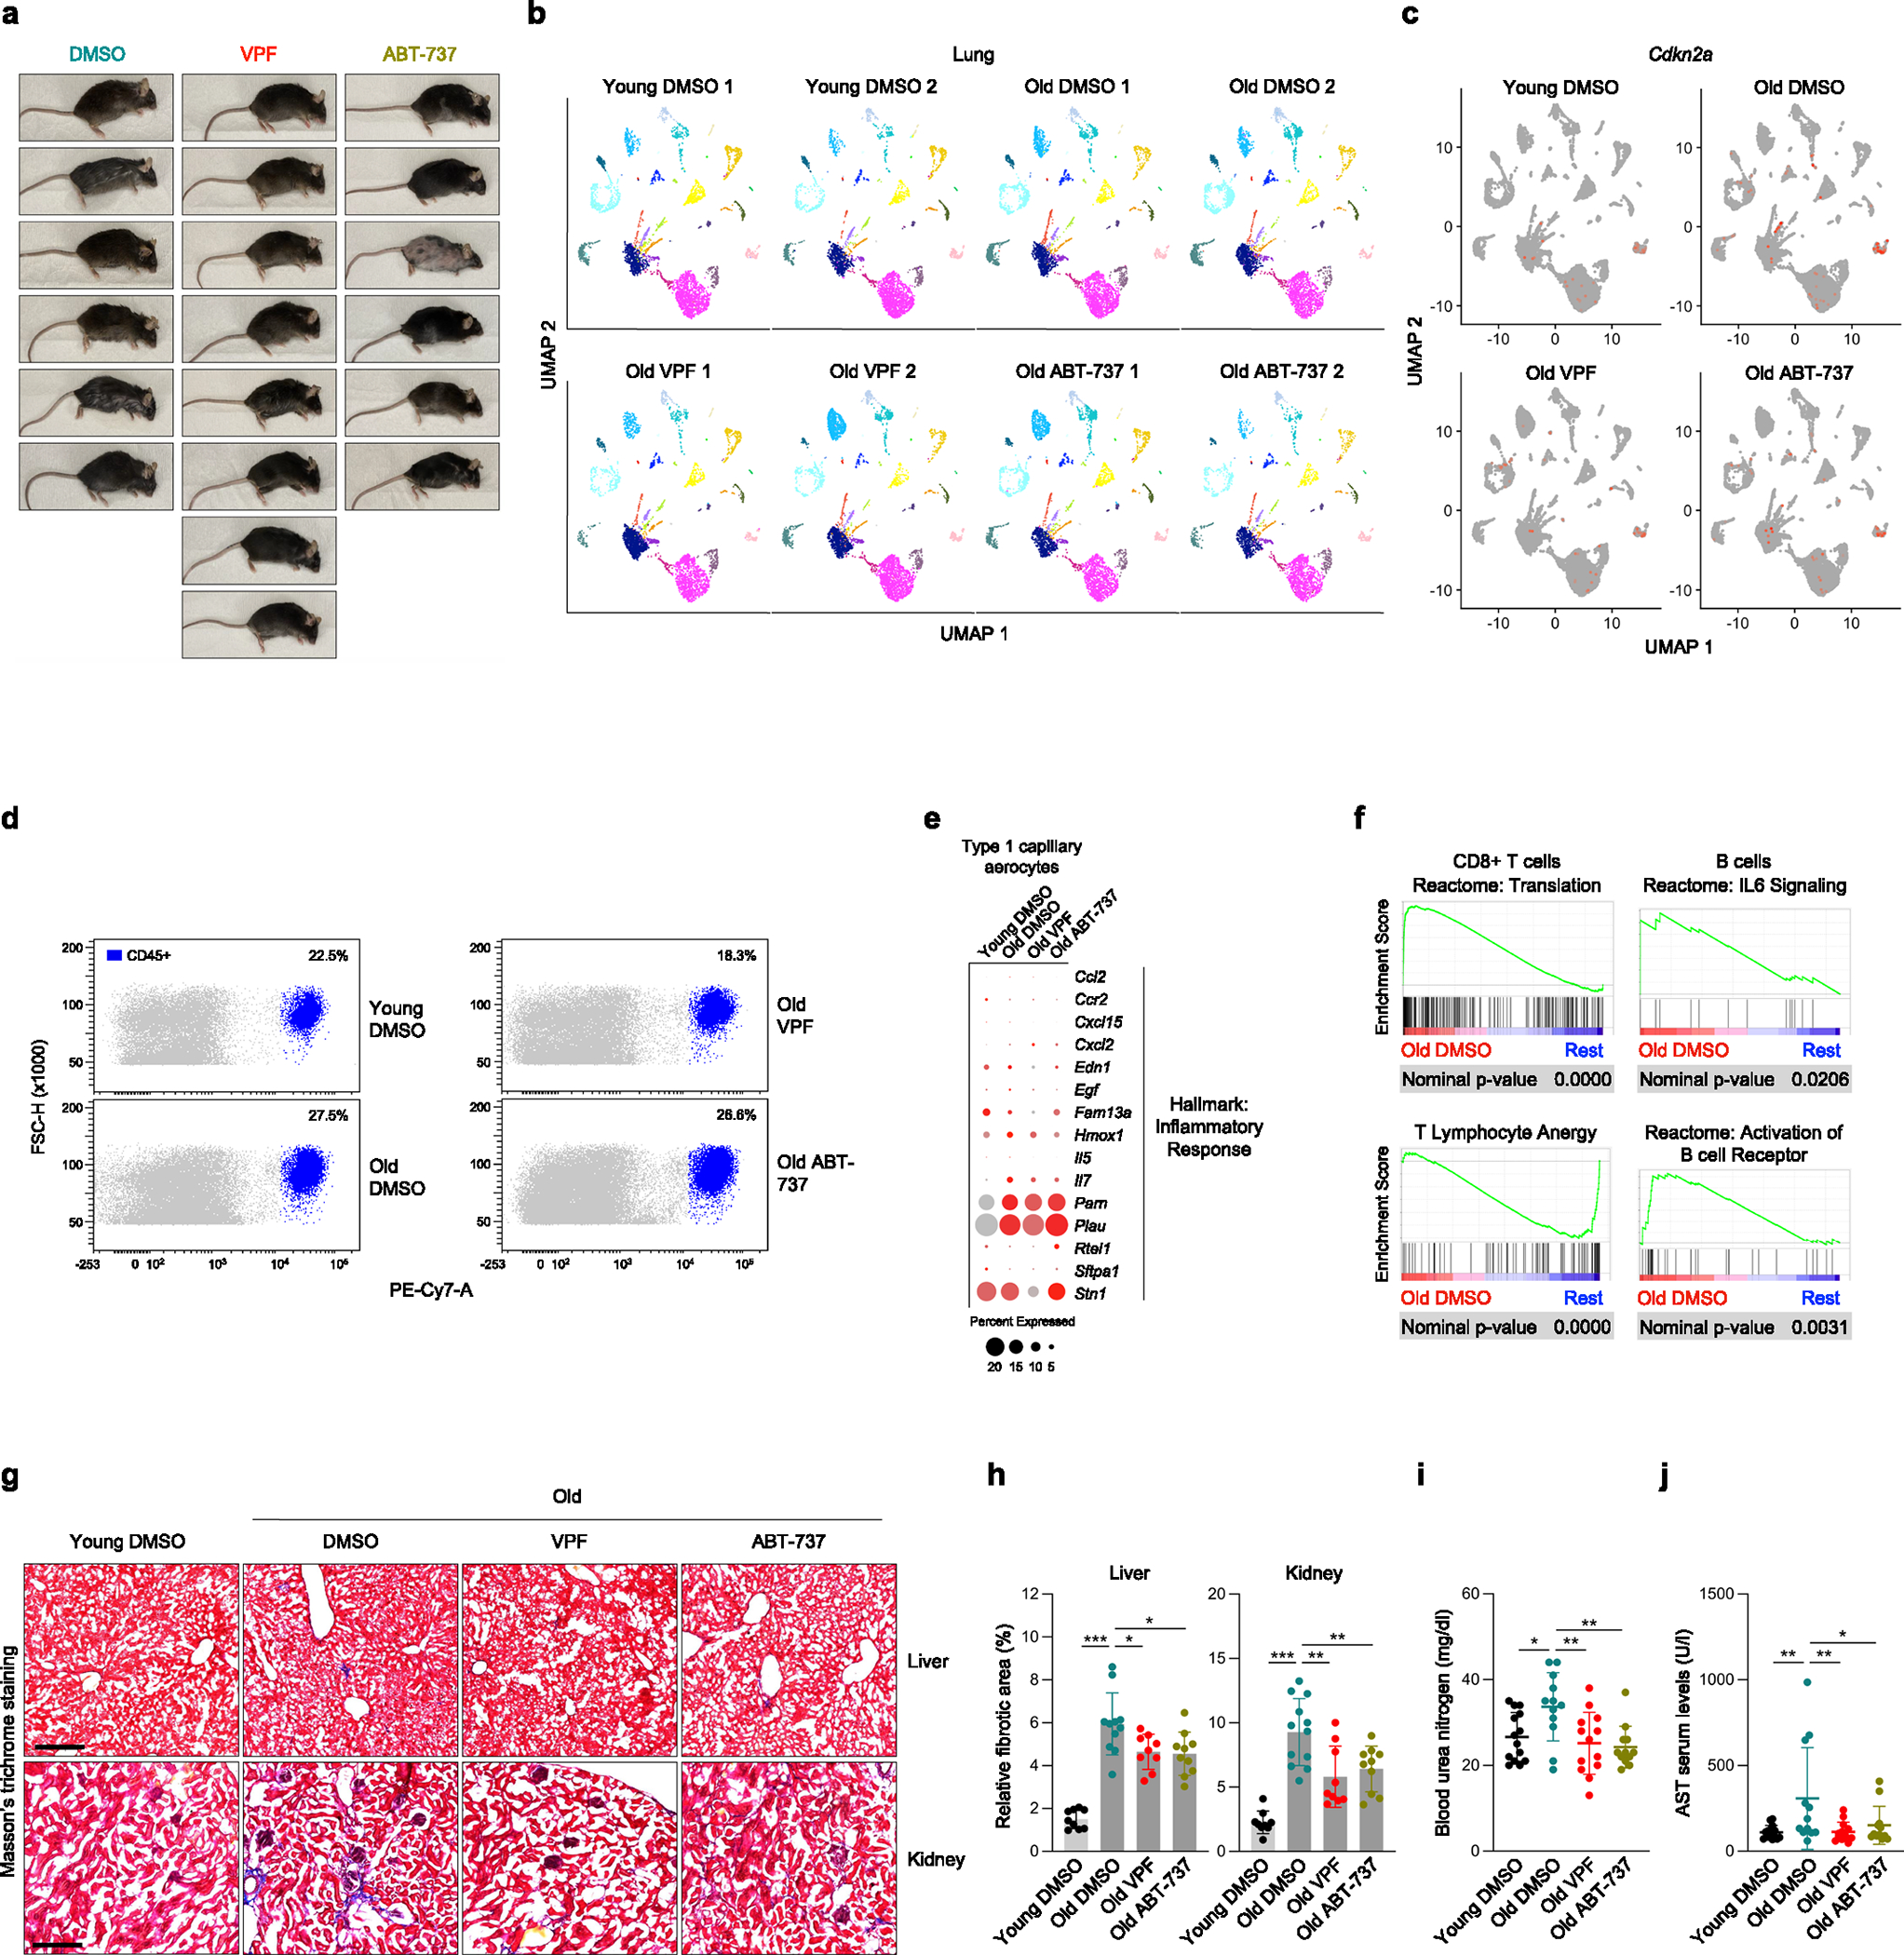
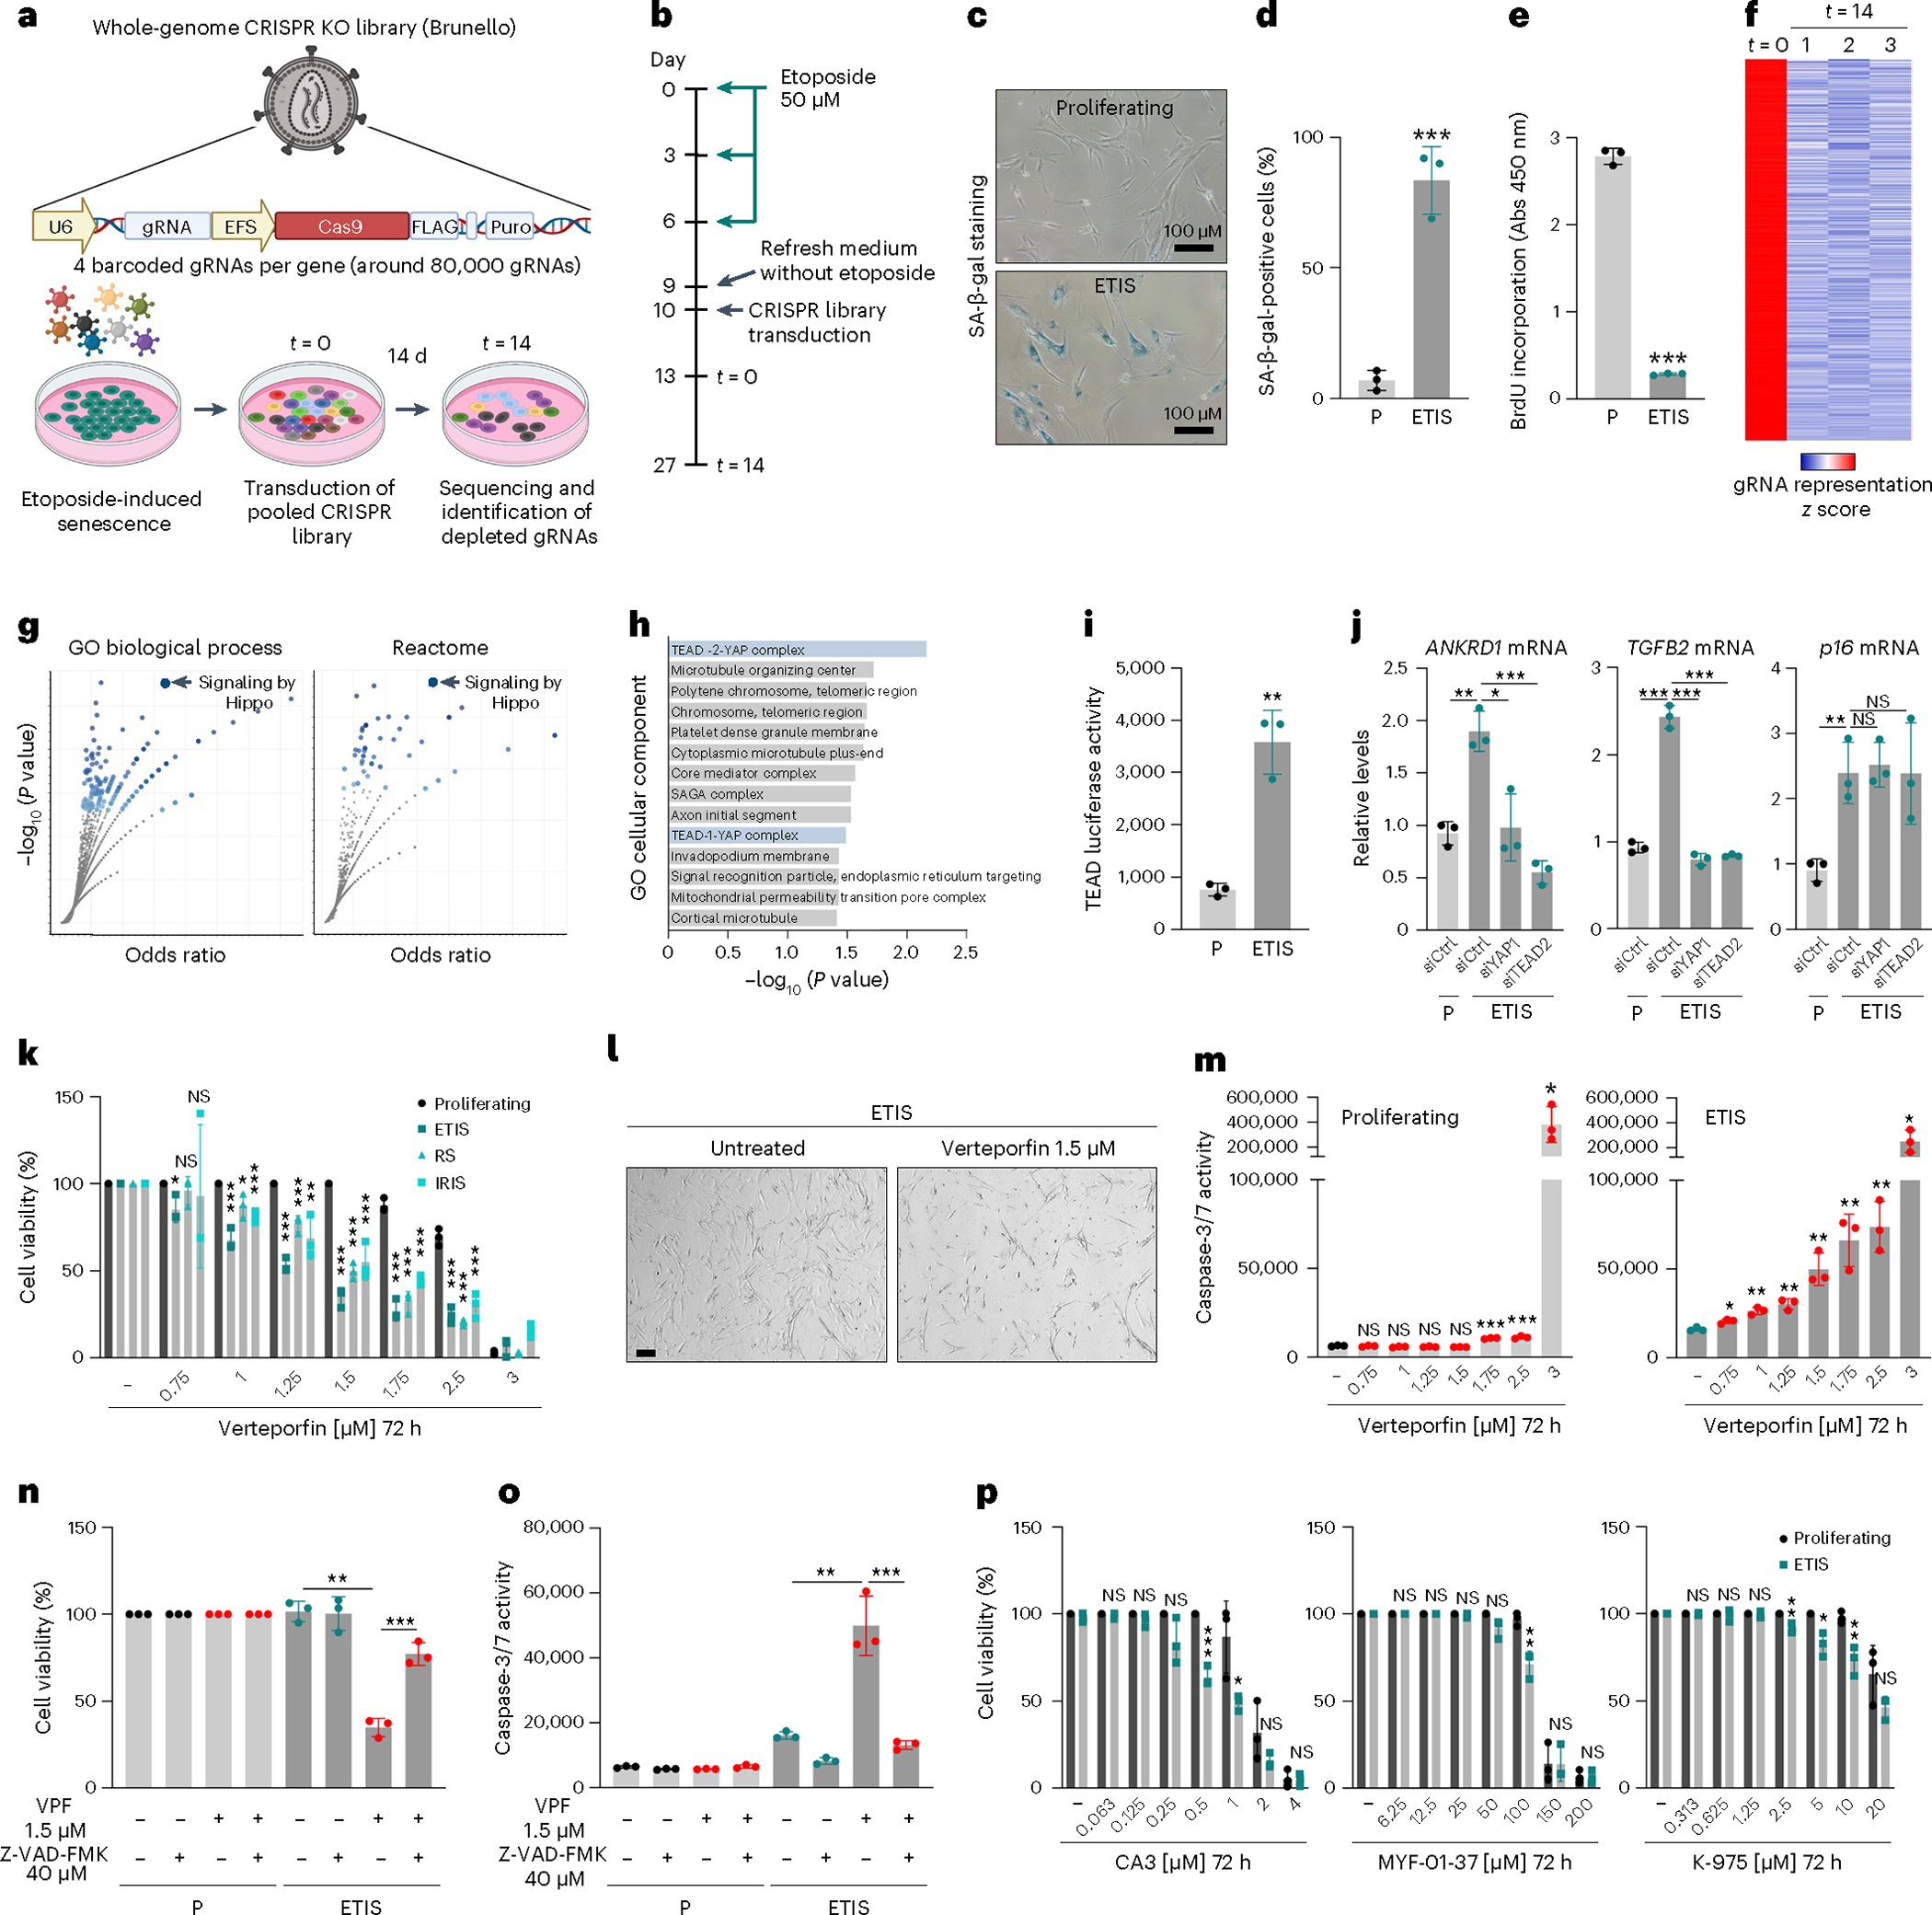
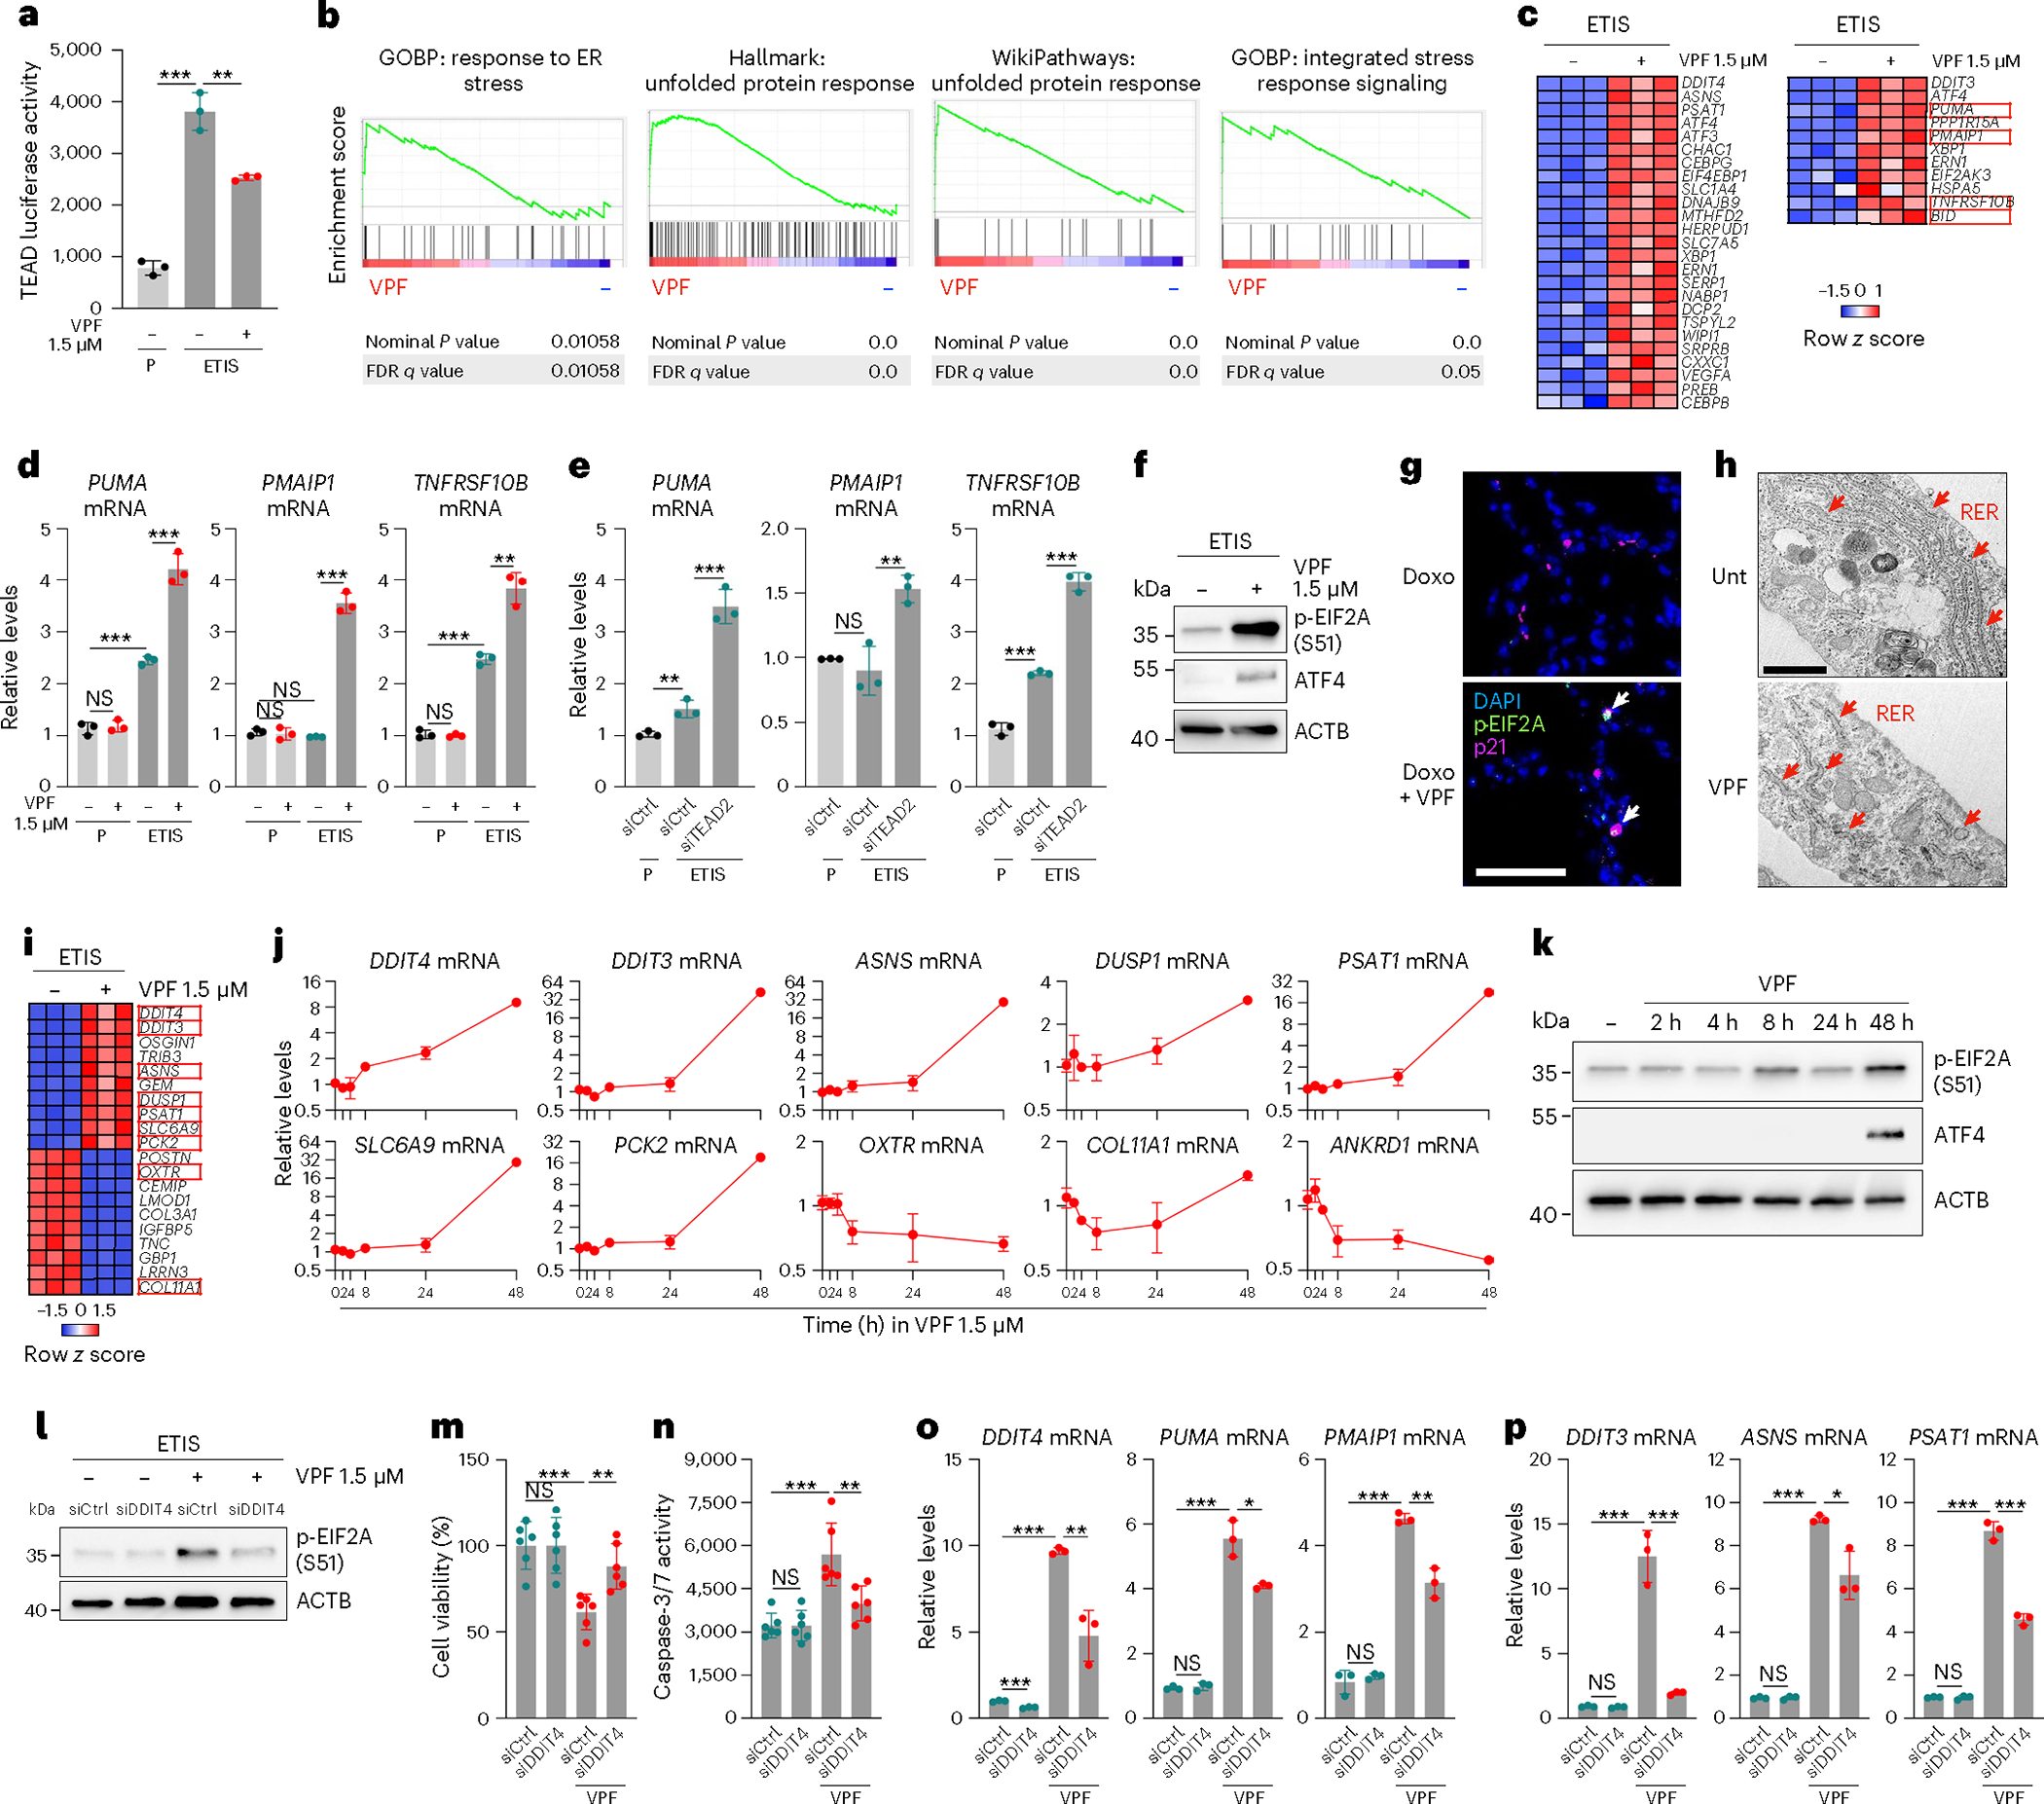
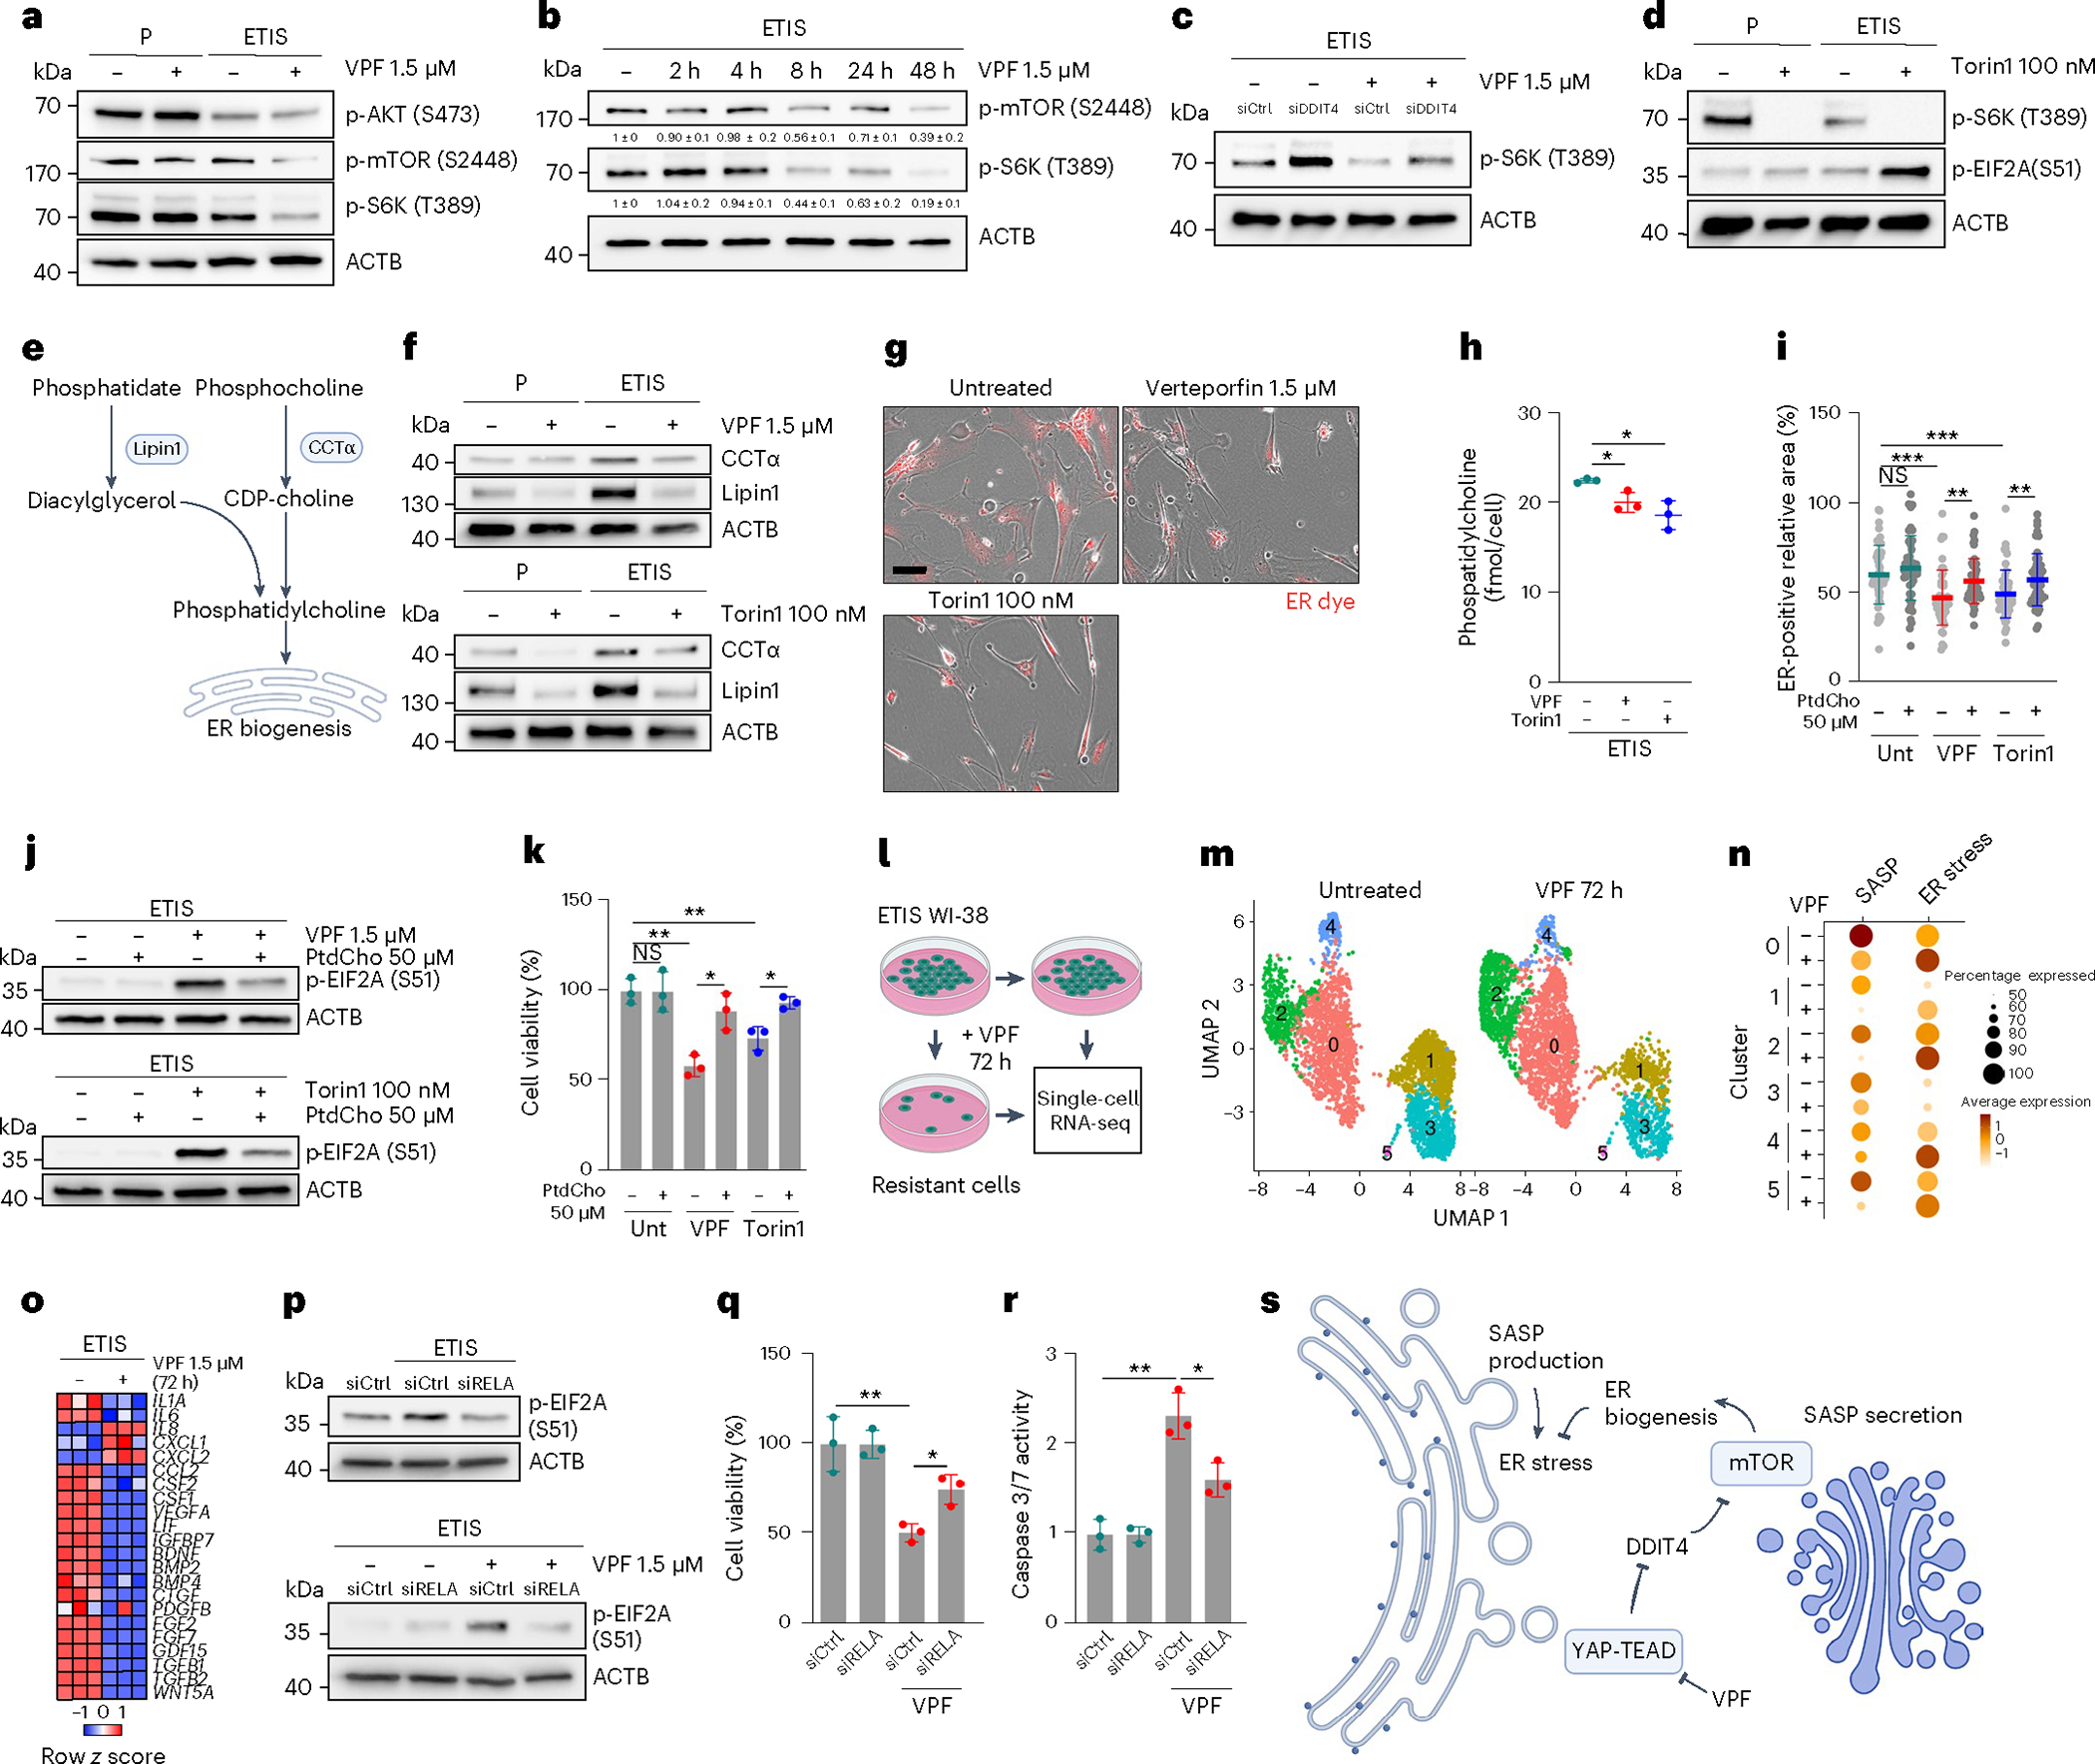
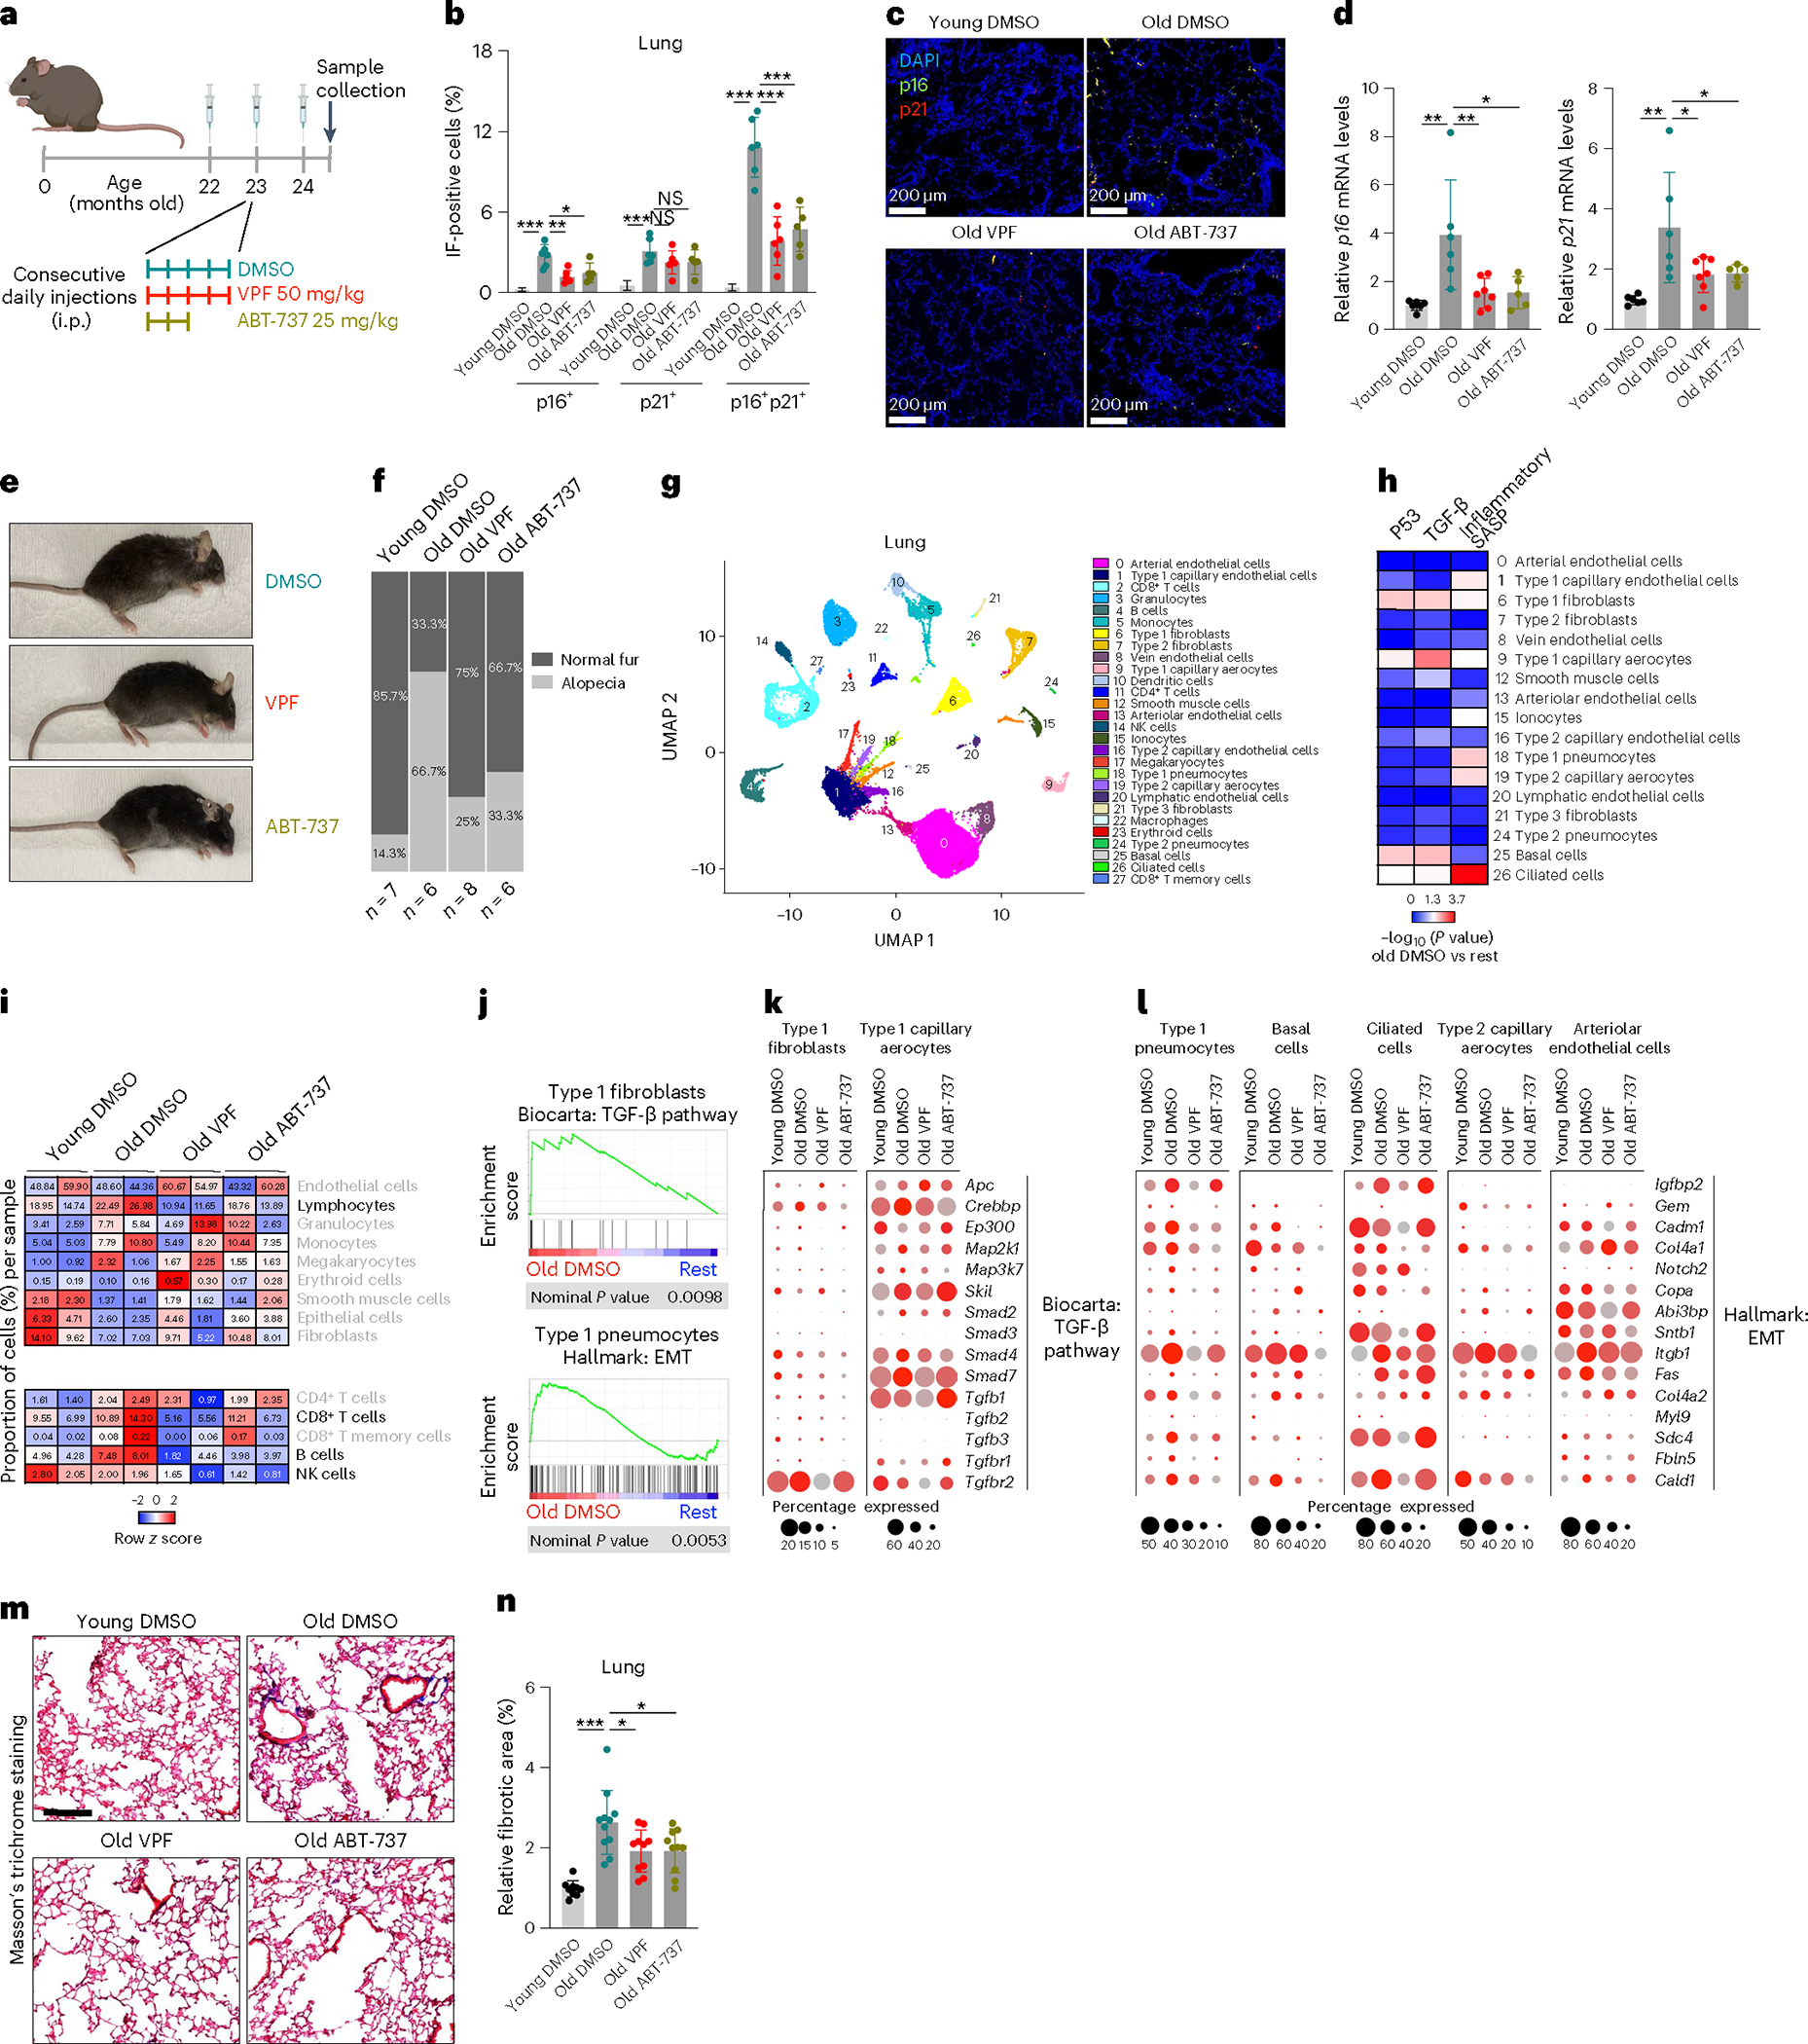
Sublethal cell damage can trigger senescence, a complex adaptive program characterized by growth arrest, resistance to apoptosis and a senescence-associated secretory phenotype (SASP). Here, a whole-genome CRISPR knockout screen revealed that proteins in the YAP-TEAD pathway influenced senescent cell viability. Accordingly, treating senescent cells with a drug that inhibited this pathway, verteporfin (VPF), selectively triggered apoptotic cell death largely by derepressing DDIT4, which in turn inhibited mTOR. Reducing mTOR function in senescent cells diminished endoplasmic reticulum (ER) biogenesis, triggering ER stress and apoptosis due to high demands on ER function by the SASP. Importantly, VPF treatment decreased the numbers of senescent cells in the organs of old mice and mice exhibiting doxorubicin-induced senescence. Moreover, VPF treatment reduced immune cell infiltration and pro-fibrotic transforming growth factor-β signaling in aging mouse lungs, improving tissue homeostasis. We present an alternative senolytic strategy that eliminates senescent cells by hindering ER activity required for SASP production.


Conflict of interest statement

Competing interests

The authors declare no competing interests.

Figures

Extended Data Fig. 1 |
Extended Data Fig. 1 |. CRISPR screen optimization, validation, and YAP-TEAD inhibition in other senescence models.
a, Cell viability assessment by direct cell counting of senescent WI-38 cells treated with puromycin (1 μg/ml, 48 h) 72 h after being transduced with the Brunello library at the indicated MOIs. The gray bars represent the expected viability if the transduction efficiency was complete while the teal bars represent the viability observed for each of the MOIs after puromycin treatment. b, Cell viability as assessed by direct cell counting of WI-38 cells transfected with the indicated siRNAs and rendered senescent after treatment with etoposide for 6 days (ETIS). c, Analysis of the levels of the indicated mRNAs in proliferating (P) or ETIS WI-38 cells transfected with the indicated siRNAs 24 h before either treatment with etoposide (50 μM) or no treatment, and culture for an additional 6 days. d, Representative western blot analysis (n = 3 independent experiments) of the levels of phosphorylated YAP (S127), YAP, phosphorylated MOB1 (T35), MOB1, and ACTB levels at the indicated conditions. e, f, Analysis of BrdU incorporation (e) and SA-β-Gal staining (f) in the indicated cell types, rendered senescent by etoposide (ETIS), ionizing radiation (IRIS), or replicative exhaustion (RS). Scale bar 100 μm. g, Caspase 3/7 activity measured in RS and IRIS WI-38 cells treated for 72 h with the indicated doses of Verteporfin (VPF). h, i, Cell viability as assessed by direct cell counting (h) and Caspase 3/7 activity measurement (i) for the indicated models of senescence along with proliferating controls, after either no treatment or treatment with VPF for 72 h at the indicated doses. Graphs in (b, c, e, gi) represent the means and each individual value as a dot ±s.d. n = 3 independent replicates; significance (*P < 0.05, **P < 0.01, ***P < 0.001) was determined using two-tailed Student’s t-test. Unless indicated, statistical tests were performed relative to untreated or proliferating controls.
Extended Data Fig. 2 |
Extended Data Fig. 2 |. Extended analysis of YAP-TEAD inhibition.
a, b, Representative western blot analysis (a) and quantification (b) of the levels of YAP and TEAD proteins after immunoprecipitation experiments with the indicated antibodies (IgG or anti-TEAD) in ETIS WI-38 fibroblasts that were either untreated or treated with VPF for 48 h. IgG bands are indicated with arrows placed on the left side of the panel. Inputs are also included. c, Heat map displaying the differential expression of the YAP–TEAD-dependent transcripts (by row Z-Score) in the conditions described in (a). Proliferating untreated cells were included as a baseline control. d, GSEA of the association (enrichment score) with the gene set ‘YAP1_up’ of ETIS WI-38 cells treated with VPF (48 h) compared to untreated senescent cells (−). e, RT-qPCR analysis of the levels of ANKRD1 and TGFB2 mRNAs in ETIS WI-38 cells after treatment for 48 h with the indicated YAP–TEAD inhibitors. Untreated controls were also included for comparison. f, Heat map representing the differential expression (Row Z-Score) among the conditions described in (e) for the indicated transcripts. g, Heat map displaying the differential expression (Row Z-Score) of the indicated transcripts in siCtrl and siTEAD2 ETIS WI-38 cells. h, GSEA of the association with the gene set ‘Hallmark: Epithelial-Mesenchymal Transition’ for the conditions described in (d). i, RT-qPCR analysis of the indicated pro-apoptotic mRNAs for the conditions described in (e). j, Representative Western blot (n = 3 independent experiments) of the levels of ATF6, XBP1s, and loading control ACTB for the conditions described in (d). k, GSEA plot showing the association (enrichment score) of the gene set ‘GOBP: PERK-mediated UPR’ with the conditions described in (d). l, Western blot analysis of the levels of phosphorylated EIF2A (S51) and loading control ACTB in WI-38 cells transfected with siCtrl or siPERK, rendered senescent with etoposide (ETIS) and then either left untreated or treated with 1.5 μM VPF for 48 h. m, n, Cell viability assessment by direct cell counting (m) and RT-qPCR analysis of PERK mRNA levels (n) in the conditions described in (l), but here treated with VPF for 72 h. o, p, Maximal cisternae thickness (o) and disorganization score (p) as measured by TEM in the groups described in (c). Thirty cells were analyzed for each condition. q, RT-qPCR analysis of the indicated transcripts either untreated or treated with 1.5 μM VPF for 8 h. r, Relative binding to the regulatory region of the DDIT4 gene or a negative control (Neg Ctrl) DNA in YAP ChIP samples of ETIS WI-38 cells that were untreated or treated with 1.5 μM VPF (48 h). s, RT-qPCR analysis of the levels of DDIT4 and p53 mRNAs in WI-38 cells transfected with the indicated siRNAs, rendered senescent with etoposide (ETIS) and either left untreated or treated with 1.5 μM VPF for 48 h. Proliferating WI-38 cells transfected with siCtrl were included as controls. Graphs in (b, e, i, m, n, qs) display the means and the individual values as dots ±SD n = 3 independent replicates; graphs in (o, p) show the means and the individual values as dots ±s.d. of n = 30 different cells. Significance (*P < 0.05, **P < 0.01, ***P < 0.001) was calculated using two-tailed Student’s t-test.
Extended Data Fig. 3 |
Extended Data Fig. 3 |. Analysis of mTOR inhibition and VPF treatment on ER stress in senescent cells.
a, Cell viability as assessed by direct cell counting of proliferating (P) or ETIS WI-38 fibroblasts that were either left untreated or treated with 100 nM Torin1 for 72 h. b, Representative micrographs showing the differences in viability in the conditions from (a). Scale bar, 100 μm. c, Western blot analysis of the levels of ATF6, XBP1s, and ACTB in the conditions described in (a), at 48 h instead. d, RT-qPCR analysis of the levels of PUMA, PMAIP1, and TNFRSF10B mRNAs in the conditions described in (c). Untreated P cells were included as baseline controls. e, Direct cell counting after treating as indicated for 72 h (1.5 μM VPF, 100 nM Torin1, or both) in ETIS WI-38 cells. f, RT-qPCR analysis of the indicated transcripts for the treatments described in (e), in this case for 48 h. g, Dot plot representation of the values calculated for the ER-positive relative area per cell (60 cells per condition) in ETIS WI-38 cells either untreated or treated with VPF (1.5 μM) or Torin1 (100 nM) for 48 h. h, Micrographs showing the areas corresponding to the endoplasmic reticulum (ER) in red for the indicated treatments as in (g). Phosphatidylcholine (PtdCho) was simultaneously supplemented at 50 μM where indicated. Scale bar, 100 μm. i, Heat map representation of the differences in SASP mRNA levels represented by row Z-Score for the indicated transcripts when comparing the conditions described in (g). Untreated P WI-38 cells were included as baseline controls. j, Heat map of the row Z-Score calculated for the differences in the secretion of the indicated SASP members among the groups described in (g), including proliferating (P) WI-38 cells as a control for baseline secretion. k, UMAP plot representation of the scRNA-seq data from ETIS WI-38 cells (no VPF treatment) showing the expression score specified in the legends, associated with the indicated gene sets (SASP, a custom gene set of 132 markers; ER stress, GOBP: Response to ER stress; and Oxidative Phosphorylation, Hallmark: Oxidative Phosphorylation). l, Western blot analysis of phosphorylated EIF2A (S51) and ACTB levels in WI-38 cells transfected with the indicated siRNAs, rendered senescent by treatment with etoposide for 6 days, and then either left untreated or treated with 100 nM Torin1 for 48 h. m, Cell viability measurement by direct cell counting of the conditions described in (l), here treated for 72 h. n, o, RT-qPCR analysis (n) and Bioplex analysis of the conditioned media (o) to assess SASP production and secretion in WI-38 cells transfected with siCtrl or siRELA, and rendered senescent with etoposide for 6 days. Proliferating controls transfected with siCtrl siRNA were included. Graphs in (a, df, m, n) represent the means and individual values (dots) of n = 3 independent replicates; plot in (g) shows the individual values of 20 different cells from each of the 3 independent replicates analyzed, making a total 60 individual values; Significance (*P < 0.05, **P < 0.01, ***P < 0.001) was calculated using two-tailed Student’s t-test.
Extended Data Fig. 4 |
Extended Data Fig. 4 |. Analysis of senescence markers in naturally aged and doxorubicin-treated mice.
a Representative immunofluorescence images of p21 (red) and p16 (green) in mouse liver and kidney from the groups described in Fig. 4a. Scale bar (white), 200 μm. b, Quantification of the percentage of p16-positive, p21-positive, or p16/p21 double-positive cells in the liver and kidney samples represented in (a). c, RT-qPCR analysis of p16 and p21 mRNA levels (normalized to Actb mRNA) in liver and kidney for the conditions described in Fig. 4a. d, Schematic representation of the treatment regimen carried out to trigger doxorubicin-induced senescence in vivo in mice (10 mg/kg), along with 4 consecutive treatments with DMSO (Vehicle) or VPF (50 mg/kg) from day 6 onward. Samples were collected at day 10 after doxorubicin treatment. e, RT-qPCR analysis of p21 mRNA levels in lung, liver, and kidney from the groups described in (d). Untreated mice were included as baseline controls. f, g, Quantification (f) and representative images (g) of p21 immunofluorescence in the conditions described in (d). Scale bar (white), 200 μm. h, Serum measurement of GDF15 levels for the experimental groups described in (d, left, and Fig. 4a, right). Graphs in (b, c) display the means and the individual values as dots ± s.d. of the included mice (more details in Supplementary Table 6), while graphs in (e, f, h) display the means and the individual values as dots ± s.d. of n = 6 mice per group; significance (*P < 0.05, **P < 0.01, ***P < 0.001) was calculated using one-way ANOVA.
Extended Data Fig. 5 |
Extended Data Fig. 5 |. Physiological benefits of senolytic ABT-737 and VPF treatments in naturally aged mice.
a, Pictures of the 24 m.o. mice from the different groups described in Fig. 4a at the end of the experiment. b, UMAP clustering of the scRNA-seq performed in lungs from the indicated groups. c, Feature plot displaying Cdkn2a mRNA expression in the indicated experimental groups. Each plot was obtained by merging the two samples sequenced for each experimental group, shown in (b). d, Plots displaying the signals obtained through flow cytometry analysis of single-cell lung suspensions from the indicated groups. FSC-H axis represents the signals obtained for the forward scatter, while the PE-Cy7-A axis corresponds to CD45 staining with such fluorophore. Cells considered CD45+ are colored in blue, and the percentages are specified on the top right corner of each box. e, Dot plot displaying the association of the indicated cell types and conditions with the top 15 transcripts from Hallmark: Inflammatory Response gene set. The size of the dots represents the percentage of cells expressing such transcript while the intensity of red indicates the relative expression value. f, GSEA plots displaying the association of the indicated cell types from Old DMSO condition (compared to the rest of the experimental groups) with the indicated gene sets (Reactome: Translation; Safford T Lymphocyte Anergy; Reactome: Interleukin 6 Family Signaling; Reactome: Antigen Activates B cell Receptor BCR Leading To Generation Of Second Messengers). g, h, Masson’s trichrome (MTC) staining performed in liver and kidney from the indicated groups, representative images of MTC staining (g) in blue, and quantification of the blue area present at each sample divided by the total area in red (h). Scale bar, 200 μm. i, j, Serum analysis of blood urea nitrogen (i) and AST (j) levels for the indicated experimental groups. Plots in (hj) represent the means and the individual values as dots ± s.d. of the included mice (more details in Supplementary Table 6); significance (*P < 0.05, **P < 0.01, ***P < 0.001) was calculated using one-way ANOVA.
Fig. 1 |
Fig. 1 |. CRISPR screen identifies YAP–TEAD pathway as essential for senescent cell viability.
a,b, CRISPR screen performed on ETIS WI-38 fibroblasts (a), including timeline of treatments and procedures (b). c,d, Representative images of SA-β-gal staining (c) and quantification (d) in proliferating (P) and ETIS WI-38 cells. Scale bar, 100 μm. e, BrdU assay performed in the conditions described in c. Abs, absorbance. f, Heat map representation of z scores of gRNAs significantly reduced when comparing t = 14 to t = 0 (Supplementary Table 1). g, Analysis of gRNAs depleted from the t = 14 experimental groups (Methods) with Enrichr (Supplementary Table 2). Dot plots show the combined score (y and x axes) of ‘Signaling by Hippo’ categories from GO and Reactome databases. For each category (dots present in the plot), the y axis represents −log10(P value) and the x axis represents odds ratios. h, Bar plot showing combined scores of GO database ‘Cellular component’ obtained by Enrichr analysis of the conditions described in g. i, Luciferase activity of a TEAD reporter construct analyzed for the indicated experimental groups. j, RT–qPCR analysis of the indicated mRNAs in ETIS WI-38 cells transfected with siCtrl, siYAP1 or siTEAD2; 24 h later, cells were treated with etoposide (50 μM, 8 d). Proliferating cells transfected with siCtrl were included as controls. k, Cell viability analysis by direct cell counting after treating with the indicated VPF doses (72-h treatments). WI-38 fibroblasts were proliferating or rendered senescent by ETIS, RS or IRIS. l, Representative micrographs of ETIS WI-38 cells that were either untreated or treated with VPF (1.5 μM, 72 h). Scale bar, 100 μm. m, Caspase-3/caspase-7 activity measurement in either proliferating or ETIS WI-38 cells treated with the indicated doses of VPF for 72 h. n,o, Cell viability evaluation by direct cell counting (n) and caspase-3/7 activity measurement (o) in proliferating and ETIS WI-38 cells treated with VPF for 72 h; apoptosis was rescued by simultaneous treatment with Z-VAD-FMK where indicated. p, Cell viability analysis by direct cell counting of either proliferating or ETIS WI-38 cells with the indicated doses of YAP–TEAD inhibitors for 72 h. Graphs in d, e, ik and mp display the means and each individual value as a dot ± s.d. of n = 3 independent replicates; significance (*P < 0.05, **P < 0.01, ***P < 0.001) was determined using two-tailed Student’s t-test. Unless indicated, statistical tests were performed relative to untreated or proliferating controls. See also Extended Data Fig. 1. NS, not significant.
Fig. 2 |
Fig. 2 |. YAP–TEAD inhibition triggers apoptosis by derepressing DDIT4, causing endoplasmic reticulum stress.
a,b, Luciferase activity from the TEAD promoter as measured in ETIS WI-38 cells treated with VPF (1.5 μM, 48 h) or untreated; control proliferating (P) cells (a) and GSEA of RNA-seq data from ETIS WI-38 cells (VPF relative to control untreated) (b). Shown are transcriptomes associated with VPF-treated versus untreated ETIS WI-38 cells; FDR, false discovery rate; GOBP, GO Biological Process. c, Heat map displaying the levels of each transcript in the GSEA gene sets shown in b (Hallmark: UPR, left; WikiPathways: UPR, right). Red boxes indicate mRNAs encoding pro-apoptotic proteins. d, RT–qPCR analysis of the indicated transcripts in P and ETIS WI-38 cells treated as in a. e, RT–qPCR quantification of the indicated transcripts in ETIS WI-38 cells transfected with siCtrl or siTEAD2 1 d before inducing senescence. Proliferating WI-38 cells transfected with siCtrl were included as controls. f, Representative western blot analysis (n = 3 independent experiments) of the indicated proteins in WI-38 cells treated as in b. g, Representative immunofluorescence micrographs from lungs of mice (n = 6) that were injected with doxorubicin 10 d earlier, then treated daily for 4 d with either DMSO or VPF (50 mg per kg body weight) from day 6 onward (Extended Data Fig. 4a). Cells were stained to visualize nuclei (DAPI, blue), phosphorylated EIF2A (S51; green) and p21 (purple); white arrows point to double-stained cells. Scale bar, 50 μm. h, Representative images of TEM of ETIS WI-38 cells treated with VPF as in a, along with untreated controls (Unt). Red arrows point to rough endoplasmic reticulum (RER). Scale bar, 1 μm. i, Heat map displaying the row z score of each of the transcripts indicated (top 10 increased and decreased in VPF-treated versus untreated ETIS WI-38 cells) between conditions. Red boxes denote mRNAs transcriptionally regulated by YAP–TEAD complex and involved in the ER stress response. j, RT–qPCR analysis of YAP–TEAD target mRNAs at the indicated times after treating ETIS WI-38 cells with 1.5 μM VPF. k, Western blot analysis (n = 3) of the indicated proteins in cells treated as in j. l, Western blot analysis (n = 3) of the indicated proteins in ETIS WI-38 cells transfected with the indicated short interfering RNAs (siRNAs), then treated or not with VPF (1.5 μM, 48 h). m,n, Cell viability assessments by direct cell counting (m) and caspase-3/caspase-7 activity (n) for the groups in l, although treated for 72 h instead. o,p, RT–qPCR analysis of mRNAs in the experimental groups in l. Graphs in a, d,e,j,o and p show each individual value as a dot and the means ± s.d. of n = 3 independent replicates; graphs in m and n show each individual value as a dot and the means ± s.d. of n = 6 independent replicates; significance (*P < 0.05, **P < 0.01, ***P < 0.001) was calculated by performing two-tailed Student’s t-test. See also Extended Data Fig. 2.
Fig. 3 |
Fig. 3 |. Inhibition of mTOR-dependent endoplasmic reticulum biogenesis by DDIT4 induces endoplasmic reticulum stress and senolysis.
a, Western blot analysis (n = 3) of the indicated proteins in proliferating (P) or ETIS WI-38 cells, treated or not with VPF (1.5 μM, 48 h), starting at day 6 of etoposide treatment. b, Western blot analysis (n = 3) of the indicated proteins at different times after treatment with 1.5 μM VPF. Normalized phosphorylation values (p-mTOR or p-p70 S6K/ACTB) below each lane were calculated (means ± s.d.) relative to untreated controls. c, Western blot analysis (n = 3) of the indicated proteins in ETIS WI-38 cells transfected with siCtrl or siDDIT4 and treated with VPF (1.5 μM, 48 h) or not. d, Western blot analysis (n = 3) of the indicated proteins in P and ETIS WI-38 cells 48 h after treatment with Torin1 (100 nM) or no treatment. e, Schematic depicting mTOR-regulated enzymes lipin-1 and CCTα, regulators of PtdCho biosynthesis and ER biogenesis. f, Western blot analysis (n = 3) of the specified proteins after treatment of P or ETIS WI-38 cells, with 1.5 μM VPF or 100 nM Torin1 for 48 h, as in a and d. g, Micrographs depicting the relative ER area stained with ER tracker (red) in ETIS WI-38 cells that were either untreated or treated with 1.5 μM VPF or 100 nM Torin1 for 48 h. Scale bar, 100 μm. h, Dot plot representation of the levels of PtdCho (fmol per cell) as measured in the conditions described in g. i, Dot plot representation of ER-positive areas per cell for the experimental groups in g; each treatment was simultaneously supplemented with 50 μM PtdCho. j, Western blot analysis (n = 3) of the specified proteins with the indicated treatments performed for 48 h in ETIS WI-38 cells. k, Cell viability assessment by direct cell counting for the groups in i, although treated for 72 h. l,m, Experimental scheme to identify single-cell transcriptomic differences between ETIS WI-38 that were untreated or treated with VPF (1.5 μM, 72 h) to eliminate those cells most sensitive to VPF (l), and uniform manifold approximation and projection (UMAP) identification of six subgroups in ETIS WI-38 cells and ETIS WI-38 cells treated with VPF (1.5 μM, 72 h; m). n, Dot plot showing the association of transcriptome clusters described in m with ER stress (GOBP: response to ER stress), apoptosis (Hallmark: apoptosis) and SASP (custom gene set, 132 markers). Dot size, proportion of cells expressing transcripts in a gene set; dot color, scaled expression level. o, Heat map, levels of mRNAs for the conditions described in l. p, Western blot analysis (n = 3) of the indicated proteins in proliferating and ETIS WI-38 cells with the combinations of siRNAs and VPF (1.5 μM, 48 h) shown. siCtrl-transfected, proliferating controls were included. q,r, Cell viability assessment by direct cell counting (q) and caspase-3/caspase-7 activity measurement (r) in ETIS WI-38 cells for 72 h in the presence of the indicated siRNAs and VPF. s, Proposed model for YAP–TEAD support of senescent cell viability; see the main text for details. Graphs in h,i,k,q and r show each individual value as a dot and the means ± s.d. of n = 3 independent replicates; the graph in i shows individual values of 20 different cells from 3 independent replicates (total 60 individual values); significance (*P < 0.05, **P < 0.01, ***P < 0.001) was calculated using a two-tailed Student’s t-test. See also Extended Data Fig. 3.
Fig. 4 |
Fig. 4 |. VPF treatment reduces senescent cell burden in vivo.
a, Treatment regimens followed for each experimental group in this study (DMSO, 50 mg per kg body weight VPF and 25 mg per kg body weight ABT-737) in naturally aged mice. Young mice (3 months old) treated with one round of DMSO were included as controls. i.p., intraperitoneal. b,c, Quantification of percentages (b) and representative micrographs (c) of p16-positive, p21-positive or p16/p21 double-positive cells in lungs of the groups described in a. d, RT–qPCR analysis of the levels of p16 and p21 mRNAs (normalized to Actb mRNA) in lungs of mice described in a. e, Appearance of representative mice at the end of the study in the groups described in a. f, Quantification of alopecia incidence in the indicated groups. g, UMAP clustering of cells identified by scRNA-seq performed in lung samples from each of the conditions described in a. UMAP plots display all eight samples together; each sample alone can be viewed (Extended Data Fig. 5b). h, Heat map indicating the association score (−log10(P value)) of p53, TGF-β and inflammatory SASP transcriptomic signatures for the cell types identified in g, excluding hematopoietic clusters. i, Heat maps represent row z score and proportions of different cell types (percentage from total; op heat map) and lymphoid cell clusters (bottom heat map) identified by scRNA-seq analysis. j, GSEA association of the indicated cell types from ‘old DMSO’ (compared to the rest of the experimental groups) with the indicated gene sets (Biocarta: TGF-β pathway; Hallmark: ENT). k,l, Dot plot representations of associations between cell types and conditions with the top 15 transcripts from either Biocarta: TGF-β pathway (k) or Hallmark: EMT (l). Dot sizes represent percentages of cells expressing a transcript, while intensities of red indicate relative expression values. m,n, MTC staining of lung samples from c, with representative MTC staining (m) in blue and quantification of blue areas in each sample divided by total area in red (n). Scale bar, 200 μm. Data in b,d and n represent individual values as dots and the means ± s.d. of the mice studied (Supplementary Table 6); significance (*P < 0.05, **P < 0.01, ***P < 0.001) was calculated using one-way analysis of variance. See also Extended Data Figs. 4 and 5.

Comment in

Similar articles

Cited by

References

    1. Gorgoulis V et al. Cellular senescence: defining a path forward. Cell 179, 813–827 (2019). - PubMed
    1. Di Micco R, Krizhanovsky V, Baker D & d’Adda di Fagagna F Cellular senescence in ageing: from mechanisms to therapeutic opportunities. Nat. Rev. Mol. Cell Biol. 22, 75–95 (2021). - PMC - PubMed
    1. Gasek NS, Kuchel GA, Kirkland JL & Xu M Strategies for targeting senescent cells in human disease. Nat Aging 1, 870–879 (2021). - PMC - PubMed
    1. Baar MP et al. Targeted apoptosis of senescent cells restores tissue homeostasis in response to chemotoxicity and aging. Cell 169, 132–147 (2017). - PMC - PubMed
    1. Kirkland JL & Tchkonia T Senolytic drugs: from discovery to translation. J. Intern. Med. 288, 518–536 (2020). - PMC - PubMed

Publication types

Substances