. 2023 Sep 4;24(1):200.
doi: 10.1186/s13059-023-03043-3.

Pervasive under-dominance in gene expression underlying emergent growth trajectories in Arabidopsis thaliana hybrids

Affiliations

Pervasive under-dominance in gene expression underlying emergent growth trajectories in Arabidopsis thaliana hybrids

Wei Yuan et al. Genome Biol. .

Abstract

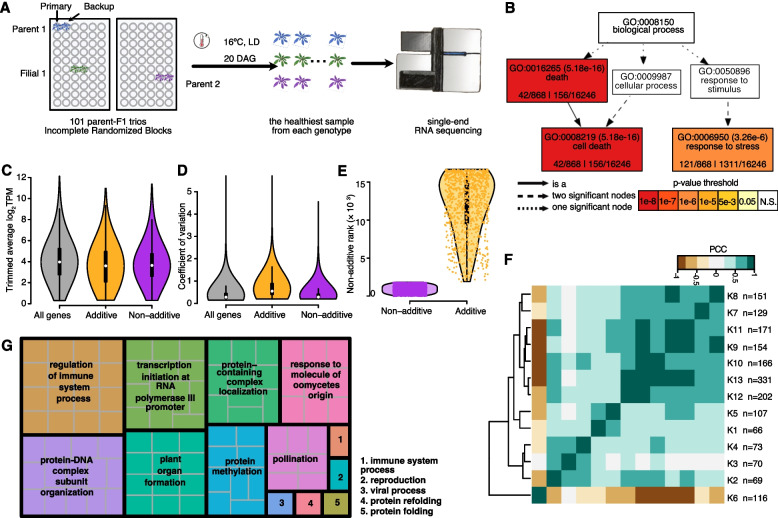
Background: Complex traits, such as growth and fitness, are typically controlled by a very large number of variants, which can interact in both additive and non-additive fashion. In an attempt to gauge the relative importance of both types of genetic interactions, we turn to hybrids, which provide a facile means for creating many novel allele combinations.

Results: We focus on the interaction between alleles of the same locus, i.e., dominance, and perform a transcriptomic study involving 141 random crosses between different accessions of the plant model species Arabidopsis thaliana. Additivity is rare, consistently observed for only about 300 genes enriched for roles in stress response and cell death. Regulatory rare-allele burden affects the expression level of these genes but does not correlate with F1 rosette size. Non-additive, dominant gene expression in F1 hybrids is much more common, with the vast majority of genes (over 90%) being expressed below the parental average. Unlike in the additive genes, regulatory rare-allele burden in the dominant gene set is strongly correlated with F1 rosette size, even though it only mildly covaries with the expression level of these genes.

Conclusions: Our study underscores under-dominance as the predominant gene action associated with emergence of rosette growth trajectories in the A. thaliana hybrid model. Our work lays the foundation for understanding molecular mechanisms and evolutionary forces that lead to dominance complementation of rare regulatory alleles.


Conflict of interest statement

D.W. holds equity in Computomics, which advises breeders. The other authors declare that they have no competing interests.

Figures

Fig. 1
Fig. 1
Summary of additive and dominant genes. A Experimental setup. Note that not all trios were completely sequenced and analyzed. B GO-term (biological process) enrichment of additive genes. C, D Both additive and dominant genes showed average transcript abundance (C) and coefficient of variation (D) profiles comparable to those of all genes in the background. E Additive genes ranked low by their dominance score. F Correlation among all dominant gene clusters. Pearson correlation coefficients were calculated using cluster average. G Revigo summary of biological processes enriched in dominant genes
Fig. 2
Fig. 2
Dominant gene expression level correlates with final rosette size. A Heatmap showing the average expression of each dominant gene cluster (K-means) in each sample, sorted into F1s and inbred parental lines, and arranged by ascending final rosette size. Clusters 1–5 showed no clear expression-size association. Cluster 6 (n = 107) showed a positive association, and clusters 7–13 (n = 151) showed a negative association B Linear-mixed-model spline fitting of exemplary clusters. Top: cluster 6, which showed positive expression-size association; bottom: cluster 7, which showed negative expression-size association; points: cluster mean expression in each sample; shaded area: 95% Bayesian credible intervals. The systematic differences in expression levels across the entire rosette-size range seen in F1 hybrids are consistent with F1s being larger than parents
Fig. 3
Fig. 3
BTH treatment reduced rosette size in both inbreds and F1s. A Experimental design. B F1s maintained a robust growth advantage despite the reduction in rosette size upon BTH treatment. PM: parent mock, F1M: F1 hybrid mock, PB: parent BTH treated, F1B: F1 BTH treated. C Positive correlation between rosette size dominance under mock and BTH conditions. Numbered labels indicate the ID of the SHB2 trios. D Typical rosette phenotype of a trio. E Diverse response of three example trios to BTH treatment. Reaction norm lines connect the mean ± SD rosette area of each genotype under both treatments
Fig. 4
Fig. 4
Genes whose degree of expression dominance in trios correlates with hybrid performance. A Exemplary clusters of “positive-positive” (left), “negative-negative” (middle), and “quadratic-negative” (right) genes. Thick solid line: spline fitting of the cluster means; thin lines: spline fitting of individual cluster members. B Average biomass MPH (the amount that F1 rosette size differs from that of corresponding parental mean) for rosette samples with low- vs. high- expression of genes in the same clusters as in A. Each violin depicts the distribution of cluster gene expression averaged across the top and the bottom (and the middle for the quadratic relationship) deciles of samples. C Pearson correlation coefficients (PCC) of all 61 clusters based on LMM-spline modeling. The clusters are further sorted into 12 classes labeled on the right according to the relationship between gene expression and biomass under mock or BTH treatment. D GO enrichment for genes from the negative cluster. The small plot shows the overall GO network structure, and the positional relationship of the two enlarged graphs of the sub-network (i and ii). E Regulatory regions of genes from both positive and negative clusters are enriched for a PCF binding motif. F De novo motif search confirmed enrichment of the PCF motif
Fig. 5
Fig. 5
Rare allele burden affects gene expression and the emergence of F1 growth advantage. A-C Association between gene expression rank and upstream rare allele count of additive genes (A), positive genes (B), and negative genes in inbred parents (C). Average upstream rare allele counts were calculated sensu Kremling et al. (2018) [31]: for each gene within the gene list (the cluster), all inbred samples received a rank based on their expression value. Across the gene list, average upstream rare allele counts of all samples sharing the same rank were plotted as points, and lines indicate LOWESS trend lines. Insets show the upstream rare-allele count of samples in the top (Mock 10, BTH10) and bottom decile (Mock 1, BTH 1) of expression ranks. DF Association between gene expression rank and upstream rare allele count of three gene lists in F1 hybrids. F1 samples are ranked by expression value the same way as the inbreds in AC. The rare allele count for the F1s is calculated as the average number of rare alleles between their corresponding parents. GI Association between rosette growth emergence and mean parental rare allele burden in additive (G), positive (H), and negative (I) genes. For each gene, F1s were ranked by the average number of rare alleles in their parents. Points: average non-additivity in rosette size of all F1s sharing the same rank; lines: LOWESS trend lines

References

    1. Falconer DS, Mackay TFC. Introduction to quantitative genetics. Essex: Longman; 1996.
    1. Braendle C, Heyland A, Flatt T. Integrating mechanistic and evolutionary analysis of life history variation. Mechanisms of life history evolution. The genetics and physiology of life history traits and trade-offs. New York: Oxford University Press; 2011. pp. 3–10.
    1. Varona L, Legarra A, Toro MA, Vitezica ZG. Non-additive effects in genomic selection. Front Genet. 2018;9:78. - PMC - PubMed
    1. Mackay TFC, Stone EA, Ayroles JF. The genetics of quantitative traits: challenges and prospects. Nat Rev Genet. 2009;10:565–577. - PubMed
    1. Zuk O, Hechter E, Sunyaev SR, Lander ES. The mystery of missing heritability: genetic interactions create phantom heritability. Proc Natl Acad Sci U S A. 2012;109:1193–1198. - PMC - PubMed

Publication types

LinkOut - more resources