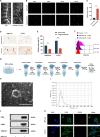
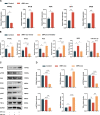
Degenerated nucleus pulposus cells derived exosome carrying miR-27a-3p aggravates intervertebral disc degeneration by inducing M1 polarization of macrophages
- PMID: 37667246
- PMCID: PMC10478255
- DOI: 10.1186/s12951-023-02075-y
Degenerated nucleus pulposus cells derived exosome carrying miR-27a-3p aggravates intervertebral disc degeneration by inducing M1 polarization of macrophages
Abstract
Background: Intervertebral disc degeneration (IVDD) is a major contributor to spinal disorders. Previous studies have indicated that the infiltration of immunocytes, specifically macrophages, plays a crucial role in the advancement of IVDD. Exosomes (exo) are believed to play a significant role in intercellular communication. This study aims to investigate the role of exosomes derived from degenerated nucleus pulposus (dNPc) in the process of macrophages M1 polarization.
Methods: Nucleus pulposus (NP) tissue and nucleus pulposus cells (NPc) were collected from patients with intervertebral disc degeneration (IVDD) and idiopathic scoliosis. Immunohistochemistry analysis was performed to determine the number of M1 macrophages in NP tissue. Subsequently, exosomes derived from degenerated NP cells (dNPc-exo) and non-degenerated NP cells (nNPc-exo) were collected and co-cultured with M0 macrophages, which were induced from THP-1 cells. The M1 phenotype was assessed using western blot, flow cytometry, immunofluorescence staining, and qRT-PCR. RNA-sequencing analysis was conducted to examine the expression levels of microRNAs in the dNPc-exo and nNPc-exo groups, and qRT-PCR was performed to investigate the effect pf different microRNA to induce macrophage polarization. Furthermore, western blot and qRT-PCR were employed to demonstrate the regulatory effect of microRNAs carried by dNPc-exo on downstream target signaling pathways in macrophages. Finally, an animal model of IVDD was utilized to investigate the impact of dNPc-exo on inducing M1 polarization of macrophages and its role in the IVDD process.
Results: In this study, we observed an increase in the number of M1 macrophages as the intervertebral disc (IVD) degraded. Additionally, we discovered that dNPc releases exosomes (dNPc-exo) could promote the polarization of macrophages towards the M1 phenotype. Notably, through RNA-sequencing analysis of dNPc-exo and nNPc-exo groups, we identified miR-27a-3p as a highly expressed miRNA in the dNPc-exo group, which significantly influences the induction of M1 polarization of macrophages. And then, we discovered that dNPc-exo has the ability to transport miR-27a-3p and target the PPARγ/NFκB/PI3K/AKT signaling pathway, thereby influencing the M1 polarization of macrophages. We conducted experiments using rat model of IVDD and observed that the exosomes carrying miR-27a-3p actually induced the M1 polarization of macrophages and exacerbated the degradation of IVD.
Conclusion: In conclusion, our findings highlight the significant role of dNPc-exo in IVDD process and provide a basis for further investigation into the mechanism of IVDD and the potential of exosome-based therapy.
Keywords: Exosome; Inflammatory regulation; Intervertebral disc degeneration; Macrophages; Nucleus pulposus.
© 2023. BioMed Central Ltd., part of Springer Nature.
Conflict of interest statement
The authors declare that no competing interest exists.
Figures


Similar articles
-
M1 macrophage-derived exosomes promote intervertebral disc degeneration by enhancing nucleus pulposus cell senescence through LCN2/NF-κB signaling axis.J Nanobiotechnology. 2024 May 31;22(1):301. doi: 10.1186/s12951-024-02556-8. J Nanobiotechnology. 2024. PMID: 38816771 Free PMC article.
-
Duhuo Jisheng decoction alleviates intervertebral disc degeneration by inhibiting nucleus pulposus cell ferroptosis via the exosome-mediated miR-19b-3p/ACSL4 axis.Phytomedicine. 2025 Oct;146:157113. doi: 10.1016/j.phymed.2025.157113. Epub 2025 Jul 30. Phytomedicine. 2025. PMID: 40774008
-
Cartilage endplate stem cells inhibit intervertebral disc degeneration by releasing exosomes to nucleus pulposus cells to activate Akt/autophagy.Stem Cells. 2021 Apr;39(4):467-481. doi: 10.1002/stem.3322. Epub 2021 Jan 18. Stem Cells. 2021. PMID: 33459443 Free PMC article.
-
Nanoscale Treatment of Intervertebral Disc Degeneration: Mesenchymal Stem Cell Exosome Transplantation.Curr Stem Cell Res Ther. 2023;18(2):163-173. doi: 10.2174/1574888X17666220422093103. Curr Stem Cell Res Ther. 2023. PMID: 35466881 Review.
-
Mesenchymal Stem Cell-Derived Exosomes and Intervertebral Disc Regeneration: Review.Int J Mol Sci. 2022 Jun 30;23(13):7306. doi: 10.3390/ijms23137306. Int J Mol Sci. 2022. PMID: 35806304 Free PMC article. Review.
Cited by
-
Therapeutic potential of stem cell-derived exosomes for bone tissue regeneration around prostheses.J Orthop Translat. 2025 Apr 11;52:85-96. doi: 10.1016/j.jot.2025.03.007. eCollection 2025 May. J Orthop Translat. 2025. PMID: 40291635 Free PMC article. Review.
-
CTRP9 attenuates peripheral nerve injury-induced mechanical allodynia and thermal hyperalgesia through regulating spinal microglial polarization and neuroinflammation mediated by AdipoR1 in male mice.Cell Biol Toxicol. 2024 Oct 26;40(1):91. doi: 10.1007/s10565-024-09933-x. Cell Biol Toxicol. 2024. PMID: 39460844 Free PMC article.
-
DDX1 methylation mediated MATR3 splicing regulates intervertebral disc degeneration by initiating chromatin reprogramming.Nat Commun. 2025 Jul 4;16(1):6153. doi: 10.1038/s41467-025-61486-7. Nat Commun. 2025. PMID: 40610464 Free PMC article.
-
Pyroptosis: A spoiler of peaceful coexistence between cells in degenerative bone and joint diseases.J Adv Res. 2025 May;71:227-262. doi: 10.1016/j.jare.2024.06.010. Epub 2024 Jun 13. J Adv Res. 2025. PMID: 38876191 Free PMC article. Review.
-
Targeted Inhibition of cGAS/STING signaling induced by aberrant R-Loops in the nucleus pulposus to alleviate cellular senescence and intervertebral disc degeneration.J Nanobiotechnology. 2025 Jul 14;23(1):510. doi: 10.1186/s12951-025-03579-5. J Nanobiotechnology. 2025. PMID: 40660286 Free PMC article.
References
MeSH terms
Substances
Grants and funding
LinkOut - more resources
Full Text Sources
Miscellaneous

