. 2023 Sep 4;21(1):185.
doi: 10.1186/s12915-023-01681-4.

Spatial biology of Ising-like synthetic genetic networks

Affiliations

Spatial biology of Ising-like synthetic genetic networks

Kevin Simpson et al. BMC Biol. .

Abstract

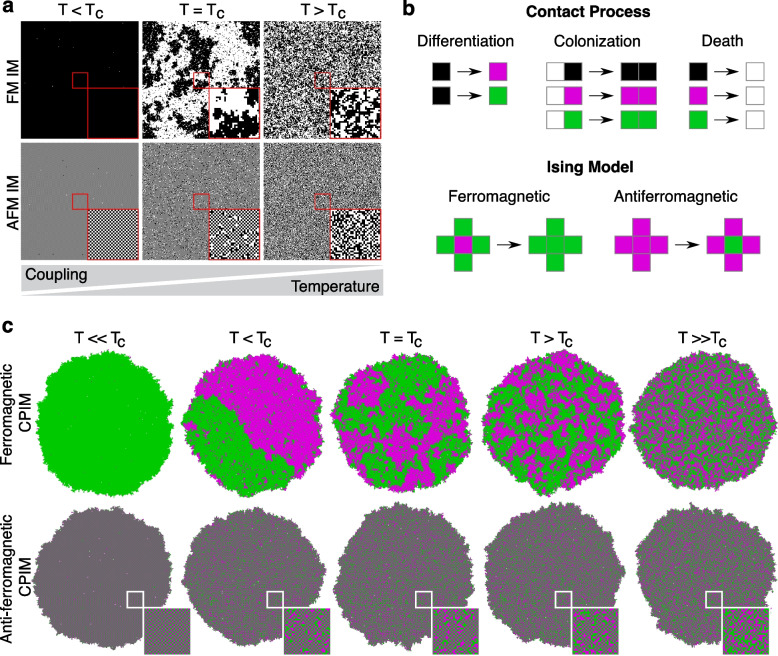
Background: Understanding how spatial patterns of gene expression emerge from the interaction of individual gene networks is a fundamental challenge in biology. Developing a synthetic experimental system with a common theoretical framework that captures the emergence of short- and long-range spatial correlations (and anti-correlations) from interacting gene networks could serve to uncover generic scaling properties of these ubiquitous phenomena.

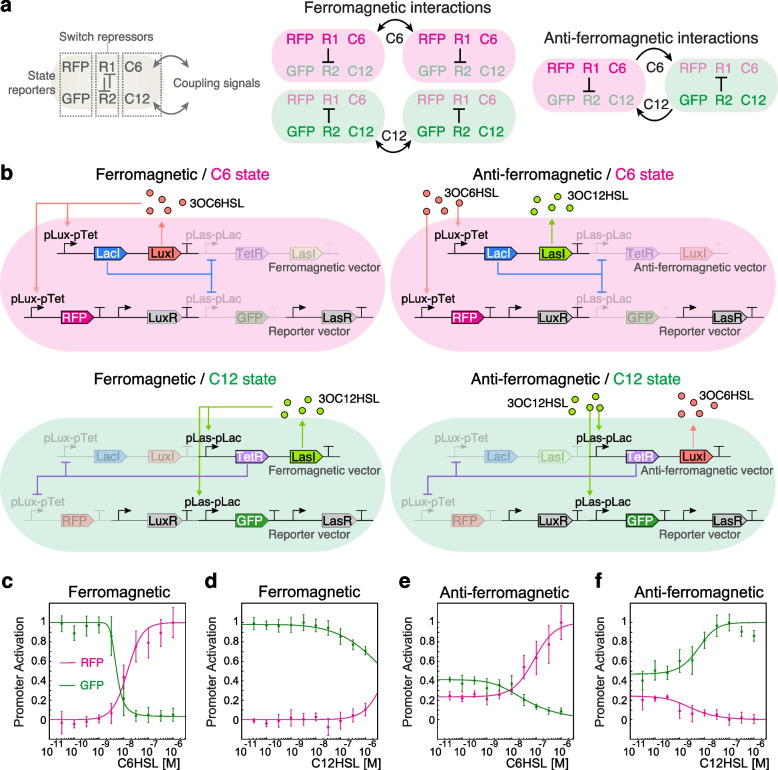
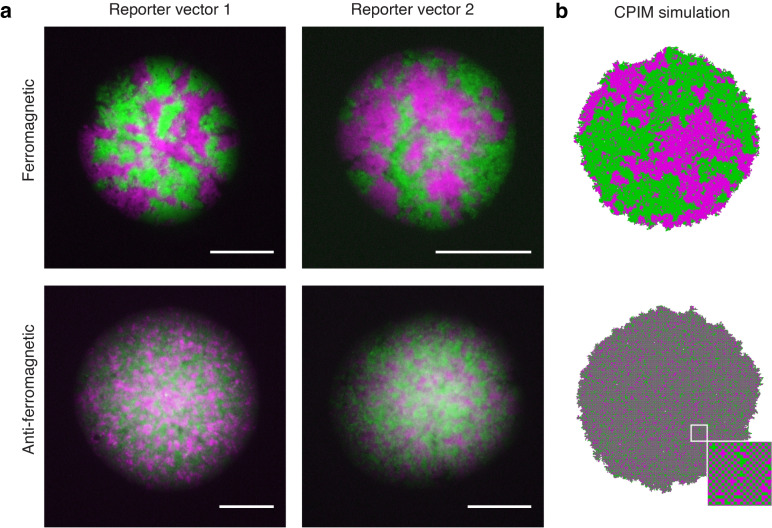
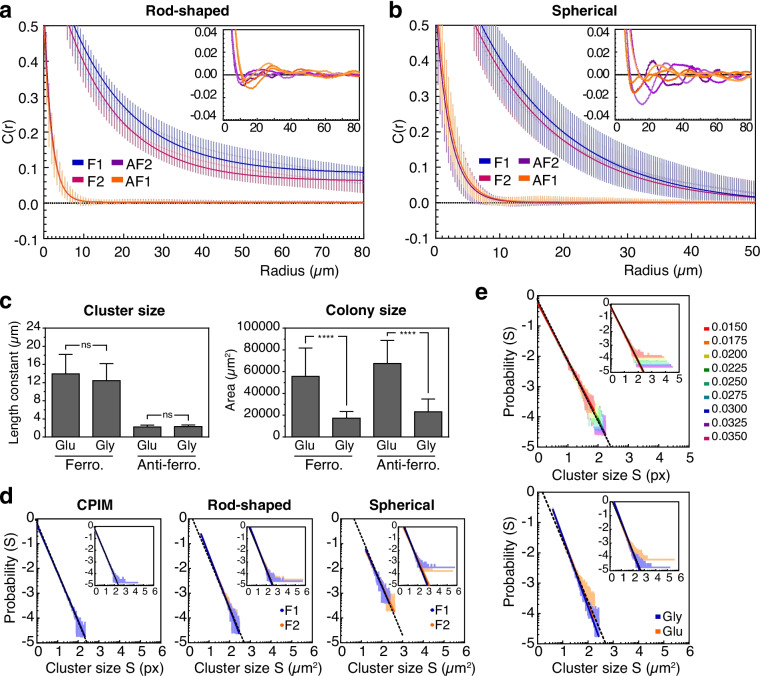
Results: Here, we combine synthetic biology, statistical mechanics models, and computational simulations to study the spatial behavior of synthetic gene networks (SGNs) in Escherichia coli quasi-2D colonies growing on hard agar surfaces. Guided by the combined mechanisms of the contact process lattice simulation and two-dimensional Ising model (CPIM), we describe the spatial behavior of bi-stable and chemically coupled SGNs that self-organize into patterns of long-range correlations with power-law scaling or short-range anti-correlations. These patterns, resembling ferromagnetic and anti-ferromagnetic configurations of the Ising model near critical points, maintain their scaling properties upon changes in growth rate and cell shape.

Conclusions: Our findings shed light on the spatial biology of coupled and bistable gene networks in growing cell populations. This emergent spatial behavior could provide insights into the study and engineering of self-organizing gene patterns in eukaryotic tissues and bacterial consortia.

Keywords: Bi-stable; Criticality; Ising model; Spatial correlation; Synthetic gene networks.


Conflict of interest statement

The authors declare that they have no competing interests.

Figures

Fig. 1
Fig. 1
Ising-like interactions in a growing population of cells. a Numerical simulations of the two-dimensional ferromagnetic (FM IM) and anti-ferromagnetic (AFM IM) Ising model on a 250 × 250 lattice at different temperatures T relative to the critical temperature Tc. White and black squares represent the spin orientations σ=±1. Insets correspond to a magnification of a 30 × 30 square in the center of the images. b Basic rules that define CPIM simulations: Contact process lattice reactions of colonization, differentiation and death processes (top); and Ising-like cellular state change mechanisms (bottom). Each site of this lattice can be in one of four states S={,,+1,-1}, which represent vacant locations (, white squares), locations occupied by undifferentiated cells (, black squares), and locations occupied by differentiated cells in red (+1, magenta squares) or green (-1, green squares) state. c CPIM numerical simulations of growing ferromagnetic and anti-ferromagnetic cell populations at different values of the control parameter T relative to the critical value Tc. In the CPIM simulations, T represents a parameter that determines the strength of coupling between cells. Insets show a magnification of the square in the center of anti-ferromagnetic colonies showing a detail of the checkerboard-like pattern
Fig. 2
Fig. 2
Ferromagnetic and anti-ferromagnetic configurations of coupled, bi-stable synthetic gene networks. a Schematic representation of ferromagnetic and anti-ferromagnetic interactions between two neighboring cells. The states, defined by the expression of red (mCherry2 labeled as “RFP” for simplicity) or green (sfGFP, labeled as “GFP” for simplicity) fluorescent proteins, are determined by mutually inhibiting repressors R1 and R2. Cell states are coupled, in ferromagnetic and anti-ferromagnetic configurations, with neighboring cells by diffusive signals C6 and C12. b Gene network arrangement of ferromagnetic and anti-ferromagnetic systems in C6 and C12 states. Ferromagnetic and anti-ferromagnetic systems are composed of a ferromagnetic or anti-ferromagnetic vector and a reporter vector. LasR-C12 and LuxR-C6 complexes were omitted for simplicity. cf Red and green fluorescent protein synthesis rate of E. coli cells carrying ferromagnetic (c, d) and anti-ferromagnetic (e, f) systems, grown in liquid medium supplemented with different concentrations of C6HSL (left) and C12HSL (right). Points and error bars correspond to the mean of the fluorescent protein synthesis rates normalized by its maximum value reached in each system and the standard deviation of 4 biological replicates, while lines correspond to the fitting of Eq. 2
Fig. 3
Fig. 3
Self-organized patterns of cellular states in ferromagnetic and anti-ferromagnetic colonies. a Representative images of red and green fluorescent protein patterns that emerge in colonies of spherical E. coli cells carrying the ferromagnetic or anti-ferromagnetic systems with reporter vector 1 or 2. Cells were grown on solid M9-glucose medium supplemented with 10-8 M of C6HSL, a concentration that counteracts the bias introduced by the basal expression of the pLas81pLac promoter. Images were taken approximately 18 h after inoculation. Scale bars 100 μm. Red cells are shown in magenta. b Images obtained from populations simulated with CPIM are included for comparison
Fig. 4
Fig. 4
Spatial correlation in ferromagnetic and anti-ferromagnetic colonies. Spatial autocorrelation function C(r) in colonies of rod-shaped (a) and spherical (b) E. coli cells carrying the ferromagnetic (F) and anti-ferromagnetic (AF) systems with reporter vector 1 (F1 and AF1) or 2 (F2 and AF2). Points and error bars correspond to the mean ± the standard deviation of around 40 colonies for each system, and lines correspond to the best fit of the exponential decay equation y=y0exp(-x/b)+C to the data. Insets show the oscillating behavior of the sACF around zero of individual anti-ferromagnetic colonies, which is lost when the data is averaged. c Length constant and colony size of ferromagnetic and anti-ferromagnetic colonies of spherical E. coli cells grown in M9 solid medium supplemented with glucose (Glu) or glycerol (Gly), showing that cell division rate does not affect the spatial correlations. Statistical analysis was performed using an unpaired two-tailed Mann-Whitney test (α=5%). ns (not significant): P > 0.05; : P 0.0001. d Probability distribution P(S) (log10-log10 plots) of the cluster size S (in pixels) for ferromagnetic populations simulated with CPIM (left) and ferromagnetic colonies of rod-shaped (middle) and spherical (right) cells. e Probability distribution of the cluster size for ferromagnetic populations simulated with CPIM at different cell birth rates, from 0.0350 to 0.0150 (top), and ferromagnetic colonies of spherical cells grown in glycerol (blue) or glucose (red) (bottom). Plots in d and e were obtained using the algorithms r_plfit with the default low-frequency cut-off [69]. Solid lines correspond to the power-law P(s)=Cx-γ found by the algorithm. Insets show the probability distribution of all the clusters found in the populations (without cut-off), with solid lines corresponding to the best fit of the data to equation P(s)=As-γ found by the least squares method. Dotted lines correspond to a curve with γ=2.00

References

    1. Noble AE, Rosenstock TS, Brown PH, Machta J, Hastings A. Spatial patterns of tree yield explained by endogenous forces through a correspondence between the Ising model and ecology. Proc Natl Acad Sci U S A. 2018;115(8):1825–1830. doi: 10.1073/pnas.1618887115. - DOI - PMC - PubMed
    1. Bray D, Duke T. Conformational spread: the propagation of allosteric states in large multiprotein complexes. Annu Rev Biophys Biomol Struct. 2004;33:53–73. doi: 10.1146/annurev.biophys.33.110502.132703. - DOI - PubMed
    1. Duke TA, Le Novere N, Bray D. Conformational spread in a ring of proteins: a stochastic approach to allostery. J Mol Biol. 2001;308(3):541–53. doi: 10.1006/jmbi.2001.4610. - DOI - PubMed
    1. Turing AM. The chemical basis of morphogenesis. Bull Math Biol. 1990;52(1–2):153–97. doi: 10.1007/bf02459572. - DOI - PubMed
    1. van Vliet S, Dal Co A, Winkler AR, Spriewald S, Stecher B, Ackermann M. Spatially correlated gene expression in bacterial groups: the role of lineage history, spatial gradients, and cell-cell interactions. Cell Syst. 2018;6(4):496–507. - PMC - PubMed

Publication types

LinkOut - more resources