

Large-scale proximity extension assay reveals CSF midkine and DOPA decarboxylase as supportive diagnostic biomarkers for Parkinson's disease
- PMID: 37667404
- PMCID: PMC10476347
- DOI: 10.1186/s40035-023-00374-w
Large-scale proximity extension assay reveals CSF midkine and DOPA decarboxylase as supportive diagnostic biomarkers for Parkinson's disease
Abstract
Background: There is a need for biomarkers to support an accurate diagnosis of Parkinson's disease (PD). Cerebrospinal fluid (CSF) has been a successful biofluid for finding neurodegenerative biomarkers, and modern highly sensitive multiplexing methods offer the possibility to perform discovery studies. Using a large-scale multiplex proximity extension assay (PEA) approach, we aimed to discover novel diagnostic protein biomarkers allowing accurate discrimination of PD from both controls and atypical Parkinsonian disorders (APD).
Methods: CSF from patients with PD, corticobasal syndrome (CBS), progressive supranuclear palsy (PSP), multiple system atrophy and controls, were analysed with Olink PEA panels. Three cohorts were used in this study, comprising 192, 88 and 36 cases, respectively. All samples were run on the Cardiovascular II, Oncology II and Metabolism PEA panels.
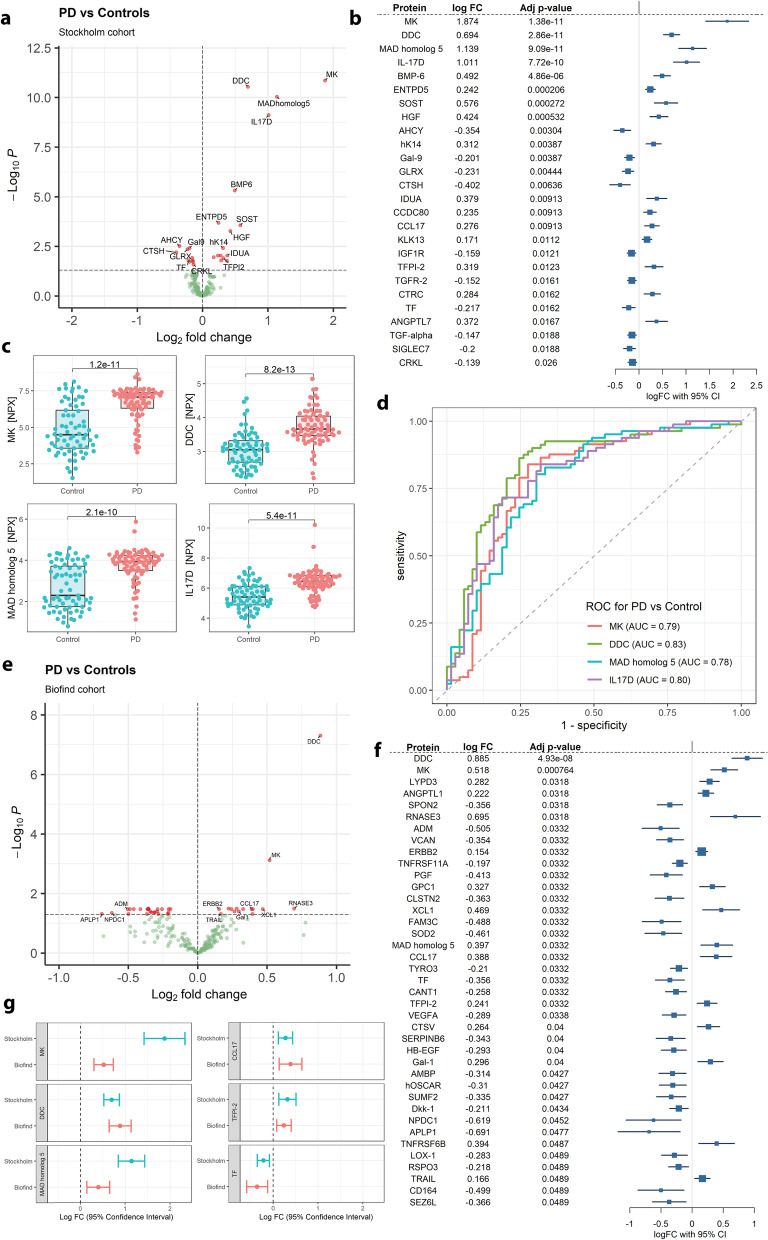
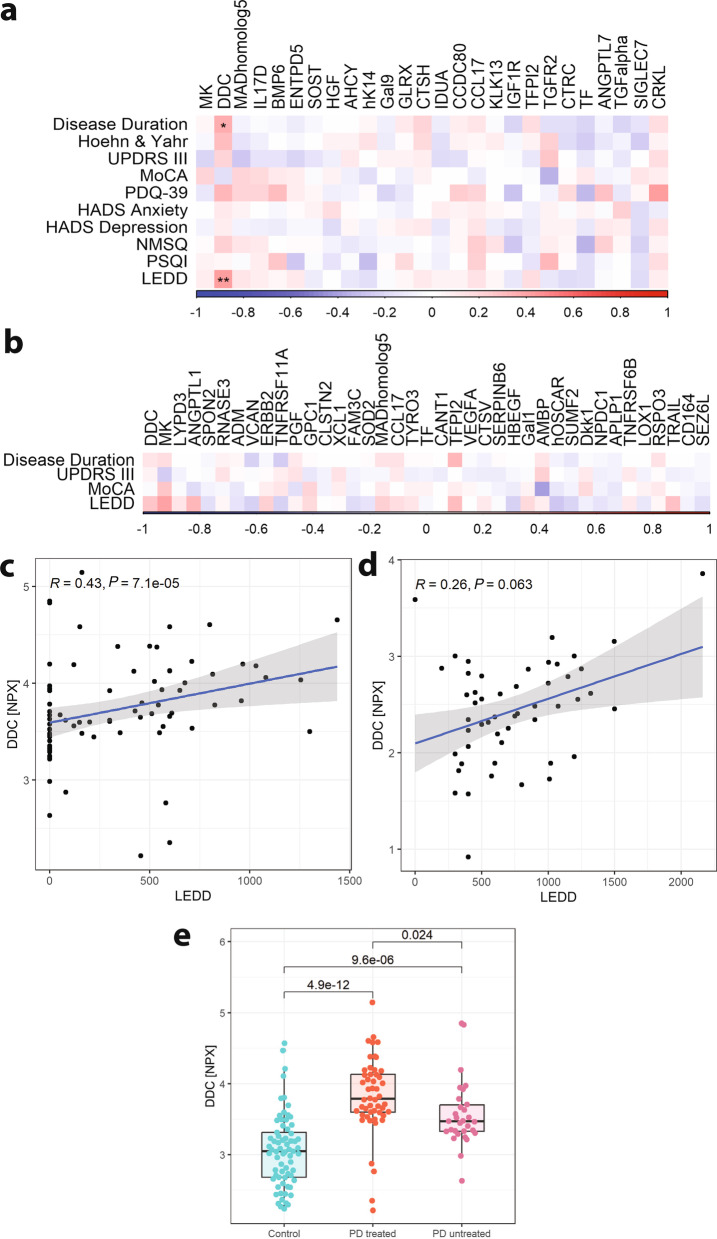
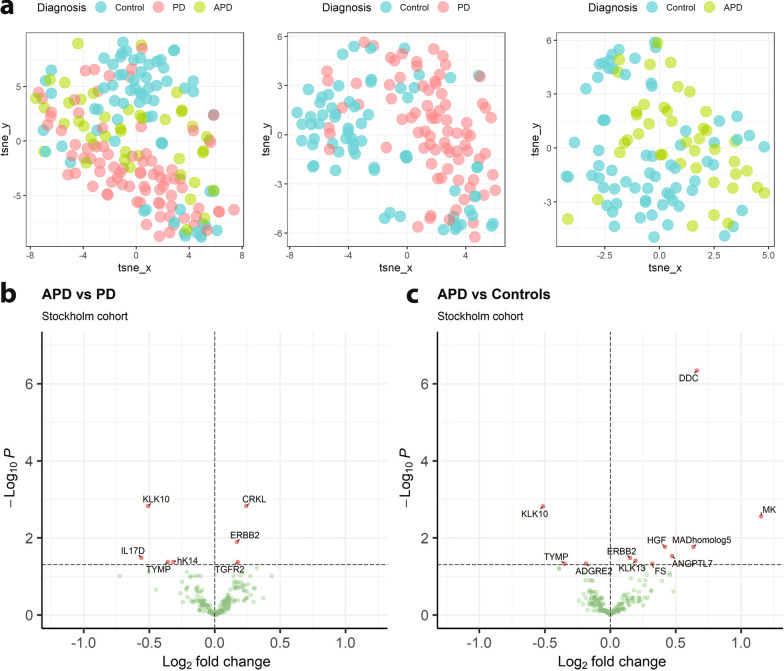
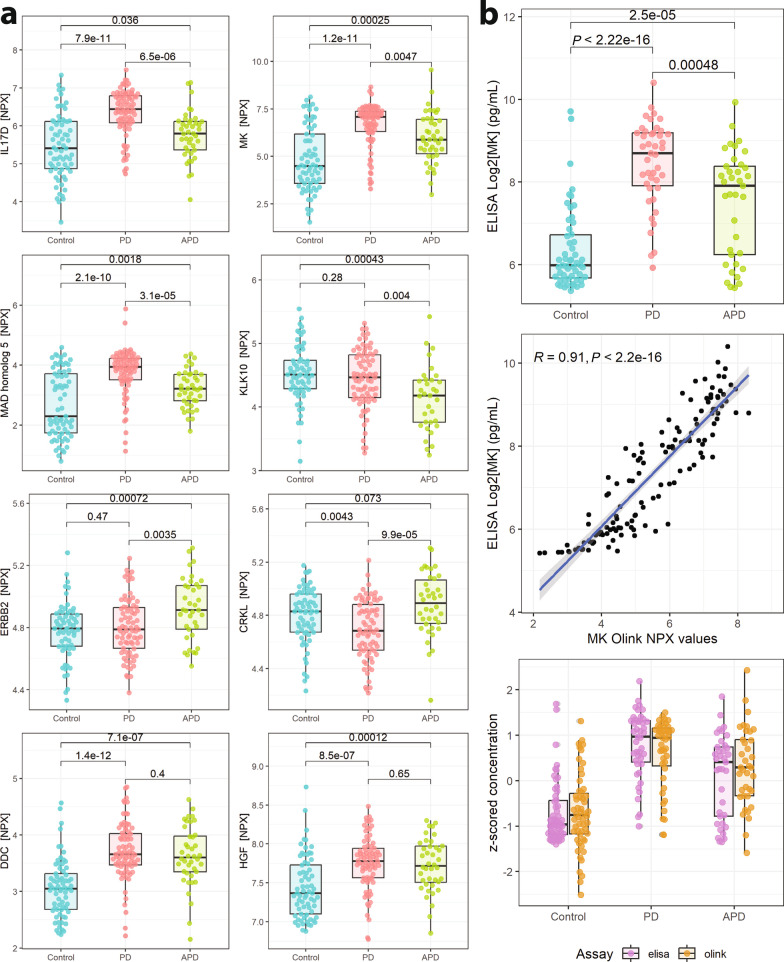
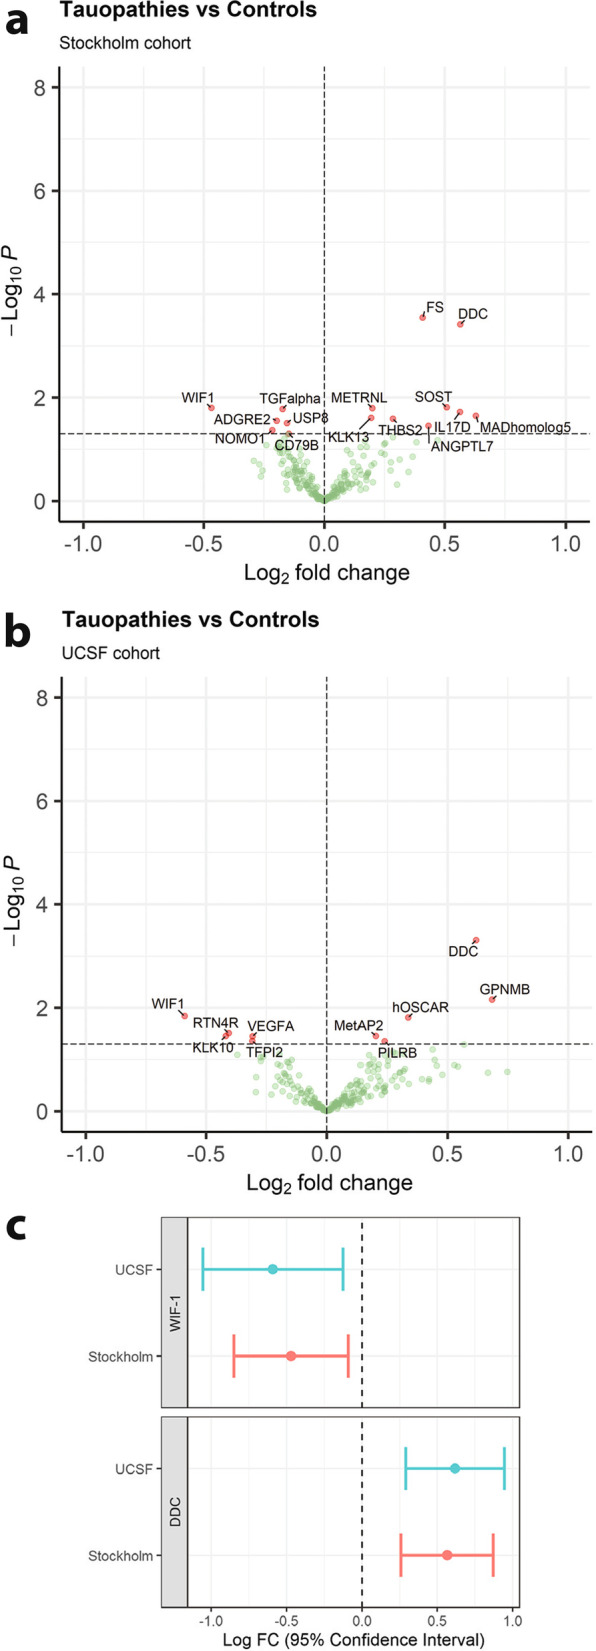
Results: Our analysis revealed that 26 and 39 proteins were differentially expressed in the CSF of test and validation PD cohorts, respectively, compared to controls. Among them, 6 proteins were changed in both cohorts. Midkine (MK) was increased in PD with the strongest effect size and results were validated with ELISA. Another most increased protein in PD, DOPA decarboxylase (DDC), which catalyses the decarboxylation of DOPA (L-3,4-dihydroxyphenylalanine) to dopamine, was strongly correlated with dopaminergic treatment. Moreover, Kallikrein 10 was specifically changed in APD compared with both PD and controls, but unchanged between PD and controls. Wnt inhibitory factor 1 was consistently downregulated in CBS and PSP patients in two independent cohorts.
Conclusions: Using the large-scale PEA approach, we have identified potential novel PD diagnostic biomarkers, most notably MK and DDC, in the CSF of PD patients.
Keywords: Atypical Parkinsonian disorders; Biomarker; Cerebrospinal fluid; Corticobasal syndrome; DOPA decarboxylase; Midkine; Multiple system atrophy; Parkinson’s disease; Progressive supranuclear palsy; Proximity extension assay.
© 2023. Ruijin Hospital, Shanghai Jiao Tong University.
Conflict of interest statement
Authors declare no competing interests. WP reports grants unrelated to this work from Åke Wibergs Stiftelse and The Michael J. Fox Foundation for Parkinson’s Research. AB reports consultancy unrelated to this work for AGTC, Alector (stock/options), Arkuda (options), Arvinas (options), Asceneuron, AZTherapies (options), Bioage, GSK, Humana, Lundbeck, Ono, Roche, Samumed, Sangamo, Stealth Therapeutics, Third Rock, Transposon, UCB and Wave, and received research support from the Association for Frontotemporal Degeneration, Biogen, Bluefield Project to Cure Frontotemporal Dementia, Eli Lilly, Eisai, National Institutes of Health (U19AG063911, U54NS092089, R01AG031278), and the Rainwater Charitable Foundation. PS reports grants from Karin and Sten Mörtstedt CBD Solutions AB, the Swedish Parkinson fund, the ALF program of the Stockholm Stockholm City, Knut and Alice Wallenberg Foundation, The Michael J. Fox Foundation for Parkinson’s Research, the Swedish Parkinson foundation, Lexa/Nordstjernan, ASAP, and Van Geest Foundation.
Figures
Comment in
-
Tracking neurodegenerative diseases in biofluids: Combining pathology and pathophysiology markers is the way.Cell Chem Biol. 2023 Nov 16;30(11):1340-1342. doi: 10.1016/j.chembiol.2023.10.018. Cell Chem Biol. 2023. PMID: 37977130
References
-
- Siderowf A, Concha-Marambio L, Lafontant D-E, Farris CM, Ma Y, Urenia PA, et al. Assessment of heterogeneity among participants in the Parkinson’s Progression Markers Initiative cohort using α-synuclein seed amplification: a cross-sectional study. Lancet Neurol. 2023;22(5):407–417. doi: 10.1016/S1474-4422(23)00109-6. - DOI - PMC - PubMed
Publication types
MeSH terms
Substances
Grants and funding
LinkOut - more resources
Full Text Sources
Medical
Miscellaneous
