. 2023 Sep;11(17):e15814.
doi: 10.14814/phy2.15814.

Decreased plasma cartilage acidic protein 1 in COVID-19

Affiliations

Decreased plasma cartilage acidic protein 1 in COVID-19

Mats W Johansson et al. Physiol Rep. 2023 Sep.

Abstract

Cartilage acidic protein-1 (CRTAC1) is produced by several cell types, including Type 2 alveolar epithelial (T2AE) cells that are targeted by SARS-CoV2. Plasma CRTAC1 is known based on proteomic surveys to be low in patients with severe COVID-19. Using an ELISA, we found that patients treated for COVID-19 in an ICU almost uniformly had plasma concentrations of CRTAC1 below those of healthy controls. Magnitude of decrease in CRTAC1 distinguished COVID-19 from other causes of acute respiratory decompensation and correlated with established metrics of COVID-19 severity. CRTAC1 concentrations below those of controls were found in some patients a year after hospitalization with COVID-19, long COVID after less severe COVID-19, or chronic obstructive pulmonary disease. Decreases in CRTAC1 in severe COVID-19 correlated (r = 0.37, p = 0.0001) with decreases in CFP (properdin), which interacts with CRTAC1. Thus, decreases of CRTAC1 associated with severe COVID-19 may result from loss of production by T2AE cells or co-depletion with CFP. Determination of significance of and reasons behind decreased CRTAC1 concentration in a subset of patients with long COVID will require analysis of roles of preexisting lung disease, impact of prior acute COVID-19, age, and other confounding variables in a larger number of patients.

Keywords: CFP/properdin; COVID-19; CRTAC1; Type 2 alveolar epithelial cells.


Figures

FIGURE 1
FIGURE 1
Western blot and development of ELISA for CRTAC1 and comparison of CRTAC1 concentrations in plasma as determined by ELISA and mass spectrometry. (a) Left: SDS‐PAGE Gelcode Blue staining of recombinant human CRTAC1 (2 μg/well) under reducing conditions; right: immunoblots under reducing conditions using sheep polyclonal antibodies or mouse mAb to recognize recombinant human CRTAC1 (10 ng) (lane 1) or CRTAC1 in four plasma samples (lanes 2–5) estimated to vary in amount of CRTAC1 by ELISA as indicated below the lane. Positions of molecular size markers (kDa) on the left. (b) Representative ELISA for human CRTAC1: optical density (OD) at 450 nm versus a standard (std) curve of recombinant human CRTAC1 in nM or dilutions of three plasma samples for which the indicated concentrations were determined. (c) CRTAC1 concentration (log nM) of plasma samples from hospitalized patients with or without COVID‐19 determined by ELISA versus concentration predicted by mass spectrometry (MS) compared to ALB as described in the text. Shown are the linear regression of the log10 values and 95% confidence intervals; closed circles, samples with non‐imputed MS data; open circles, samples with imputed MS data, n = 128 of which 27 had imputed MS data. Pearson correlation coefficient (r) for all samples = 0.58, probability (p) < 0.0001; for non‐imputed samples r = 0.58, p < 0.0001; and for imputed samples r = 0.16, p = 0.42.
FIGURE 2
FIGURE 2
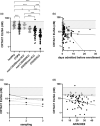
Plasma CRTAC1 concentrations determined by ELISA in different subject groups and relation to hospital day and clinical severity score. (a) The 20 healthy control subjects, 55 patients with COPD, and 128 hospitalized patients divided into groups without (n = 26, non‐COVID, open circles) or with (n = 102, COVID, closed circles) COVID‐19 and further divided into patients who were not (n = 10 + 51, respectively, non‐ICU) or were (n = 16 + 51, respectively, ICU) in the intensive care unit at time of enrollment. ***p ≤ 0.001, *p ≤ 0.02 (t‐test for pairwise comparison of COPD versus healthy, otherwise Tukey's multiple comparisons posttest). (b) CRTAC1 concentration versus day of hospitalization. The 128 patients divided into groups without (n = 26, open circles, dashed line) or with COVID‐19 (n = 102, closed circles, solid line). Spearman rank correlation coefficient (r s) for COVID‐19 = −0.10, p = 0.30; for non‐COVID‐19 r s = −0.28, p = 0.16, for all r s = −0.29, p = 0.0009. (c) CRTAC1 concentration in another set of hospitalized patients with COVID‐19 (n = 5) who were sampled more than once with 3‐day intervals. D: CRTAC1 concentration versus APACHE (acute physiological assessment and chronic health evaluation) II score. The 75 patients given an APACHEII score are divided into groups without (n = 17, open circles, dashed line) or with COVID‐19 (n = 58, closed circles, solid line). r s for COVID‐19 = −0.33, p = 0.01; for non‐COVID‐19 r s = −0.20, p = 0.44; for all r s = −0.30, p = 0.009. Band, range of healthy subjects (17.2–59.7 nM).
FIGURE 3
FIGURE 3
Plasma CRTAC1 concentrations determined by ELISA in patients after COVID‐19 treated in or outside the hospital. (a) A subset (n = 16) of the 102 patients hospitalized with COVID‐19 were sampled 1 year after hospitalization, p < 0.0001 for a year later (1 year) versus the time of hospitalization (initial) (paired t test of log10 data). (b) Patients with long COVID (n = 127); p = 0.02 for long COVID versus healthy and p = 0.008 for long COVID versus COPD (t‐test). (c) Plot of plasma CRTAC1 versus age in long COVID patients without (n = 111, closed circles, solid line) and with (n = 16, open circles, dashed line) COPD, with linear regressions. (d) Plot of plasma CRTAC1 versus age in healthy controls (n = 20) with linear regression. Band, range of healthy subjects (17.2–59.7 nM).
FIGURE 4
FIGURE 4
IBAQ scores and CVs of plasma proteins in hospitalized COVID‐19 patients. (a) Scatter plot of means of log10 IBAQ value versus coefficients of variation (CVs) calculated based on log10 IBAQ scores of the 501 proteins. Closed circles, secreted proteins; open circles, non‐secreted proteins. The proteins with the highest and lowest IBAQ scores (ALB and SPTA1, respectively) and one outlier (ASS1) are indicated. (b) Box plots (boxes representing medians and quartiles, whiskers representing minimum and maximum) of means of log10 IBAQ scores (left) and CVs (right) of secreted and not secreted proteins, p < 0.0001 for each comparison. (c) Pearson correlation coefficient (r) between log10 CRTAC1 determined by ELISA and log10 IBAQ value by mass spectrometry (MS) of the 501 plasma proteins. p for r outside the band <0.05.
FIGURE 5
FIGURE 5
Interaction of CRTAC1 and CFP. (a) CFP concentrations predicted by ratio of IBAQ values with ALB in the hospitalized patients divided into groups without or with COVID‐19 and further divided into patients who were not or were in the intensive care unit at time of enrollment, as in Figure 2a. For comparisons of groups: ***p ≤ 0.001, **p ≤ 0.005 (Tukey's multiple comparisons posttest). (b) Scatter plot of nM concentrations of CFP predicted by ratio of IBAQ values with ALB and CRTAC1 determined by ELISA. Pearson correlation coefficient (r) for COVID‐19 (closed circles, solid line) = 0.37, p = 0.0001; for non‐COVID‐19 (open circles, dashed line) r = 0.26, p = 0.22. (c) Binding of 140 nM CRTAC1 (10 μg/mL) to immobilized CFP (coated at 200 nM [10 μg/mL]) as detected with anti‐CRTAC1. (d) Binding as detected with anti‐CRTAC1 of increasing concentrations of CRTAC1 in the absence or presence of 1 mM CaCl2 to immobilized CFP coated at 200 nM in TBS. (e) Inhibition by preincubation with 200 nM soluble CFP of binding of 43 nM CRTAC1 (3 μg/mL) to CFP coated at 60 nM (3 μg/mL); bound CRTAC1 detected with anti‐CRTAC1. Mean and standard error of the mean (SEM) of triplicate (c and e) or duplicate (d) wells.

References

    1. Anjos, L. , Morgado, I. , Guerreiro, M. , Cardoso, J. C. , Melo, E. P. , & Power, D. M. (2017). Cartilage acidic protein 1, a new member of the beta‐propeller protein family with amyloid propensity. Proteins, 85, 242–255. - PubMed
    1. Ballard, P. L. , Lee, J. W. , Fang, X. , Chapin, C. , Allen, L. , Segal, M. R. , Fischer, H. , Illek, B. , Gonzales, L. W. , Kolla, V. , & Matthay, M. A. (2010). Regulated gene expression in cultured type II cells of adult human lung. American Journal of Physiology. Lung Cellular and Molecular Physiology, 299, L36–L50. - PMC - PubMed
    1. Balnis, J. , Madrid, A. , Hogan, K. J. , Drake, L. A. , Adhikari, A. , Vancavage, R. , Singer, H. A. , Alisch, R. S. , & Jaitovich, A. (2022). Persistent blood DNA methylation changes one year after SARS‐CoV‐2 infection. Clinical Epigenetics, 14, 94. - PMC - PubMed
    1. Benjamini, Y. , & Hochberg, Y. (1995). Controlling the false discovery rate: A practical and powerful apporach to multiple testing. Journal of the Royal Statistical Society: Series B, 57, 289–300.
    1. Bland, J. M. , & Altman, D. G. (1995). Multiple significance tests: The Bonferroni method. BMJ, 310, 170. - PMC - PubMed

Publication types