

The role of regulatory T cells in the pathogenesis of acute kidney injury
- PMID: 37667551
- PMCID: PMC10568672
- DOI: 10.1111/jcmm.17771
The role of regulatory T cells in the pathogenesis of acute kidney injury
Abstract
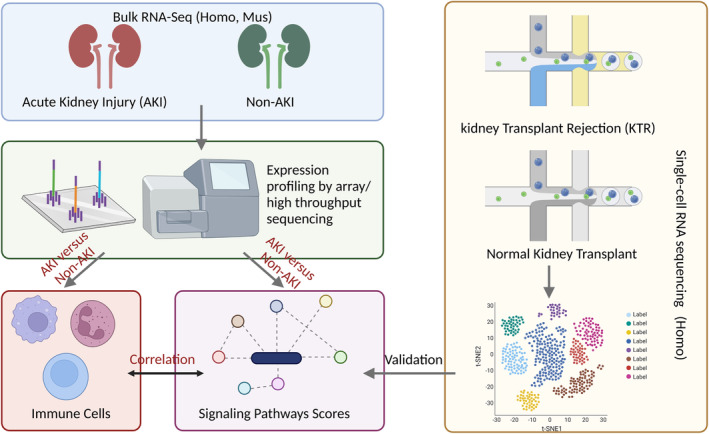
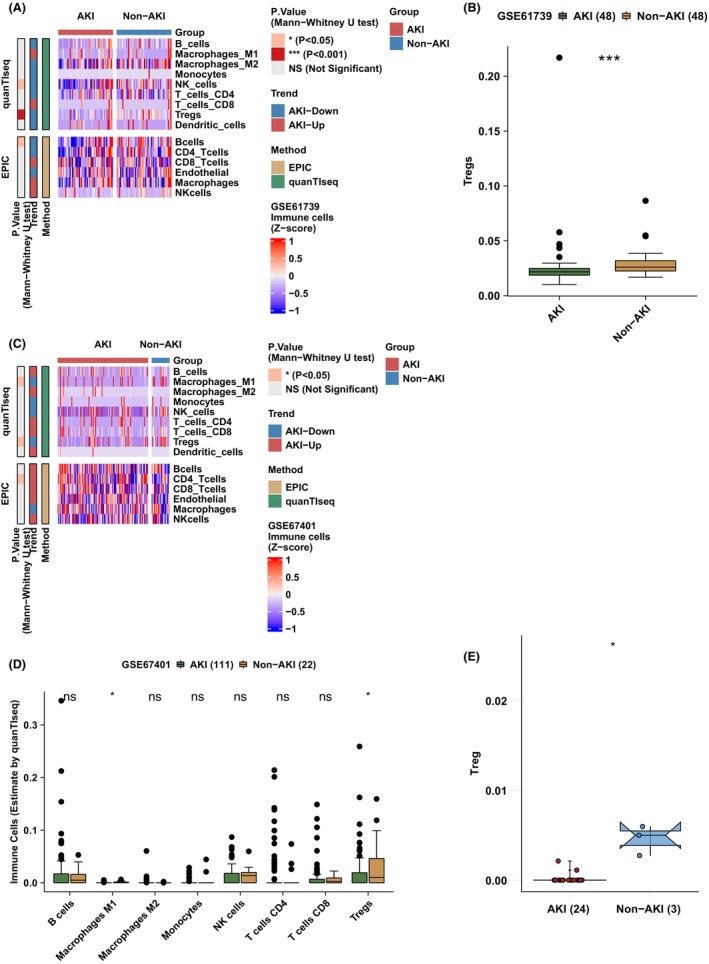
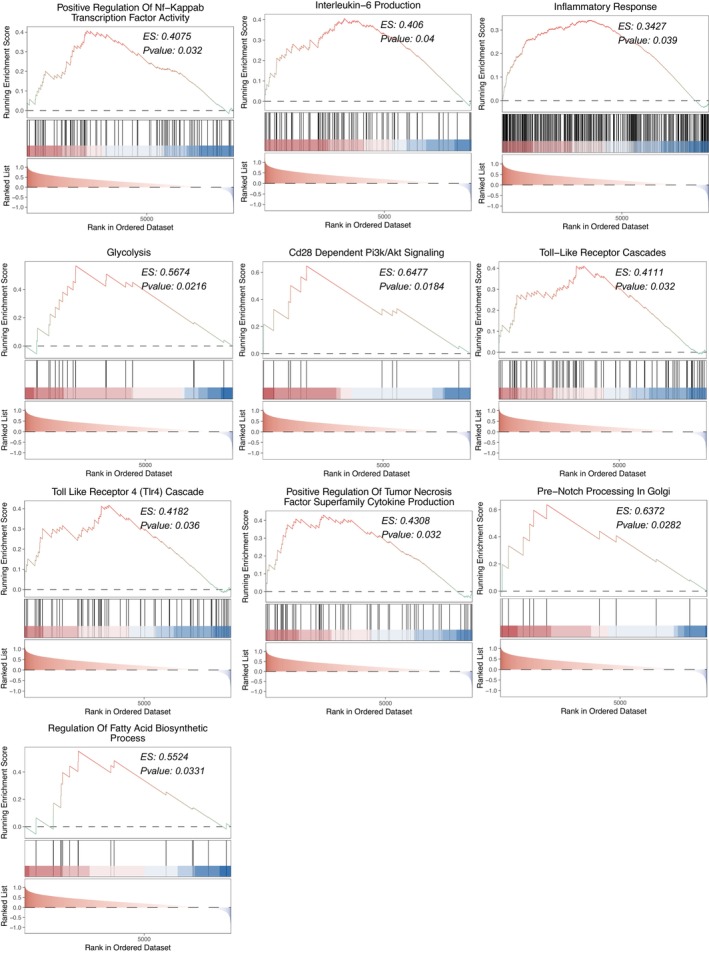
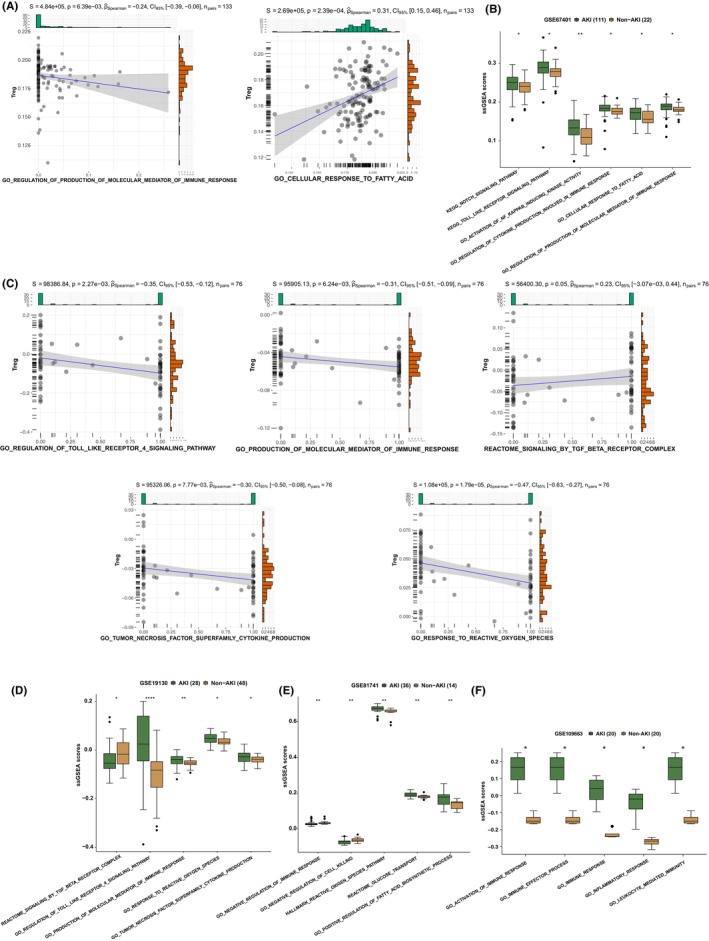
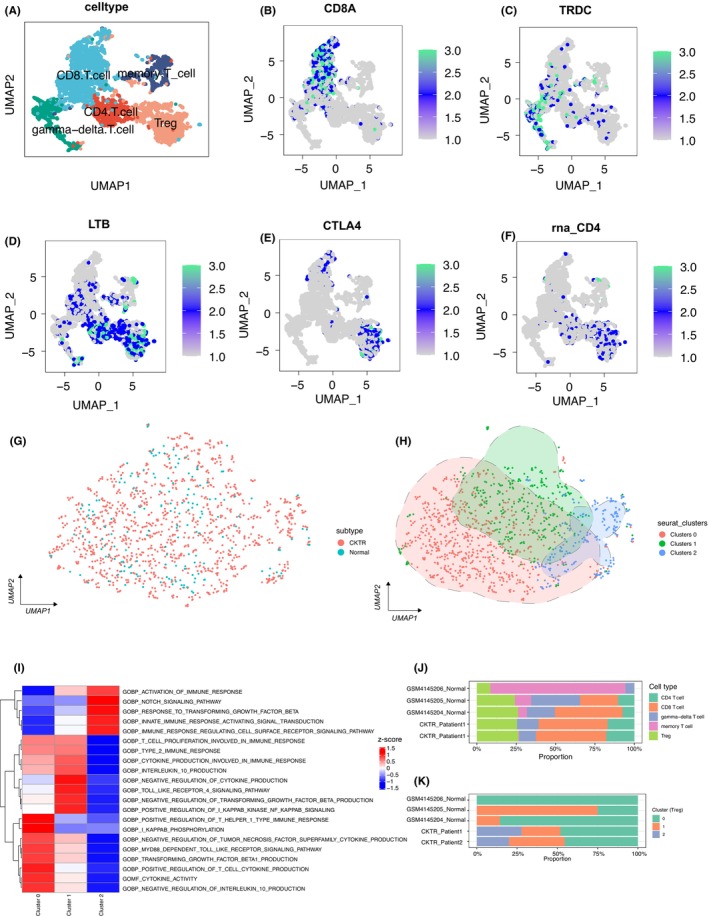
The incidence of acute kidney injury (AKI) is on the rise and is associated with high mortality; however, there are currently few effective treatments. Moreover, the relationship between Tregs and other components of the immune microenvironment (IME) in the pathogenesis of AKI remains unclear. We downloaded four publicly accessible AKI datasets, GSE61739, GSE67401, GSE19130, GSE81741, GSE19288 and GSE106993 from the gene expression omnibus (GEO) database. Additionally, we gathered two kidney single-cell sequencing (scRNA-seq) samples from the Department of Organ Transplantation at Zhujiang Hospital of Southern Medical University to investigate chronic kidney transplant rejection (CKTR). Moreover, we also collected three samples of normal kidney tissue from GSE131685. By analysing the differences in immune cells between the AKI and Non-AKI groups, we discovered that the Non-AKI group contained a significantly greater number of Tregs than the AKI group. Additionally, the activation of signalling pathways, such as inflammatory molecules secretion, immune response, glycolytic metabolism, NOTCH, FGF, NF-κB and TLR4, was significantly greater in the AKI group than in the Non-AKI group. Additionally, analysis of single-cell sequencing data revealed that Tregs in patients with chronic kidney rejection and in normal kidney tissue have distinct biology, including immune activation, cytokine production, and activation fractions of signalling pathways such as NOTCH and TLR4. In this study, we found significant differences in the IME between AKI and Non-AKI, including differences in Tregs cells and activation levels of biologically significant signalling pathways. Tregs were associated with lower activity of signalling pathways such as inflammatory response, inflammatory molecule secretion, immune activation, glycolysis.
Keywords: Tregs; acute kidney injury; immune microenvironment; inflammatory.
© 2023 The Authors. Journal of Cellular and Molecular Medicine published by Foundation for Cellular and Molecular Medicine and John Wiley & Sons Ltd.
Conflict of interest statement
The authors declare that the research was conducted in the absence of any commercial or financial relationships that could be construed as a potential conflict of interest.
Figures
Similar articles
-
Single-cell analysis reveals immune landscape in kidneys of patients with chronic transplant rejection.Theranostics. 2020 Jul 11;10(19):8851-8862. doi: 10.7150/thno.48201. eCollection 2020. Theranostics. 2020. PMID: 32754283 Free PMC article.
-
Galectin 3 protects from cisplatin-induced acute kidney injury by promoting TLR-2-dependent activation of IDO1/Kynurenine pathway in renal DCs.Theranostics. 2019 Aug 14;9(20):5976-6001. doi: 10.7150/thno.33959. eCollection 2019. Theranostics. 2019. PMID: 31534532 Free PMC article.
-
Single-cell RNA sequencing reveals the transcriptomic landscape of kidneys in patients with ischemic acute kidney injury.Chin Med J (Engl). 2023 May 20;136(10):1177-1187. doi: 10.1097/CM9.0000000000002679. Epub 2023 Apr 20. Chin Med J (Engl). 2023. PMID: 37083129 Free PMC article.
-
Research Progress on Regulatory T Cells in Acute Kidney Injury.J Immunol Res. 2015;2015:174164. doi: 10.1155/2015/174164. Epub 2015 Jul 26. J Immunol Res. 2015. PMID: 26273681 Free PMC article. Review.
-
Physiological aspects of Toll-like receptor 4 activation in sepsis-induced acute kidney injury.Acta Physiol (Oxf). 2017 Mar;219(3):573-588. doi: 10.1111/apha.12798. Epub 2016 Oct 8. Acta Physiol (Oxf). 2017. PMID: 27602552 Free PMC article. Review.
Cited by
-
Advances in Nano-Immunomodulatory Systems for the Treatment of Acute Kidney Injury.Adv Sci (Weinh). 2025 May;12(17):e2409190. doi: 10.1002/advs.202409190. Epub 2025 Mar 27. Adv Sci (Weinh). 2025. PMID: 40145715 Free PMC article. Review.
-
Advance on Chinese Medicine for Hypertensive Renal Damage: Focus on the Complex Molecular Mechanisms.Chin J Integr Med. 2024 Oct;30(10):938-948. doi: 10.1007/s11655-024-3662-3. Epub 2024 Jul 3. Chin J Integr Med. 2024. PMID: 38958884 Review.
-
Lactate metabolism and acute kidney injury.Chin Med J (Engl). 2025 Apr 20;138(8):916-924. doi: 10.1097/CM9.0000000000003142. Epub 2024 May 27. Chin Med J (Engl). 2025. PMID: 38802283 Free PMC article. Review.
-
Targeting inerleukin-6 for renoprotection.Front Immunol. 2024 Dec 11;15:1502299. doi: 10.3389/fimmu.2024.1502299. eCollection 2024. Front Immunol. 2024. PMID: 39723211 Free PMC article. Review.
-
Mechanisms of Acute Kidney Injury-Chronic Kidney Disease Transition: Unraveling Maladaptive Repair and Therapeutic Opportunities.Biomolecules. 2025 May 29;15(6):794. doi: 10.3390/biom15060794. Biomolecules. 2025. PMID: 40563434 Free PMC article. Review.
References
-
- Hoste EAJ, Kellum JA, Selby NM, et al. Global epidemiology and outcomes of acute kidney injury. Nat Rev Nephrol. 2018;14:607‐625. - PubMed
LinkOut - more resources
Full Text Sources
