. 2023 Aug 30:16:3811-3822.
doi: 10.2147/JIR.S426337. eCollection 2023.

Serum Metabolomics Analysis of Skin-Involved Systemic Lupus Erythematosus: Association of Anti-SSA Antibodies with Photosensitivity

Affiliations

Serum Metabolomics Analysis of Skin-Involved Systemic Lupus Erythematosus: Association of Anti-SSA Antibodies with Photosensitivity

Dingqi Lu et al. J Inflamm Res. .

Abstract

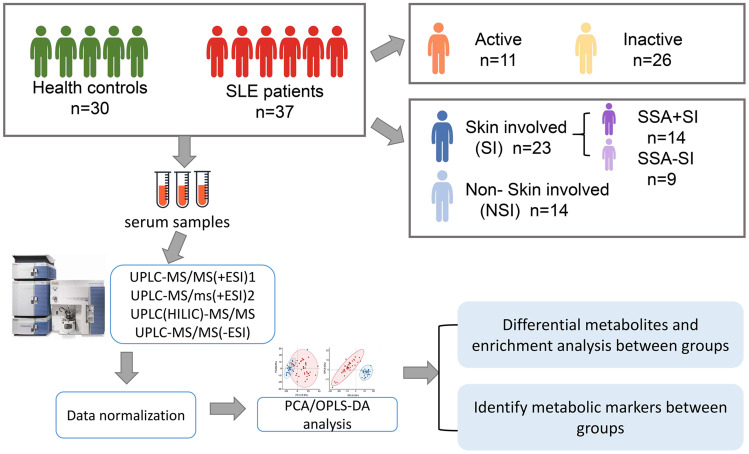
Purpose: Systemic lupus erythematosus is a heterogeneous autoimmune disease in which skin involvement is a common manifestation. It is currently thought that the photosensitivity of SLE skin involvement is associated with anti-SSA antibodies. This study aimed to expand the current state of knowledge surrounding the molecular pathophysiology of SLE skin photosensitivity through Serum metabolomics analysis.

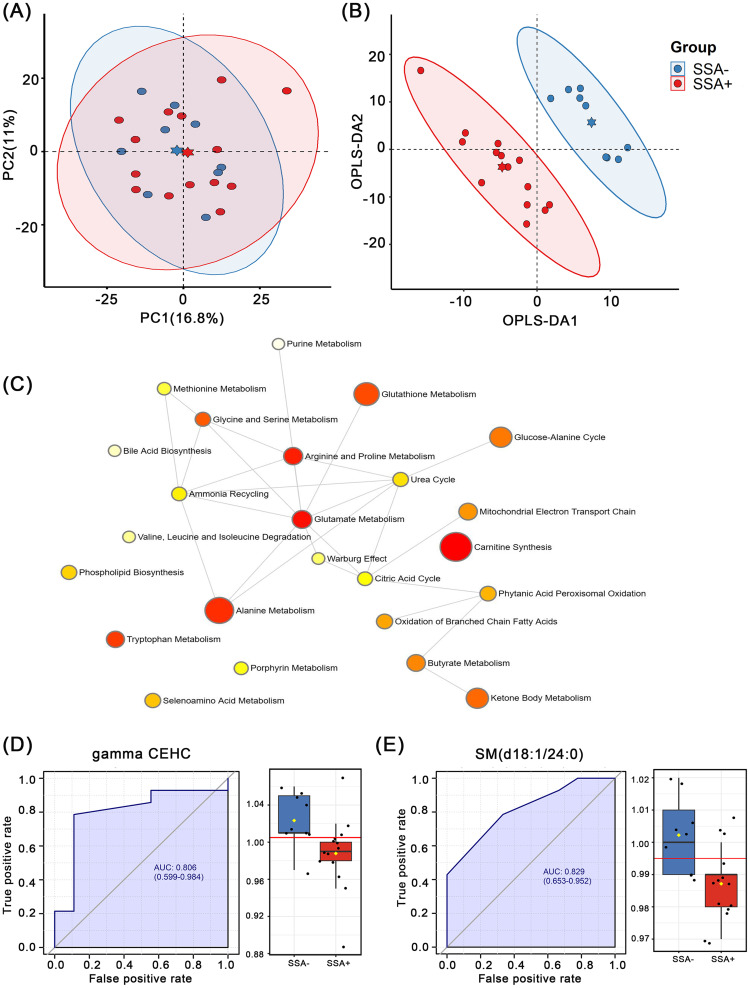
Patients and methods: The serum metabolites of 23 cases of skin-involved SLE (SI) group, 14 cases of no SI (NSI) group, and 30 cases of healthy controls (HC) were analyzed by using UPLC-MS/MS technology, and subgroup analysis was performed according to the expression of anti-SSA antibodies in SI. MetaboAnalyst 5.0 was used for enrichment analysis and ROC curve construction, identifying serum metabolic markers of skin-involved SLE associated with anti-SSA antibodies.

Results: We identified several metabolites and metabolic pathways associated with SLE photosensitivity. Two metabolites, SM (d18:1/24:0) and gamma-CEHC can distinguish between anti-SSA antibody-positive and negative SI, with AUC of 0.829 and 0.806. These two photosensitization-related substances may be potential markers of skin involvement in SLE associated with anti-SSA antibody.

Conclusion: This study provides new insights into the pathogenesis of SI patients, and provides a new molecular biological basis for the association between anti-SSA antibodies and skin photoallergic manifestations of SLE.

Keywords: anti-SSA antibodies; biomarkers; metabolomics; photosensitivity; systemic lupus erythematosus.


Conflict of interest statement

The authors report no conflicts of interest in this work.

Figures

Figure 1
Figure 1
The grouping design and analysis flowchart.
Figure 2
Figure 2
Serum metabolomic analysis between SLE group and HC group. (A) PCA analysis plot and (B) OPLS-DA analysis plot of SLE and HC. (C) Component composition of differential metabolites and (E) lipids. (D) The heat map shows 325 differential metabolites between SLE and HC. (F) Pathway enrichment map for 325 differential metabolites.
Figure 3
Figure 3
Serum metabolomic analysis between Active group and Inactive group. (A) PCA analysis plot and (B) OPLS-DA analysis plot of these two groups. (C) Component composition of differential metabolites and (E) lipids. (D) Pathway enrichment map for differential metabolites between these two groups. (F) Correlation analysis of differential metabolites and SLEDAI scores, 12 positive metabolites were selected based on Cor value and P value. ***P<0.001.
Figure 4
Figure 4
Serum metabolomic analysis between SI group and NSI group. The composition of (A) differential metabolites and (B) lipids between SI, NSI and HC. (C) Wayne diagram of differential metabolites between SI, NSI and HC, thus identifying 118 differential metabolites belonging to SI. (D) Pathway enrichment map of 118 differential metabolites. (E) ROC curves and (F) expression differences of N-acetylglutamine, N-acetylphenylalanine and fumarate between SI and NSI, HC. NS: P>0.05. * 0.01<P<0.05, **0.001<P<0.01, ***P<0.001.
Figure 5
Figure 5
Serum metabolomic analysis between SSA+SI group and SSA-SI group. (A) PCA analysis plot and (B) OPLS-DA analysis plot of these two groups. (C) Pathway enrichment plots for the 27 differential metabolites between these two groups. ROC curves of (D) gamma-CEHC and (E) SM (d18:1 / 24:0) and expression levels in these two groups.

Similar articles

Cited by

References

    1. Yafasova A, Fosbøl EL, Schou M, et al. Long-term cardiovascular outcomes in systemic lupus erythematosus. J Am Coll Cardiol. 2021;77(14):1717–1727. doi:10.1016/j.jacc.2021.02.029 - DOI - PubMed
    1. Zou YF, Feng CC, Zhu JM, et al. Prevalence of systemic lupus erythematosus and risk factors in rural areas of Anhui Province. Rheumatol Int. 2014;34(3):347–356. doi:10.1007/s00296-013-2902-1 - DOI - PubMed
    1. Kiriakidou M, Ching CL. Systemic lupus erythematosus. Ann Intern Med. 2020;172(11):Itc81–itc96. doi:10.7326/aitc202006020 - DOI - PubMed
    1. Tsokos GC. Autoimmunity and organ damage in systemic lupus erythematosus. Nat Immunol. 2020;21(6):605–614. doi:10.1038/s41590-020-0677-6 - DOI - PMC - PubMed
    1. Li M, Zhang W, Leng X, et al. Chinese SLE Treatment and Research group (CSTAR) registry: i. Major clinical characteristics of Chinese patients with systemic lupus erythematosus. Lupus. 2013;22(11):1192–1199. doi:10.1177/0961203313499086 - DOI - PubMed