. 2023 Sep 15;136(18):jcs261323.
doi: 10.1242/jcs.261323. Epub 2023 Sep 25.

Shock drives a STAT3 and JunB-mediated coordinated transcriptional and DNA methylation response in the endothelium

Affiliations

Shock drives a STAT3 and JunB-mediated coordinated transcriptional and DNA methylation response in the endothelium

Ramon Bossardi Ramos et al. J Cell Sci. .

Abstract

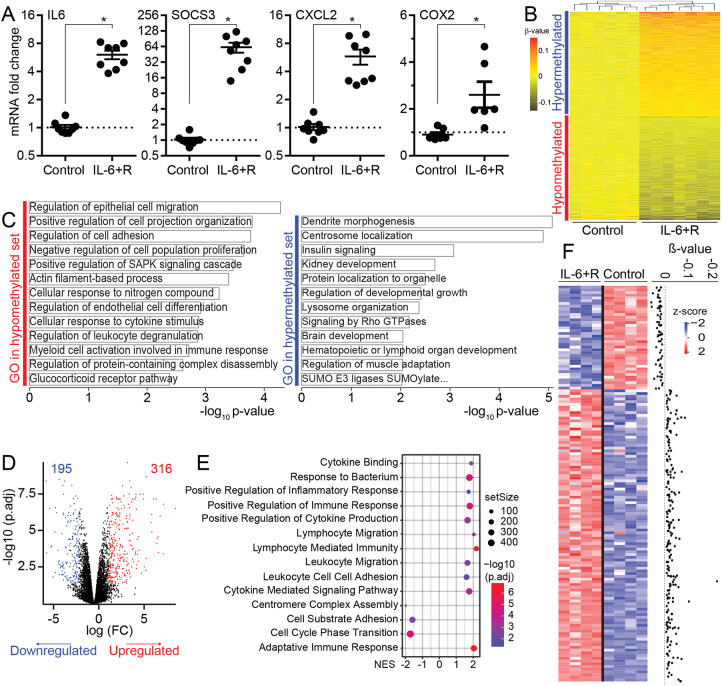
Endothelial dysfunction is a crucial factor in promoting organ failure during septic shock. However, the underlying mechanisms are unknown. Here, we show that kidney injury after lipopolysaccharide (LPS) insult leads to strong endothelial transcriptional and epigenetic responses. Furthermore, SOCS3 loss leads to an aggravation of the responses, demonstrating a causal role for the STAT3-SOCS3 signaling axis in the acute endothelial response to LPS. Experiments in cultured endothelial cells demonstrate that IL-6 mediates this response. Furthermore, bioinformatics analysis of in vivo and in vitro transcriptomics and epigenetics suggests a role for STAT, AP1 and interferon regulatory family (IRF) transcription factors. Knockdown of STAT3 or the AP1 member JunB partially prevents the changes in gene expression, demonstrating a role for these transcription factors. In conclusion, endothelial cells respond with a coordinated response that depends on overactivated IL-6 signaling via STAT3, JunB and possibly other transcription factors. Our findings provide evidence for a critical role of IL-6 signaling in regulating shock-induced epigenetic changes and sustained endothelial activation, offering a new therapeutic target to limit vascular dysfunction.

Keywords: DNA methylation; Endothelium; Inflammation; STAT3; Shock; Transcriptional.


Conflict of interest statement

Competing interests The authors declare no competing or financial interests.

Figures

Fig. 1.
Fig. 1.
LPS-induced DNA methylation changes in the mouse kidney endothelium are enriched in genes associated with inflammatory and epigenetic responses. (A) Severity score of mice 14 h after saline or LPS injection, mean±s.e.m. (n=3–4). *P<0.05 (Mann–Whitney U test). (B) The temperature for each mouse was measured immediately before and 14 h post-injection, mean±s.e.m. (n=3–4). P-value calculated with a Mann–Whitney U test. (C) Schematic of the experimental approach for isolating kidney endothelial cells. (D) Expression of the epithelial marker CDH1 and the endothelial marker VWF in endothelial versus total RNA from the same organ (two-tailed one-sample t-test versus a theoretical mean =1), mean±s.e.m. (n=7). (E) Volcano plot of differentially methylated positions CpG sites showing the P-value versus Δβ for control and LPS-treated mice. The red dots represent significantly hypomethylated CpGs, the blue dots represent significantly hypermethylated CpGs. (F) GO analysis of genes associated with differentially methylated CpG sites showing the most relevant enriched categories (blue mark for the hypermethylated set, and red mark for the hypomethylated set) processed via Metascape.
Fig. 2.
Fig. 2.
LPS-induced DNA methylation response in the kidney endothelium of mice lacking SOCS3 is associated with the activity of multiple TFs. (A) RT-qPCR of enriched endothelial cells showing the increased levels of IL6 and COX2 expression in SOCS3iEKO mice after LPS treatment. Mean±s.e.m. fold-change expressed versus WT control mice (n=3). *P<0.05 (unpaired two-tailed Student's t-test). (B) Volcano plot of differentially methylated positions CpG sites showing the P-value versus Δβ for LPS-treated WT and SOCS3iEKO mice. The red dots represent significantly hypomethylated CpGs, the blue dots represent significantly hypermethylated CpGs. (C) GO analysis of genes associated with SOCS3iEKO differentially methylated CpG sites showing the most relevant enriched categories (blue mark for the hypermethylated set, and red mark for the hypomethylated set) processed via Metascape. (D) TF motif analysis using HOMER of hypermethylated and hypomethylated gene subsets for LPS-treated WT and SOCS3iEKO mice.
Fig. 3.
Fig. 3.
The transcriptional response of HUVECs treated with IL-6+R is associated with changes in DNA methylation. (A) RT-qPCR of HUVECs treated with IL-6 or PBS for 72 h. Mean±s.e.m. fold change IL-6+R 72 h versus control. *P<0.05 (unpaired two-tailed Student's t-test). Data compiled from at least three independent experiments. (B) DNA methylation heatmap showing 431 differentially methylated CpG sites between cells treated or not for 72 h with IL-6+R. The heatmap includes all CpG-containing probes that display significant methylation changes at P<0.05. (C) GO analysis of genes associated with differentially methylated CpG sites showing the most relevant enriched categories, processed via Metascape (blue mark for the hypermethylated set, and red mark for the hypomethylated set). (D) Volcano plot. The red dots represent significantly upregulated genes, the blue dots represent significantly downregulated genes (|log2 FC|≥1.5 and adjusted P-value<0.05), and the black dots represent not significant differentially expressed genes. (E) GSEA of HUVECs treated with IL-6 or PBS for 72 h, using MSigDB hallmarks (H) as gene sets. Showing normalized enrichment score (NES) (FDR<0.05). (F) Gene expression heatmap (left) and differentially methylated CpG sites (right).
Fig. 4.
Fig. 4.
STAT3 activity and DNA methylation regulate gene expression in HUVECs treated for 72 h with IL-6+R. (A) DNA hypomethylation on the genes SERPINA3, NOSTRIN and PLCE1 after IL-6+R treatment are associated with increase gene expression and DNA hypermethylated genes TNFSF4 and NAV2 are associated with decrease in the gene expression in HUVECs treated or not with IL-6. Mean±s.e.m. *P<0.05 (two-way ANOVA and Sidak's post-hoc test for IL-6+R versus control for each time point). (B) HUVECs treated with 5-AZA for 72 h show an increased gene expression for the genes SERPINA3, NOSTRIN, PLCE1 and TNFSF4. Mean±s.e.m. *P<0.05; ns, not significant (unpaired two-tailed Student's t-test). (C) STAT3 knockdown using siRNA (siSTAT3) was evaluated by RT-qPCR in HUVECs treated or not with IL-6 for 72 h with or without siRNA against STAT3. A non-targeting sequence (NTS) siRNA was used as control. Mean±s.e.m. *P<0.05; ns, not significant (two-way ANOVA and Sidak's post-hoc test). All data compiled from at least three independent experiments.
Fig. 5.
Fig. 5.
Changes in the endothelial methylome remain in place for prolonged periods in HUVECs. (A) Schematic diagram depicting in vitro experiments for IL-6 washout. (B) DNA methylation heatmap showing differentially methylated CpGs that are retained after IL-6 washout. Groups of rows in B correspond to the treatment shown in A. Values are expressed as Δβ values (versus PBS control). (C) Cells were treated with the indicated amounts of IL-6+R for 72 h and washed for 96 h prior to lysis. Phosphorylated STAT3 and β-actin levels were measured by western blotting. Mean±s.e.m. AU, arbitrary units. Full uncropped images of blots shown in this paper are presented in Fig. S2. (D) Cells were treated as in C prior to RNA extraction. IL-6 expression levels were measured by RT-qPCR. GAPDH was used for normalization. Mean±s.e.m. *P<0.05; ns, not significant (two-way ANOVA and Sidak's post-hoc test IL-6+R versus control for each time point). All data compiled from at three independent experiments.
Fig. 6.
Fig. 6.
Multiple TFs are enriched in the gene sets that are differentially methylated or differentially expressed upon sustained IL-6+R signaling. (A) TF motif analysis of hypermethylated and hypomethylated gene subsets between cells treated or not for 72 h with IL-6+R. The TF family and factor motif logo is representative of the TF family (for selected TFs with P≤10−5 for hypermethylated and hypomethylation regions). (B) TF motif analysis of differentially methylated CpG between IL-6 for 72 h and 96 h wash. The TF family and factor motif logo is representative of the TF family (for selected TFs with P≤10−5 for hypermethylated and hypomethylation regions). (C) Selected TF activities inferred with DoRothEA from gene expression in HUVECs treated with IL-6 for 72 h. Showing normalized enrichment score (NES).
Fig. 7.
Fig. 7.
JunB is required for IL-6+R-induced gene expression changes. (A) JunB RT-qPCR of HUVECs treated with IL-6 or PBS. Mean±s.e.m. fold change Il-6+R versus control. *P<0.05; ns, not significant (two-way ANOVA and Sidak's post-hoc test IL-6+R versus control for each time point). (B) Cells were treated with the indicated amounts of IL-6+R prior to lysis. JunB levels were measured by western blotting. Mean±s.e.m. *P<0.05; ns, not significant (one-way ANOVA and Dunnett's post-hoc test for each time point versus control). (C) Immunofluorescence staining of HUVECs treated with IL-6 and soluble IL-6Rɑ (IL-6+R) as an inducer of acute inflammation versus PBS control. HUVECs were treated on 3 h, 6 h and 24 h timepoints. Following treatment, cells were fixed, stained with anti-JunB (green), anti-VE-cadherin (red) and DAPI (blue). Scale bars: 50 µm. (D) JunB RT-qPCR of HUVECs treated with IL-6 after transfection with either a non-targeting sequence (NTS) or siRNA against STAT3. The dotted line represents the average expression of PBS-treated cells. Mean±s.e.m. *P<0.05 (Mann–Whitney U test). (E) JunB knockdown using siRNA was evaluated by western blotting. NTS siRNA were used as control. Mean±s.e.m. *P<0.05 (two-tailed one-sample t-test versus a theoretical mean=1). (F) Gene expression for SOCS3, COX2 and PCDH17 in HUVECs treated or not with IL-6 for 72 h with or without siRNA against JunB. Mean±s.e.m. *P<0.05; ns, not significant (two-way ANOVA and Sidak's post-hoc test). All data compiled from at least three independent experiments.
Fig. 8.
Fig. 8.
Loss of SOCS3 in the kidney endothelium leads to altered gene expression that is associated with TF activation and DNA methylation. (A) Heatmap and unbiased clustering from all genes induced or inhibited >1.5-fold by LPS (4842 genes, log scale of expression levels). (B) Volcano plot. The red dots represent significantly upregulated genes, the blue dots represent significantly downregulated genes (|log2 FC|≥2 and FDR<0.05), and the black dots represent insignificant differentially expressed genes. (C) GO analysis of genes associated with SOCS3iEKO DEG showing the most relevant enriched categories (blue mark for the downregulated genes, and red mark for the upregulated genes). (D) Selected TF activities inferred with DoRothEA from gene expression in SOCS3iEKO kidney endothelium mice after LPS treatment. (E) Correlation analysis between gene expression and DNA methylation changes. The x-axis is the log2 fold change of gene expression between LPS-treated WT and SOCS3iEKO mice. The y-axis is the Δβ-value of the DNA methylation change of mapped genes. (F) Correlation between DNA methylation changes (heatmap) and mRNA expression (bar plot).

References

    1. Alsaffar, H., Martino, N., Garrett, J. P. and Adam, A. P. (2018). Interleukin-6 promotes a sustained loss of endothelial barrier function via Janus kinase-mediated STAT3 phosphorylation and de novo protein synthesis. Am. J. Physiol. Cell Physiol. 314, C589-C602. 10.1152/ajpcell.00235.2017 - DOI - PubMed
    1. Aryee, M. J., Jaffe, A. E., Corrada-Bravo, H., Ladd-Acosta, C., Feinberg, A. P., Hansen, K. D. and Irizarry, R. A. (2014). Minfi: a flexible and comprehensive Bioconductor package for the analysis of Infinium DNA methylation microarrays. Bioinformatics 30, 1363-1369. 10.1093/bioinformatics/btu049 - DOI - PMC - PubMed
    1. Assenov, Y., Muller, F., Lutsik, P., Walter, J., Lengauer, T. and Bock, C. (2014). Comprehensive analysis of DNA methylation data with RnBeads. Nat. Methods 11, 1138-1140. 10.1038/nmeth.3115 - DOI - PMC - PubMed
    1. Atsaves, V., Leventaki, V., Rassidakis, G. Z. and Claret, F. X. (2019). AP-1 transcription factors as regulators of immune responses in cancer. Cancers 11, 1037. 10.3390/cancers11071037 - DOI - PMC - PubMed
    1. Bibikova, M., Barnes, B., Tsan, C., Ho, V., Klotzle, B., Le, J. M., Delano, D., Zhang, L., Schroth, G. P., Gunderson, K. L.et al. (2011). High density DNA methylation array with single CpG site resolution. Genomics 98, 288-295. 10.1016/j.ygeno.2011.07.007 - DOI - PubMed

Publication types