. 2023 Sep 1;10(Pt 5):521-543.
doi: 10.1107/S2052252523006449.

Facing the phase problem

Affiliations

Facing the phase problem

Wayne A Hendrickson. IUCrJ. .

Abstract

The marvel of X-ray crystallography is the beauty and precision of the atomic structures deduced from diffraction patterns. Since these patterns record only amplitudes, phases for the diffracted waves must also be evaluated for systematic structure determination. Thus, we have the phase problem as a central complication, both intellectually for the field and practically so for many analyses. Here, I discuss how we - myself, my laboratory and the diffraction community - have faced the phase problem, considering the evolution of methods for phase evaluation as structural biology developed to the present day. During the explosive growth of macromolecular crystallography, practice in diffraction analysis evolved from a universal reliance on isomorphous replacement to the eventual domination of anomalous diffraction for de novo structure determination. As the Protein Data Bank (PDB) grew and familial relationships among proteins became clear, molecular replacement overtook all other phasing methods; however, experimental phasing remained essential for molecules without obvious precedents, with multi- and single-wavelength anomalous diffraction (MAD and SAD) predominating. While the mathematics-based direct methods had proved to be inadequate for typical macromolecules, they returned to crack substantial selenium substructures in SAD analyses of selenomethionyl proteins. Native SAD, exploiting the intrinsic S and P atoms of biomolecules, has become routine. Selenomethionyl SAD and MAD were the mainstays of structural genomics efforts to populate the PDB with novel proteins. A recent dividend has been paid in the success of PDB-trained artificial intelligence approaches for protein structure prediction. Currently, molecular replacement with AlphaFold models often obviates the need for experimental phase evaluation. For multiple reasons, we are now unfazed by the phase problem. Cryo-EM analysis is an attractive alternative to crystallography for many applications faced by today's structural biologists. It simply finesses the phase problem; however, the principles and procedures of diffraction analysis remain pertinent and are adopted in single-particle cryo-EM studies of biomolecules.

Keywords: anomalous diffraction; density modification; direct methods; isomorphous replacement; molecular replacement.


Figures

Figure 1
Figure 1
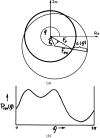
The atomic scattering factor describes the coherent scattering of X-rays from a given atom. This has two additive components (equation 1): the normal component, f 0, from Thomson scattering decreases smoothly with the Bragg angle θ but has no intrinsic dependence on the wavelength, and the anomalous component, f Δ, from resonance with electron transitions has a sharp dependence on the wavelength λ near absorptive transitions but is nearly constant with respect to the scattering angle. Adapted from Box 1 of Hendrickson (1991 ▸) with permission from AAAS.
Figure 2
Figure 2
Harker phasing diagrams illustrating the phase ambiguity inherent in SIR phasing (a) and SAD phasing (c), and its resolution by two derivatives in MIR (b) or by SIRAS (d). The ‘native’ amplitude circles (heavy lines) each have radius |F P|. The single isomorphous pair from SIR derivative 1 yields options at Q or R, whereas derivative 2 gives alternatives Q and R′. The anomalous scattering from derivative 1 gives alternatives Q and Q′. Neglecting experimental error, in principle either MIR or SIRAS resolves the phase ambiguity. Adapted from Figs. 4 and 6 of Hendrickson (1981 ▸) with permission from Macmillan.
Figure 3
Figure 3
The phase probability analysis of Blow & Crick (1959 ▸) by lack-of-closure error ɛ(φ), equations (7) and (8). (a) Harker diagram illustrating the lack-of-closure error. (b) Phase probability associated with the single isomorphous derivative in (a). Reproduced from Fig. 5 of Hendrickson (1981 ▸) with permission from Macmillan.
Figure 4
Figure 4
SAD phasing structural analysis of crambin. (a) A portion of what would now be called the sulfur SAD map for crambin at 1.5 Å resolution. The densest features are at S atoms. (b) The same portion as in (a) for the final 2F oF c map after refinement to R = 0.104 at 1.5 Å resolution. (c) All-atom atomic model of crambin drawn by Irving Geis. S atoms are colored yellow and the first helix is filled in blue. (a) and (b) are adapted from Fig. 2 of Hendrickson & Teeter (1981 ▸) with permission from Springer Nature, and (c) is adapted from a drawing by Irving Geis with permission from the Howard Hughes Medical Institute, which now owns the Geis collection.
Figure 5
Figure 5
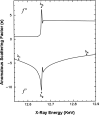
Anomalous scattering-factor spectra at the Se K edge of selenomethionyl human chorionic gonadotropin, derived from fluorescence measurement from a crystal as fitted with Kramers–Kronig transformation to theoretical selenium factors outside the range 12.648–12.676 keV. Adapted from Fig. 11 of Wu et al. (1994 ▸) with permission from Elsevier.
Figure 6
Figure 6
Comparison of sharp anomalous scattering spectra at M, L and K edges. (a) Resonance features at the M V and M IV absorption edges of uranyl nitrate (Liu et al., 2001 ▸). Wavelength positions at the M V edge are marked by red lines. (b) Spectrum of the f′′ component of Yb L III anomalous scattering from ytterbium-derivatized N-cadherin D1 (Shapiro et al., 1995 ▸). (c) Direct at-scale comparison of the U M V edge, Y L III edge and Se K edge in Figs. 6 ▸(a), 6 ▸(b) and 5 ▸, respectively. The U M IV, Yb L III and Se K edge energies are on a linear scale of X-ray energy. (a) and (c) are reproduced from Liu et al. (2001 ▸) with permission from the National Academy of Sciences. Copyright (2001) National Academy of Sciences. (b) is reproduced from Shapiro et al. (1995 ▸) with permission from Springer Nature.
Figure 7
Figure 7
Molecular drawings of selected early MAD-phased structures. (a) Streptavidin complexed with selenobiotin (Hendrickson et al., 1989 ▸). (b) Selenomethionyl ribonuclease H from E. coli (Yang et al., 1990 ▸). (c) Lectin domain from rat mannose-binding protein (Weis et al., 1991 ▸). (d) Human glycoprotein hormone chorionic gonadotropin (Wu et al., 1994 ▸). (e) Tyrosine kinase domain of the human insulin receptor (Hubbard et al., 1994 ▸). (f) Adhesive domain CD1 of murine N-cadherin (Shapiro et al., 1995 ▸). Adapted with permission from AAAS (b) and (c), Elsevier (d) and Springer Nature (e, f).
Figure 8
Figure 8
Validation of the accuracy of MAD-phased electron density. Two segments are shown from electron-density maps of the DnaK SBD (Zhu et al., 1996 ▸): a bound substrate peptide (top) and strand β3 (bottom). The direct experimental map at 2.3 Å resolution (no density modification) is shown in (a) and the 2F oF c map after refinement at 2.0 Å resolution is shown in (b). The refined atomic model is superimposed onto the maps in both (a) and (b). Reproduced from Zhu et al. (1996 ▸) with permission from AAAS.
Figure 9
Figure 9
Schematic diagram of phase evaluation from MAD data, Bijvoet mates at multiple wavelengths {|λ Fh)|2}, by two alternative approaches. Algebraic analysis by MADLSQ deduces |0 F T|, |0 F A| and Δφ = 0φT0φA for each reflection, from which {|0 F A|} generates the substructure of anomalous scatterers {±r A}. When taken in the correct hand, this solves the phase problem. In the phase probability pathway of MADABCD, the average of {|λ Fh)|2} provides an estimate for |0 F T|, the peak Bijvoet differences {λΔF ±h } yield {±r A}, and these observations form the basis for computing the joint probability P(|0 F T|, 0φA|), an example of which is shown in the inset.
Figure 10
Figure 10
Enantiomorph definition. Alternative electron-density maps at 2.3 Å resolution are shown from the analysis of the DnaK SBD (Zhu et al., 1996 ▸). One is based on phases from the substructure {+r A}, as deduced by Patterson analysis from {|0 F A|} values, and the other is based on the alternative {−r A} where the z coordinates of the projection are reversed and equivalent slabs are shown. Interpretable protein features and appropriately featureless solvent expanses characterize the correct alternative on the right.
Figure 11
Figure 11
SAD ambiguity resolution from density modification. Examples are taken from the sulfur SAD analysis of DnaK–ATP (Liu et al., 2013 ▸). (a) Phase probability distributions for a particular reflection as evaluated in Phaser from SAD combined with the S-atom partial structure (red) and after using DM for density modification that excluded molecular averaging. (b) A portion of the electron-density distribution phased from SAD combined with the sulfur partial structure. (c) The same portion of the map after density modification.
Figure 12
Figure 12
Profile of correlation coefficients (CCs) from SHELXD for the sulfur substructure in the SAD analysis of DnaK–ATP (Liu et al., 2013 ▸). The distribution of CCall versus CCweak values is shown for 10 000 trials; the 36 successful solutions are colored red and the 99.6% random results are shown in blue. Reproduced from Fig. 5(f) of Liu et al. (2013 ▸).
Figure 13
Figure 13
Dependence of transmitted anomalous signals on crystal thickness and X-ray energy. Water is taken to approximate the absorptivity of a typical macromolecular crystal, and we plot the transmitted f′′ anomalous signal from sulfur as a function of energy and thickness. The red line shows the ridge of maximal signal in this parameter space. This presentation is adapted from data presented in Fig. 2 of Liu et al. (2013 ▸).
Figure 14
Figure 14
Sulfur substructures from native SAD analyses. (a) Ribbon diagram of the TorT–TorSS ligand–histidine kinase complex showing the 28 S atoms (yellow) and three sulfate ions (yellow with red O atoms) used to define 1148 ordered protein residues. This structural analysis was performed at 7 keV [f′′(S) = 0.73 electrons]. (b) Cα backbone model of bovine trypsin showing the 16 peaks above 6σ in a Bijvoet difference map. A calcium ion has a peak height of 47σ and the sulfur peaks range from 9.6σ to 18.9σ. The peaks from calcium (Ca2+) and sulfate ( formula image ) ions and from two methionine S atoms (Met) are labeled. The other 12 peaks are in disulfide-bridged pairs. This structural analysis was performed at 12.7 keV [f′′(S) = 0.235 electrons]. (a) was adapted from Fig. 9(d) of Liu et al. (2013 ▸).
Figure 15
Figure 15
Changing practice in macromolecular structure determination. (a) De novo PDB depositions. Fractional contributions are shown, year by year, from isomorphous replacement, MIR (red) and SIR (pink), compared with anomalous diffraction, MAD (green) and SAD (chartreuse), and with ab initio methods (blue). We parsed depositor declarations to the PDB from 1997 through 10 December 2013, counting multiple declarations into each. The orange line traces the total number of de novo depositions with time. (b) Pie charts of the major categories of PDB depositions (de novo, MR for molecular replacement and IV for isomorphous variant) in 1999 and in 2013. The area of each pie is proportional to the total number of depositions in that year. The division between MR and IV is from the MS2000 curation for 1999 and was hand curated from 67% declared as MR to 44% being in a novel lattice. (a) is reproduced from Hendrickson (2014 ▸) with permission from Cambridge University Press.

Similar articles

Cited by

References

    1. Abbe, E. (1873). Arch. Mikrosk. Anat. 9, 413–468.
    1. Abrahams, J. P. & Leslie, A. G. W. (1996). Acta Cryst. D52, 30–42. - PubMed
    1. Akey, D. L., Terwilliger, T. C. & Smith, J. L. (2016). Acta Cryst. D72, 296–302. - PMC - PubMed
    1. Als-Nielsen, J. & McMorrow, D. (2011). Elements of Modern X-ray Physics, 2nd ed. Chichester: John Wiley & Sons.
    1. Assur Sanghai, Z., Liu, Q., Clarke, O. B., Belcher-Dufrisne, M., Wiriyasermkul, P., Giese, M. H., Leal-Pinto, E., Kloss, B., Tabuso, S., Love, J., Punta, M., Banerjee, S., Rajashankar, K. R., Rost, B., Logothetis, D., Quick, M., Hendrickson, W. A. & Mancia, F. (2018). eLife, 7, e27829. - PMC - PubMed

Substances