. 2023 Dec;15(2):2249146.
doi: 10.1080/19490976.2023.2249146.

Gut microbiota from patients with COVID-19 cause alterations in mice that resemble post-COVID symptoms

Affiliations

Gut microbiota from patients with COVID-19 cause alterations in mice that resemble post-COVID symptoms

Viviani Mendes de Almeida et al. Gut Microbes. 2023 Dec.

Abstract

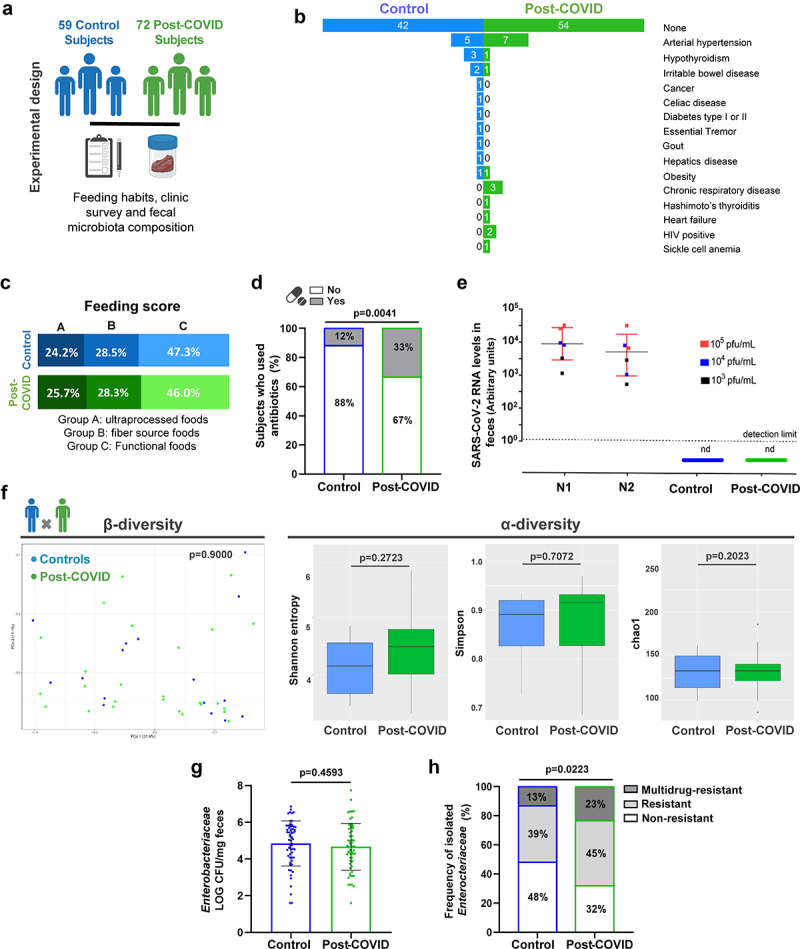
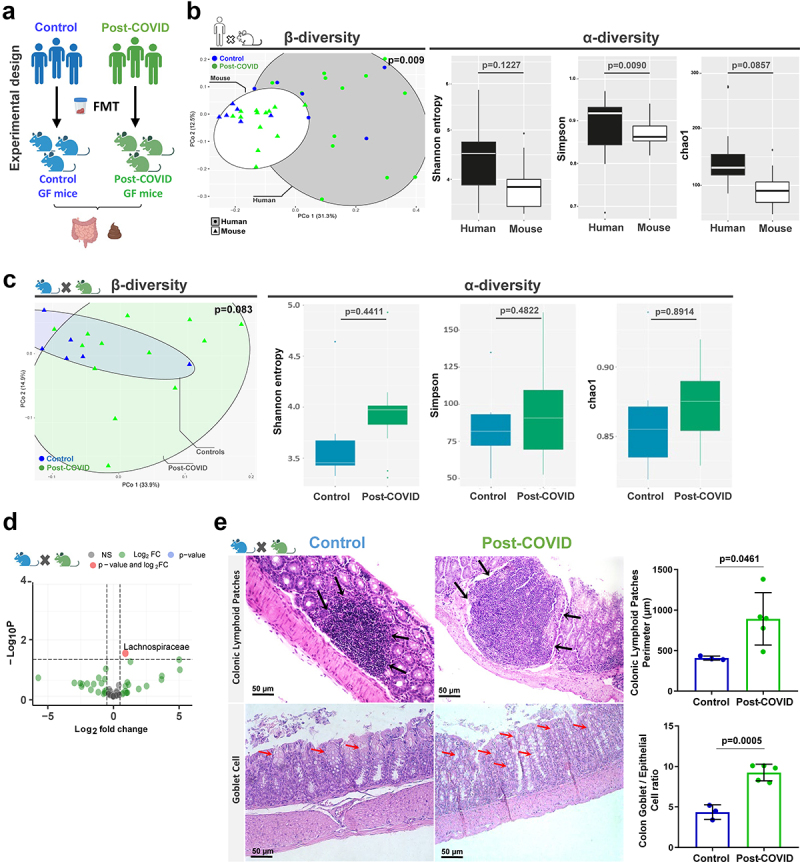
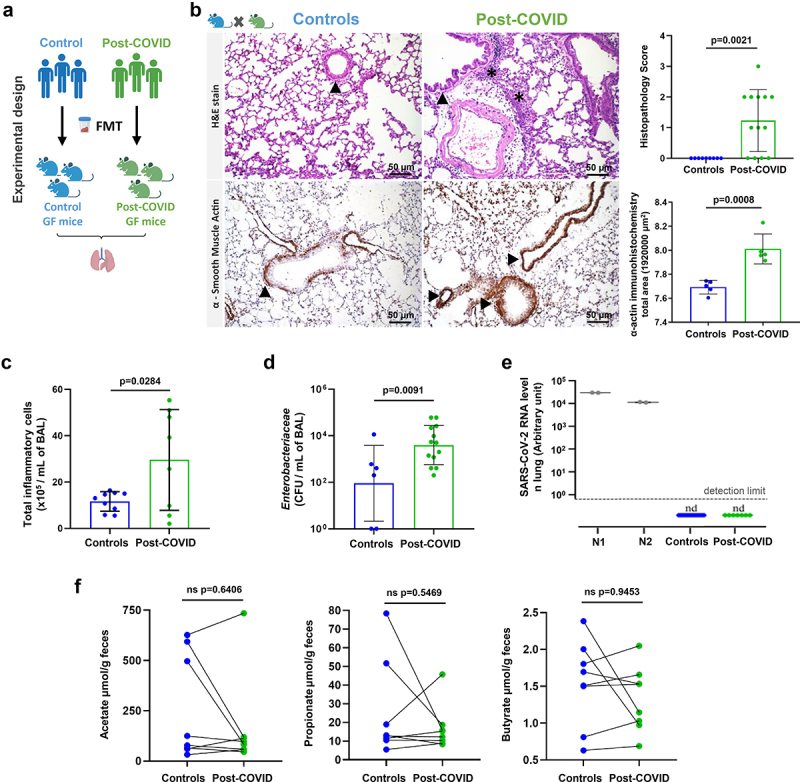
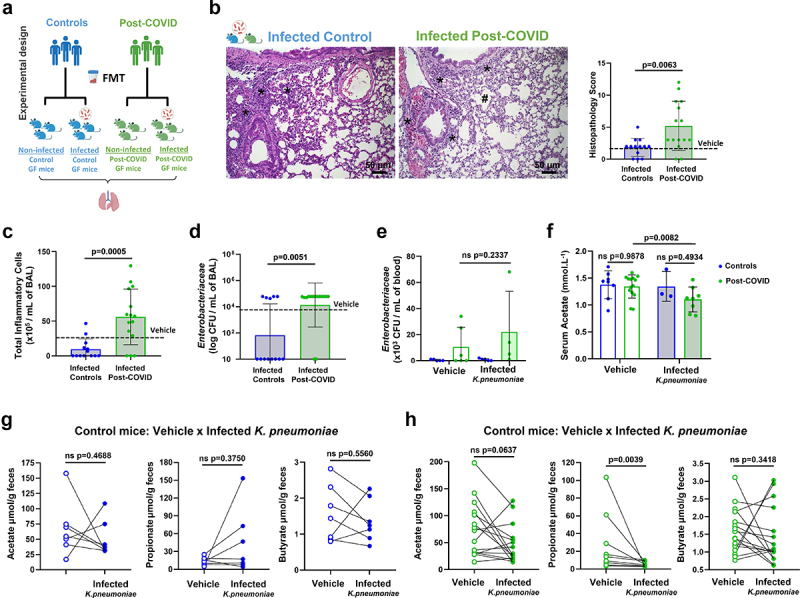
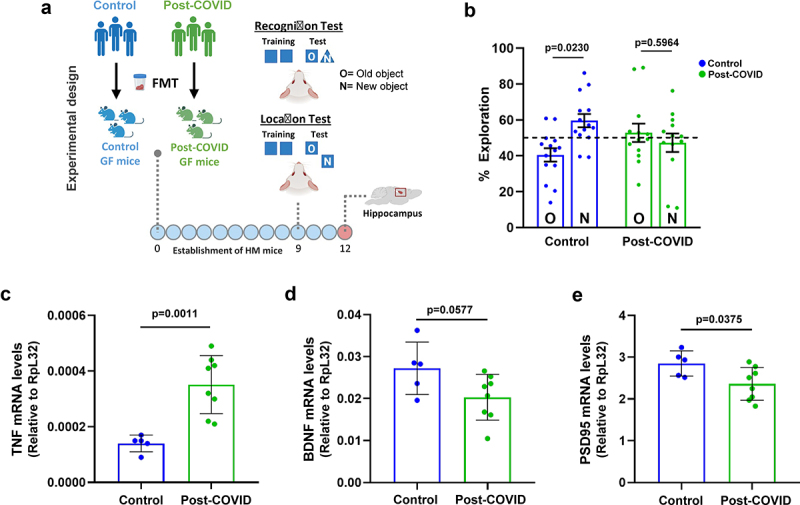
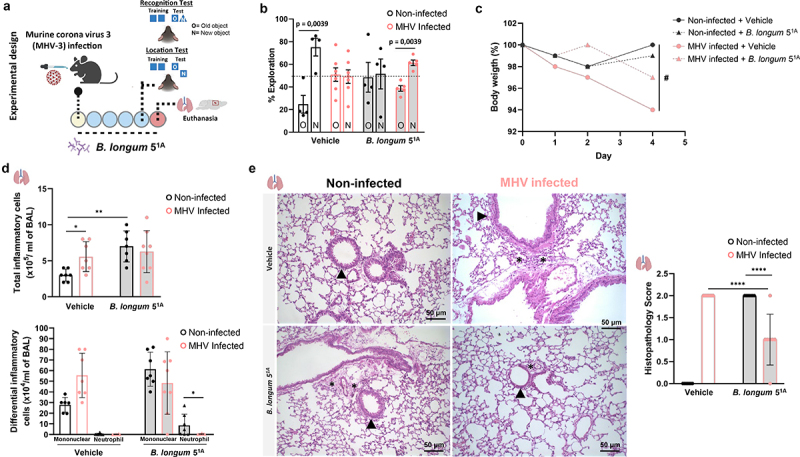
Long-term sequelae of coronavirus disease (COVID)-19 are frequent and of major concern. Severe acute respiratory syndrome coronavirus 2 (SARS-CoV-2) infection affects the host gut microbiota, which is linked to disease severity in patients with COVID-19. Here, we report that the gut microbiota of post-COVID subjects had a remarkable predominance of Enterobacteriaceae strains with an antibiotic-resistant phenotype compared to healthy controls. Additionally, short-chain fatty acid (SCFA) levels were reduced in feces. Fecal transplantation from post-COVID subjects to germ-free mice led to lung inflammation and worse outcomes during pulmonary infection by multidrug-resistant Klebsiella pneumoniae. transplanted mice also exhibited poor cognitive performance. Overall, we show prolonged impacts of SARS-CoV-2 infection on the gut microbiota that persist after subjects have cleared the virus. Together, these data demonstrate that the gut microbiota can directly contribute to post-COVID sequelae, suggesting that it may be a potential therapeutic target.

Keywords: COVID-19; SARS-CoV-2; antimicrobial-resistance; inflammation; microbiota; post-COVID.


Conflict of interest statement

No potential conflict of interest was reported by the author(s).

Figures

Figure 1.
Figure 1.
Clinical characteristics and food habits were associated with gut microbiota composition and an antimicrobial resistance profile in Enterobacteriaceae species of post-COVID and control human subjects. (a) experimental design: collection of feeding habits, clinic survey, and fecal microbiota composition analysis of 59 control and 72 post-COVID subjects (N = 131). (b) Co-morbidities in control and post-COVID groups. (c) feeding composition (N = 131). (d) antibiotic-treated control and post-COVID subjects (N = 131). (e) SARS-CoV-2 quantification by RT-qPCR in the feces of control and post-COVID subjects, a.U.: arbitrary units (N = 131). (f) 16S rRNA sequencing of gut microbiota from control and post-COVID subjects at the family level (N = 44). Principal Component analysis based on weighted Unifrac distances (p = 0.900), a β-diversity index (N = 44). α-diversity analysis based on Shannon, Simpson, and Chao1 indexes (N = 44). (g) Enterobacteriaceae quantification in fecal samples of the subjects (N = 131). (H) Frequency of Enterobacteriaceae strains present in the fecal samples of human subjects as multidrug-resistant, resistant, or nonresistance (N = 131). Statistical analysis: Fisher’s exact test was used in D, Wilcoxon and PerMANOVA pairwise tests were used in F, unpaired Student’s t-test was used in G, and Chi-square test was used in H. Data are shown as mean and standard deviation (SD). See also Figure S1.
Figure 2.
Figure 2.
Control and post-COVID fecal microbiota transplant and effects on the gut of post-COVID mice. (a) experimental design: control (N = 8) and post-COVID (N = 14) mice received fresh feces from donors, and then analyzes of the gut microbiota and colon histology were performed 12 days after FMT. (b) 16S rRNA sequencing and comparison of the gut microbiota composition between human donor and mouse that received FMT. Principal Component analysis based on weighted Unifrac distances, a β-diversity index. α-diversity analysis based on Shannon, Simpson, and Chao1 indexes (donors N = 19; mice N = 19). (c) 16S rRNA sequencing of gut microbiota of control and post-COVID mice after FMT. β-diversity and α-diversity (N = 19). (d) Differential bacterial abundance in feces of control and post-COVID mice, Lachonospiraceae (p = .0300) (N = 19). (e) histological alterations in the large intestine in mice that received FMT. Black arrows indicate increases in Colonic lymphoid patches (N = 8). Red arrows Graphs showing the Colonic lymphoid patches Perimeter and the ratio between Goblet cells and epithelial cells in the colon. Statistical analysis: Wilcoxon test was used in B and C, PerMANOVA pairwise test was used in B and C, unpaired Student’s-t test was used in D, and Wald test was used in E. Data are shown as mean and standard deviation (SD). All results are representative of three independent experiments. See also Figure S2.
Figure 3.
Figure 3.
Post-COVID gut microbiota induce lung alterations in HM mice. (a) experimental design: germ-free mice received fresh feces from control (N = 8) or post-COVID (N = 14) donors and lung tissue and bronchoalveolar lavage were assessed 12 days after FMT. (b) H&E staining: the histopathological lung alterations induced by FMT to HM GF mice. Graph showing the histopathological score of airways, vascular and parenchymal inflammation in control and post-COVID mice lungs. Arrowheads indicate lung airways. Asterisks indicate inflammatory infiltrates. Scale bar: 50 µm. 20X objective (N = 22). α-SMA immune-staining: lung samples from HM GF mice and graph showing the morphometrical analysis of muscular layer changes. Ten images of the muscular layer of each animal were acquired with a 40X objective. Arrowheads indicate the immunostained area (N = 10). (c) total number of cells in bronchoalveolar lavage (N = 19). (d) cultivable Enterobacteriaceae load in bronchoalveolar lavage (N = 19). (e) RT-qPCR for SARS-CoV-2 in the lungs of control and post-COVID mice (N = 22). (f) paired analysis of feces acetate, propionate, and butyrate levels in control and post-COVID HM GF mice (N = 16). Statistical analysis: unpaired Student’s t-test was used in B, C and D. Wilcoxon matched-pairs signed rank test was used in F. Data are shown as mean and standard deviation (SD). All results are representative of three independent experiments.
Figure 4.
Figure 4.
FMT from post-COVID patients impacts the gut-lung axis and increases susceptibility to K. pneumoniae B31 lung infection. (a) experimental design: germ-free mice received fresh feces from control or post-COVID donors and were infected with K. pneumoniae B31 (K. pneumoniae: control N = 13, post-COVID N = 15) or received saline (vehicle), and lung tissue, bronchoalveolar lavage and serum SCFAs levels were assessed. (b) histological alterations in the lung of post-COVID mice infected by K. pneumoniae B31 and a graph showing the histopathological score of the airway, vascular and parenchymal inflammation in control and post-COVID mice lungs (N = 28). Asterisks indicate inflammatory infiltrates. Hash marks areas of emphysema. Scale bar: 50 μm. 20X and 40X objective. (c) total number of inflammatory cells in bronchoalveolar lavage (BAL) (N = 28). (d) total numbers of Enterobacteriaceae in BAL (N = 28) and (e) blood (N = 28). (f) serum acetate levels (mmol.L−1) in vehicle and K. pneumonia-infected HM mice (N = 33). (g) paired analysis of fecal acetate, propionate, and butyrate levels between vehicle and infected mice that received feces from the same control donor (N = 14). (h) paired analysis of fecal acetate, propionate, and butyrate levels between vehicle and infected mice that received feces from the same post-COVID donor (N = 30). Statistical analysis: unpaired Student’s t-test was used in B and C, Mann-Whitney test was used in D. Two-way ANOVA with Tukey’s tests was used in E and F. Wilcoxon matched pairs signed rank test was used in G and H. Data are shown as mean and standard deviation (SD). All results are representative of three independent experiments.
Figure 5.
Figure 5.
FMT from post-COVID patients induces cognitive alterations in HM mice. (a) experimental design: germ-free mice received fresh feces from control (N = 14) or post-COVID (N = 15) donors, and underwent cognition (object location and recognition) tests nine days later. Following behavioral analysis, their hippocampus was subjected to mRNA expression. (b) percentage of exploration time for the new object (N) or the one remaining unmoved (O) in the location test relative to a total exploration time (N = 29) 9 days after FMT. Quantification of the expression, by RT-qPCR, of (c) TNF (N = 13), (d) BDNF (N = 13), and (e) PSD95 (N = 13) in the hippocampus 12 days after FMT. Statistical analysis: One sample t test against the hypothetical value of 50% and unpaired Student’s t test was used in B. Data are shown as mean and standard deviation (SD). All results are representative of two independent experiments.
Figure 6.
Figure 6.
The mouse model of MHV-3 infection showed memory impairment in object recognition and location tests, and treatment with B. longum 51A reversed the cognitive alterations. (a) experimental design: C57BL/6 non-infected and MHV-3 infected and treated with probiotic B. longum 51A (vehicle: non-infected N = 4; MHV-3 infected N = 7; B. longum 51A: non-infected N = 4; MHV-3 infected N = 5), and subjected to behavioral (object location and recognition) tests 4 days later. (b) percentage of exploration time for the new object (N) or the one remaining unmoved (O) in the location test relative to a total exploration time (N = 20). (c) Body mass over time was measured daily throughout the experiment. (# significant main effect of MHV infection) (N = 29). (d) total number of inflammatory cells in bronchoalveolar lavage (BAL) (N = 29). Differential inflammatory cells number in bronchoalveolar lavage (BAL) (N = 29). (e) H&E staining: histological alterations in the lung of MHV-3 infected mice and treated with probiotic B. longum 51A. Graph showing the histopathological score of the airway, vascular and parenchymal inflammation in control and post-COVID mice lungs (N = 29). Arrowheads indicate lung airways. Asterisks indicate inflammatory infiltrates. Scale bar: 50 μm. 20X objective. Statistical analysis: One sample t-test against the hypothetical value of 50% was used in B. Three-way repeated measures ANOVA with Tukey’s test was used in C. Two-way ANOVA with Student-Newman-Keuls test was used in D and E. Data are shown as mean and standard deviation (SD).

Similar articles

Cited by

References

    1. World Health Organization . COVID-19 weekly epidemiological update, 16 March 2023. 134th ed. 2023. https://apps.who.int/iris/handle/10665/366534.
    1. Augustin M, Schommers P, Stecher M, Dewald F, Gieselmann L, Gruell H, Horn C, Vanshylla K, Di Cristanziano V, Osebold L.. Post-COVID syndrome in non-hospitalised patients with COVID-19: a longitudinal prospective cohort study. Lancet Reg Heal. 2021;6:100122. doi:10.1016/j.lanepe.2021.100122. - DOI - PMC - PubMed
    1. Lopez-Leon S, Wegman-Ostrosky T, Perelman C, Sepulveda R, Rebolledo PA, Cuapio A, Villapol S. More than 50 long-term effects of COVID-19: a systematic review and meta-analysis. Sci Rep. 2021;11(1):16144. doi:10.1038/s41598-021-95565-8. - DOI - PMC - PubMed
    1. Subramanian A, Nirantharakumar K, Hughes S, Myles P, Williams T, Gokhale KM, Taverner T, Chandan JS, Brown K, Simms-Williams N. Symptoms and risk factors for long COVID in non-hospitalized adults. Nat Med. 2022;28(8):1706–22. doi:10.1038/s41591-022-01909-w. - DOI - PMC - PubMed
    1. Hikmet F, Méar L, Edvinsson Å, Micke P, Uhlén M, Lindskog C. The protein expression profile of ACE2 in human tissues. Mol Syst Biol. 2020;16:e9610. doi:10.15252/msb.20209610. - DOI - PMC - PubMed

Publication types

Substances