. 2023 Nov;149(17):15737-15762.
doi: 10.1007/s00432-023-05316-7. Epub 2023 Sep 5.

Integrated bioinformatics and validation reveal SOX12 as potential biomarker in colon adenocarcinoma based on an immune infiltration-related ceRNA network

Affiliations

Integrated bioinformatics and validation reveal SOX12 as potential biomarker in colon adenocarcinoma based on an immune infiltration-related ceRNA network

Xinyi Chen et al. J Cancer Res Clin Oncol. 2023 Nov.

Abstract

Purpose: The primary objective of this study was to construct competing endogenous RNA (ceRNA) networks and evaluate the prognostic significance of tumor-infiltrating immune cells (TIICs) and key biomarkers within the ceRNA networks in colon adenocarcinoma (COAD) patients.

Methods: Comprehensive bioinformatics tools were used to screen differentially expressed genes (DEGs), miRNAs (DEMs), and lncRNAs (DELs) related to COAD, leading to the creation of ceRNA networks. The CIBERSORT technique was employed to assess the significance of TIICs in COAD, and an immune-related prognosis prediction model was subsequently developed. Co-expression analyses were conducted to determine the relationship between key genes in ceRNA networks and immunologically significant TIICs. The study also utilized 5 GEO datasets and web-based databases to externally validate the findings.

Results: The study revealed a statistically significant relationship between key hub genes and immune cells, as determined through co-expression analysis. Two hub regulators (SOX12 and H19) demonstrated significant prognostic value in the ceRNA-related prognostic model, and their elevated expression levels were verified across multiple CRC cell lines. Additionally, the knockdown of SOX12 led to a suppression of proliferation, migration, and invasion in colon cancer cells.

Conclusion: Through the construction of ceRNA networks and evaluation of TIICs, the study successfully established two risk score models and nomograms. These models serve as valuable tools for understanding the molecular processes and predicting the prognosis of COAD patients. Further validation of hub regulators SOX12 and H19 substantiates their potential role as key biomarkers in COAD.

Keywords: Colon adenocarcinoma; Immune infiltration; Nomogram; Prognostic model; ceRNA network.


Conflict of interest statement

The authors declare that they have no competing interests. The authors declare that the research was conducted in the absence of any commercial or financial relationships that could be construed as a potential conflict of interest.

Figures

Fig. 1
Fig. 1
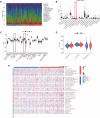
Differentially expressed genes (DEGs) in normal versus tumor samples. The identified 2955 DEGs displayed in a heatmap (a) and a volcano plot (d); the identified 215 DELs presented in a heatmap (b) and a volcano plot (e). The identified 357 DEMs depicted in a heatmap (c) and a volcano plot (f); g The DEGs’ composition. LogFC > 1.0 or < − 1.0 and FDR < 0.01
Fig. 2
Fig. 2
The constructed ceRNA networks. a The ceRNA network incorporating DELs, DEMs, and DEGs. b, c The prognosis-related ceRNA sub-network. ceRNA, competing endogenous RNA. d Chord plot of GO enrichment analysis for the DEGs in ceRNA network. The GO terms are shown and annotated on the right of the chord diagram, while the DEGs in the ceRNA network are shown on the left. Red bricks represent upregulated genes, and blue bricks represent downregulated genes. e Sankey diagram of KEGG pathway analysis for the ceRNA network
Fig. 3
Fig. 3
Construction and evaluation of the significant compositions of the ceRNA network risk signature for COAD. a 13 genes in the ceRNA network were found using the LASSO regression technique. b The penalty parameter’s λ optimum coefficients were obtained utilizing ten-fold cross-validation. c Nine genes were included in the ceRNAs-related risk signature using a multivariate Cox proportional hazards regression model. d The nomogram’s calibration curve for the three-year OS. e A nomogram predicated on signature members associated with ceRNAs. f COAD patients’ predictor values were ranked utilizing the prognostic model. The scatter plot depicting the survival situation of all patients. g Kaplan–Meier survival curves for patients in the low- and high-risk groups. h Curves of the receiver operating characteristic (ROC) for anticipating OS over 1, 3, and 5 years. *P < 0.05, **P < 0.01
Fig. 4
Fig. 4
The relationships between the risk score and several clinical and pathological parameters. a The heatmap depicts the connections between the expression levels of nine key biological markers in the ceRNA network and clinical-pathological characteristics. be Clinical and pathological parameters of patients with varying risk scores (stage, T-staging, N-staging, and M-staging). The Chi-square test was utilized to examine the statistical significance of the relationships between clinicopathologic characteristics and risk scores. fq Kaplan–Meier curves depicting the difference in OS between the two groups sorted by age, gender, stage, and TNM staging. **P < 0.01, ***P < 0.001
Fig. 5
Fig. 5
Evaluation of a predictive signature premised on ceRNAs and the development of a nomogram in COAD. a, b Cox regression analyses conducted on univariate and multivariate data indicated that the risk score produced from the prognostic model independently functioned as a predictor in COAD patients. c A nomogram-based integrated risk score developed from the predictive signature of ceRNAs and clinicopathologic characteristics. df The nomogram's calibration curve demonstrated a high prediction capacity for OS over 1, 3, and 5 years in COAD patients. gi ROC curves for anticipating OS over one, three, and five years in COAD patients
Fig. 6
Fig. 6
Analysis of immune infiltration. a, b The CIBERSORT technique was used to determine the composition of 22 distinct immune cells and the abundance differences of these cells between the high- and low-risk group. c ssGSEA scores of immune cells and immune function in the high/low-risk group. d Correlation between risk score and StromalScore, ImmuneScore, and ESTIMATEScore, as determined by the “ESTIMATE” algorithm. € Based on CIBERSORT, CIBERSORT-ABS, QuanTIseq, MCPcounter, xCell and EpiC algorithms, heatmap of immune infiltration in the high- and low-risk groups. *P < 0.05, **P < 0.01, ***P < 0.001
Fig. 7
Fig. 7
The co-expression study of major components of the ceRNA network with TIICs. a Correlation between the major components of the ceRNAs-associated prognostic signature and immune cell type abundance. b, c Expression of immune checkpoints among high- and low-risk groups. *P < 0.05, **P < 0.01, ***P < 0.001
Fig. 8
Fig. 8
External validation of key members in the ceRNA network as a potential biomarker. Based on GEO cohort, high expression of SOX12 (ad) and H19 (eg) is observed in tumor tissues from colon cancer patients compared to those from normal tissue. *P < 0.05, **P < 0.01, ***P < 0.001, ***P < 0.0001
Fig. 9
Fig. 9
External validation on multiple public datasets. Validation of SOX12 expression levels in multiple cancer types using the Oncomine database (a, b), the UALCAN database (c) and the TIMER database (d). e, f Kaplan–Meier survival analysis of SOX12 using the HPA database (e) and the Kaplan–Meier Plotter database (f)
Fig. 10
Fig. 10
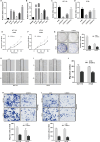
Effects of SOX12 silencing on proliferation and migration in colon cancer cells. a, b The expression level of SOX12 and H19 in colon cancer cell lines (HT-29, HCT 116, SW480, Caco-2, and LoVo) and normal human colon epithelial cell NCM460 was validated by qPCR. c, d Silencing of SOX12 expression in€T 116 (c) and HT-29 (d) cells with siRNAs. qPCR showed that SOX12-targeting siRNA si-SOX12-1 provided optimal depletion of SOX12 compared to the siRNA-negative control (si-NC) in both cell lines. e, f CCK‐8 assay indicated that SOX12-knockdown significantly decreased the proliferation rate of colon cancer cells. g Change of colony formation ability of colon cancer cells treated with si-NC and si-SOX12. hj Scratch assay of colon cancer cells treated with si-NC and si-SOX12. k, l Transwell assays were performed with si-NC and si-SOX12-transfected colon cancer cells to determine the effects of SOX12 on cell migration. The bar graphs show the results of quantitative analyses. *P < 0.05, **P < 0.01, ***P < 0.001
Fig. 11
Fig. 11
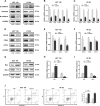
Putative mechanism underlying SOX12’s function in colon cancells. a Protein and b, c mRNA expressions of EMT-related markers in CRC cells transfected with si-SOX12 or si-NC were analyzed by Western blotting and qPCR, respectively. d Protein and e, f mRNA expressions of stemness-associated markers in CRC cells transfected with si-SOX12 or si-NC were analyzed by Western blotting and qPCR, respectively. g Protein and h, i mRNA expressions of apoptotic factors in CRC cells transfected with si-SOX12 or si-NC were analyzed by Western blotting and qPCR, respectively. j Apoptosis was investigated by Annexin V/PI double-staining after transfection with si-SOX12 or si-NC. The bar graphs show the results of quantitative analyses. *P < 0.05, **P < 0.01, ***P < 0.001
Fig. 12
Fig. 12
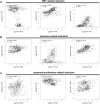
The correlation analysis based on Spearman correlation analysis of GEPIA database. Relationship between H19 expression and EMT (a), stemness (b) and apoptosis/proliferation-related (c) genes. R, Spearman coefficient
Fig. 13
Fig. 13
Knockdown of SOX12 decreases tumor growth in vivo. a, b The efficiency of shRNAs for the knockdown of SOX12 was evaluated by qPCR (a) and Western blot (b). c Representative pictures of subcutaneous xenograft tumors from the sh-SOX12 and sh-NC groups (n = 6). d, e Compared to the sh-NC group, the sh-SOX12 group exhibited tumors with significantly reduced volume (d) and weight (e). f Representative IHC staining images of E-cadherin and vimentin in tumor xenografts derived from nude mice in the sh-SOX12 group and the control group. Scale bar: 100 µm. g The correlation analysis between SOX12 and EMT-related markers based on the Spearman correlation analysis of GEPIA database. R, Spearman coefficient. **P < 0.01, ***P < 0.001

Similar articles

Cited by

References

    1. Ardelt MA, Pachmayr J (2017) The long non-coding RNA H19—a new player in hepatocellular carcinoma. Cell Stress 1:4–6 - PMC - PubMed
    1. Becht E, Giraldo NA, Lacroix L, Buttard B, Elarouci N, Petitprez F, Selves J, Laurent-Puig P, Sautes-Fridman C, Fridman WH, de Reynies A (2016) Estimating the population abundance of tissue-infiltrating immune and stromal cell populations using gene expression. Genome Biol 17:218 - PMC - PubMed
    1. Cao W, Zhou W, Li M, Zhang Z, Zhang X, Yang K, Yang S, Cao G, Chen B, Xiong M (2022) A novel signature based on CeRNA and immune status predicts prognostic risk and drug sensitivity in gastric cancer patients. Front Immunol 13:951135 - PMC - PubMed
    1. Cassetta L, Fragkogianni S, Sims AH, Swierczak A, Forrester LM, Zhang H, Soong DYH, Cotechini T, Anur P, Lin EY, Fidanza A, Lopez-Yrigoyen M, Millar MR, Urman A, Ai Z, Spellman PT, Hwang ES, Dixon JM, Wiechmann L, Coussens LM, Smith HO, Pollard JW (2019) Human tumor-associated macrophage and monocyte transcriptional landscapes reveal cancer-specific reprogramming, biomarkers, and therapeutic targets. Cancer Cell 35:588 e510-602 e510 - PMC - PubMed
    1. Chandrashekar DS, Bashel B, Balasubramanya SAH, Creighton CJ, Ponce-Rodriguez I, Chakravarthi B, Varambally S (2017) UALCAN: a portal for facilitating tumor subgroup gene expression and survival analyses. Neoplasia 19:649–658 - PMC - PubMed

LinkOut - more resources