. 2023 Sep 1;64(12):7.
doi: 10.1167/iovs.64.12.7.

Association of Ocular Surface Immune Cells With Dry Eye Signs and Symptoms in the Dry Eye Assessment and Management (DREAM) Study

Affiliations

Association of Ocular Surface Immune Cells With Dry Eye Signs and Symptoms in the Dry Eye Assessment and Management (DREAM) Study

Eric J Kuklinski et al. Invest Ophthalmol Vis Sci. .

Abstract

Purpose: Dry eye disease (DED) is a multifactorial, heterogeneous disease of the ocular surface with one etiology being ocular surface inflammation. Studies using animal models demonstrate the role of ocular surface immune cells in the inflammatory pathway leading to DED, but few have evaluated humans. This study described the white blood cell population from the ocular surface of patients with DED and assessed its association with DED signs and symptoms in participants of the Dry Eye Assessment and Management (DREAM) study.

Methods: Participants were assessed for symptoms using the Ocular Surface Disease Index, signs via corneal staining, conjunctival staining, tear break-up time, and Schirmer test, and Sjögren's syndrome (SS) based on the 2012 American College of Rheumatology classification criteria. Impression cytology of conjunctival cells from each eye was evaluated using flow cytometry: T cells, helper T cells (Th), regulatory T cells (Tregs), cytotoxic T cells, and dendritic cells.

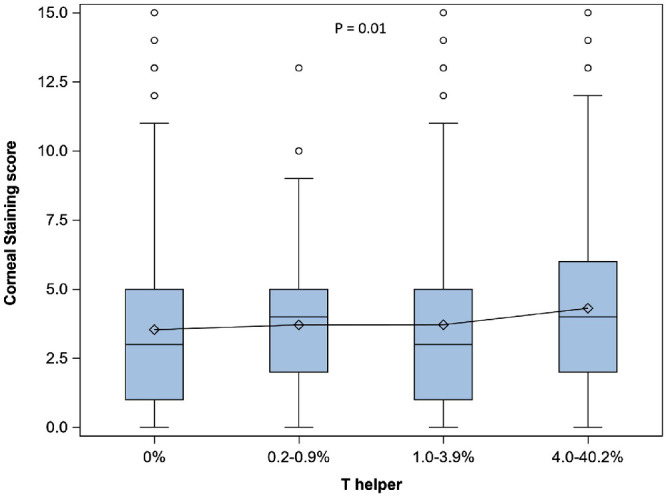
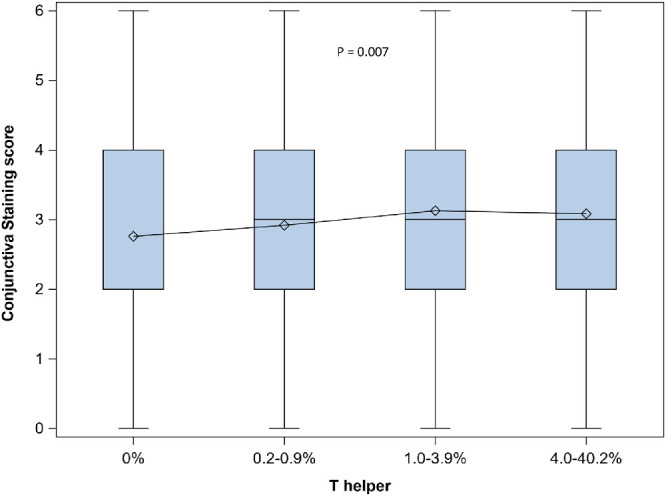
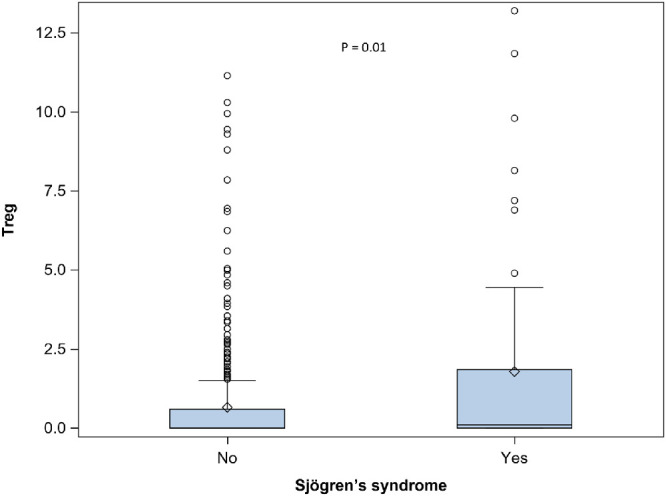
Results: We assessed 1049 eyes from 527 participants. White blood cell subtype percentages varied widely across participants. Significant positive associations were found for Th and conjunctival staining (mean score of 2.8 for 0% Th and 3.1 for >4.0% Th; P = 0.007), and corneal staining (mean score of 3.5 for 0% Th and 4.3 for >4.0% Th; P = 0.01). SS was associated with higher percent of Tregs (median 0.1 vs. 0.0; P = 0.01).

Conclusions: Th were associated with more severe conjunctival and corneal staining, possibly indicating their role in inflammation leading to damage of the ocular surface. There is no consistent conclusion about Tregs in SS, but these results support that Tregs are elevated in SS.


Conflict of interest statement

Disclosure: E.J. Kuklinski, None; Y. Yu, None; G.-S. Ying, None; P.A. Asbell, None

Figures

Figure 1.
Figure 1.
Flow cytometry gating strategy. Flow cytometer analysis. Dot plots of representative sample from the study. Total analyzable cells (B) were gated out from a scatter plot of forward scatter-width (FCS-W) vs. side scatter-area (SSC-A). (A) Sequential gating of CD45+ expressing cells (C) from the total population yielded total WBC from the sample. CD3+ and CD3 (D) were gated from the total WBCs. CD3 cells were gated for CD11c (E) to give total DCs. CD3+ cells were gated for CD8+ CD4 to give Ttox, and CD4+ CD8 for Th (F). CD4+ cells were gated for CD25+ and CD127 for Tregs (G). CD4+ were further gated to determine Th subtypes (H). CD4+ CXCR3 CCR4+ CCR6+ were gated for Th17 (I), and CD4+ CXCR3+ CCR4 CCR6 were gated for Th1 cells (J).
Figure 2.
Figure 2.
Association between corneal staining score and Th. The 75th and 25th percentiles make up the upper and lower boundaries of the boxes. Within the box, the diamond represents the mean and the horizontal line in the box represents the median. The vertical lines issuing from the box extend to the highest value within 1.5× the interquartile range of the 75th percentile and the lowest value within 1.5× the interquartile range of the 25th percentile. Each dot outside the upper and lower fence corresponds with an outlier value.
Figure 3.
Figure 3.
Association between conjunctiva staining score and Th. The 75th and 25th percentiles make up the upper and lower boundaries of the boxes. Within the box, the diamond represents the mean and the horizontal line in the box represents the median (the median is the same as the first quartile for the 0% group). The vertical lines issuing from the box extend to the highest value within 1.5× the interquartile range of the 75th percentile and the lowest value within 1.5× the interquartile range of the 25th percentile. Each dot outside the upper and lower fence corresponds to an outlier value.
Figure 4.
Figure 4.
Association between Sjögren's syndrome and Treg cells. The 75th and 25th percentiles make up the upper and lower boundaries of the boxes. Within the box, the diamond represents the mean and the horizontal line in the box represents the median. The vertical lines issuing from the box extend to the highest value within 1.5× the interquartile range of the 75th percentile and the lowest value within 1.5× the interquartile range of the 25th percentile. Each dot outside the upper and lower fence corresponds with an outlier value.

Similar articles

Cited by

References

    1. Stapleton F, Alves M, Bunya VY, et al. .. TFOS DEWS II epidemiology report. Ocul Surf. 2017; 15: 334–365. - PubMed
    1. Farrand KF, Fridman M, Stillman IO, Schaumberg DA.. Prevalence of diagnosed dry eye disease in the United States among adults aged 18 years and older. Am J Ophthalmol. 2017; 182: 90–98. - PubMed
    1. Sayegh RR, Yu Y, Farrar JT, et al. .. Ocular discomfort and quality of life among patients in the dry eye assessment and management study. Cornea. 2021; 40: 869–876. - PMC - PubMed
    1. Uchino M, Schaumberg DA.. Dry eye disease: impact on quality of life and vision. Curr Ophthalmol Rep. 2013; 1: 51–57. - PMC - PubMed
    1. Thulasi P, Djalilian AR.. Update in current diagnostics and therapeutics of dry eye disease. Ophthalmology. 2017; 124: S27–S33. - PMC - PubMed

Publication types