. 2023 Sep 1;23(10):2.
doi: 10.1167/jov.23.10.2.

The BTPI: An online battery for measuring susceptibility to visual illusions

Affiliations

The BTPI: An online battery for measuring susceptibility to visual illusions

Yarden Mazuz et al. J Vis. .

Abstract

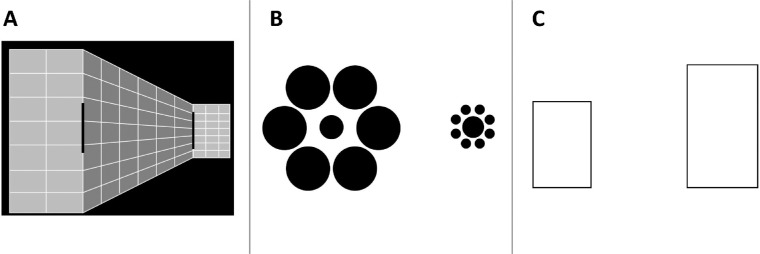
Visual illusions provide a powerful tool for probing the mechanisms that underlie perception. While most previous studies of visual illusions focused on average group-level performance, less attention has been devoted to individual differences in susceptibility to illusions. Unlike in other perceptual domains, in which there are established, validated tools to measure individual differences, such tools are not yet available in the domain of visual illusions. Here, we describe the development and validation of the BTPI (Ben-Gurion University Test for Perceptual Illusions), a new online battery designed to measure susceptibility to the influence of three prominent size illusions: the Ebbinghaus, the Ponzo, and the height-width illusions. The BTPI also measures perceptual resolution, reflected by the just noticeable difference (JND), to detect size differences in the context of each illusion. In Experiment 1 (N = 143), we examined performance in typical self-paced tasks, whereas in Experiment 2 (N = 69), we employed a fixed presentation duration paradigm. High test-retest reliability scores were found for all illusions, with little evidence for intercorrelations between different illusions. In addition, lower perceptual resolution (larger JND) was associated with a larger susceptibility to the illusory effect. The computerized task battery and analysis codes are freely available online.


Figures

Figure 1.
Figure 1.
An illustration of the psychophysical curve. The x-axis represents the magnitude of the reference stimulus. The y-axis represents the percentage of trials by which the participant reported that the reference stimulus is larger than the standard stimulus, both embedded in the illusion. The black curve is the fitted sigmoid function that represents the participant's data. The blue line marks the PSE, the value in which the participant perceived both stimuli as equal. The red lines represent the area of uncertainty, which equals two JNDs.
Figure 2.
Figure 2.
The stimuli used in Experiments 1 and 2. (A) Ponzo illusion—the participants were instructed to choose the longer object. (B) Ebbinghaus illusion—the participants were instructed to choose the larger central circle. (C) Height–width illusion—the participants were instructed to choose the wider rectangle.
Figure 3.
Figure 3.
Test–retest reliabilities for the illusion magnitudes and JNDs in Experiment 1. Each dot on the scatterplot represents one participant. The top panel (A, Ponzo; B, Ebbinghaus; C, height–width) shows the correlations for the illusion magnitude, and the bottom panel (D, Ponzo; E, Ebbinghaus; F, height–width) shows the correlations for the JNDs. The distributions of the two sessions are presented in the red and yellow histograms.
Figure 4.
Figure 4.
Correlation between RT (which equals exposure time in Experiment 1) and the illusion magnitude in Experiment 1. The solid lines in each graph represent the linear regression (A, Ponzo; B, Ebbinghaus; C, height–width).
Figure 5.
Figure 5.
Test–retest reliabilities for the illusion magnitudes and JNDs in Experiment 2. Each dot on the scatterplot represents one participant. The top panel (A, Ponzo; B, Ebbinghaus; C, height–width) shows the correlations for the illusion magnitude, and the bottom panel (D, Ponzo; E, Ebbinghaus; F, height–width) shows the correlations for the JNDs. The distributions of the two sessions are presented in the red and yellow histograms.

References

    1. Anderson, B. L., Tan, K., & Marlow, P. J. (2019). Irrational contour synthesis. Vision Research, 158, 200–207. - PubMed
    1. Axelrod, V., Schwarzkopf, D. S., Gilaie-Dotan, S., & Rees, G. (2017). Perceptual similarity and the neural correlates of geometrical illusions in human brain structure. Scientific Reports, 7(1), 1–16. - PMC - PubMed
    1. Ben-Shalom, A., & Ganel, T. (2012). Object representations in visual memory: Evidence from visual illusions. Journal of Vision, 12(7), 15, 10.1167/12.7.15. - DOI - PubMed
    1. Bosten, J. M., & Mollon, J. D. (2010). Is there a general trait of susceptibility to simultaneous contrast? Vision Research, 50(17), 1656–1664. - PubMed
    1. Bressan, P., & Kramer, P. (2021). Most findings obtained with untimed visual illusions are confounded. Psychological Science, 32(8), 1238–1246. - PubMed

Publication types