

An automated interface for sedimentation velocity analysis in SEDFIT
- PMID: 37669309
- PMCID: PMC10503714
- DOI: 10.1371/journal.pcbi.1011454
An automated interface for sedimentation velocity analysis in SEDFIT
Abstract
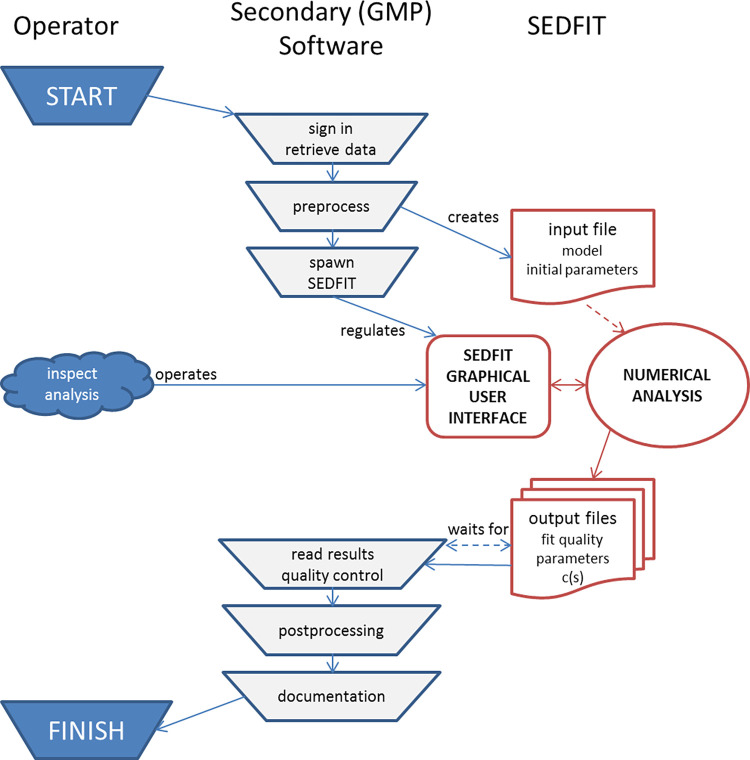
Sedimentation velocity analytical ultracentrifugation (SV-AUC) is an indispensable tool for the study of particle size distributions in biopharmaceutical industry, for example, to characterize protein therapeutics and vaccine products. In particular, the diffusion-deconvoluted sedimentation coefficient distribution analysis, in the software SEDFIT, has found widespread applications due to its relatively high resolution and sensitivity. However, a lack of suitable software compatible with Good Manufacturing Practices (GMP) has hampered the use of SV-AUC in this regulatory environment. To address this, we have created an interface for SEDFIT so that it can serve as an automatically spawned module with controlled data input through command line parameters and output of key results in files. The interface can be integrated in custom GMP compatible software, and in scripts that provide documentation and meta-analyses for replicate or related samples, for example, to streamline analysis of large families of experimental data, such as binding isotherm analyses in the study of protein interactions. To test and demonstrate this approach we provide a MATLAB script mlSEDFIT.
Copyright: This is an open access article, free of all copyright, and may be freely reproduced, distributed, transmitted, modified, built upon, or otherwise used by anyone for any lawful purpose. The work is made available under the Creative Commons CC0 public domain dedication.
Conflict of interest statement
The authors have declared that no competing interests exist.
Figures
Update of
-
An automated interface for sedimentation velocity analysis in SEDFIT.bioRxiv [Preprint]. 2023 May 14:2023.05.14.540690. doi: 10.1101/2023.05.14.540690. bioRxiv. 2023. Update in: PLoS Comput Biol. 2023 Sep 5;19(9):e1011454. doi: 10.1371/journal.pcbi.1011454. PMID: 37425873 Free PMC article. Updated. Preprint.
References
-
- Svedberg T, Pedersen KO (1940) The Ultracentrifuge. London: Oxford University Press.
-
- Schachman HK (1959) Ultracentrifugation in Biochemistry. New York: Academic Press.
-
- Schuck P, Zhao H, Brautigam CA, Ghirlando R (2015) Basic Principles of Analytical Ultracentrifugation. Boca Raton, FL: CRC Press. 302 p.
Publication types
MeSH terms
Grants and funding
LinkOut - more resources
Full Text Sources
