. 2023 Sep 12;120(37):e2304722120.
doi: 10.1073/pnas.2304722120. Epub 2023 Sep 5.

Systems-level temporal immune-metabolic profile in Crimean-Congo hemorrhagic fever virus infection

Affiliations

Systems-level temporal immune-metabolic profile in Crimean-Congo hemorrhagic fever virus infection

Anoop T Ambikan et al. Proc Natl Acad Sci U S A. .

Abstract

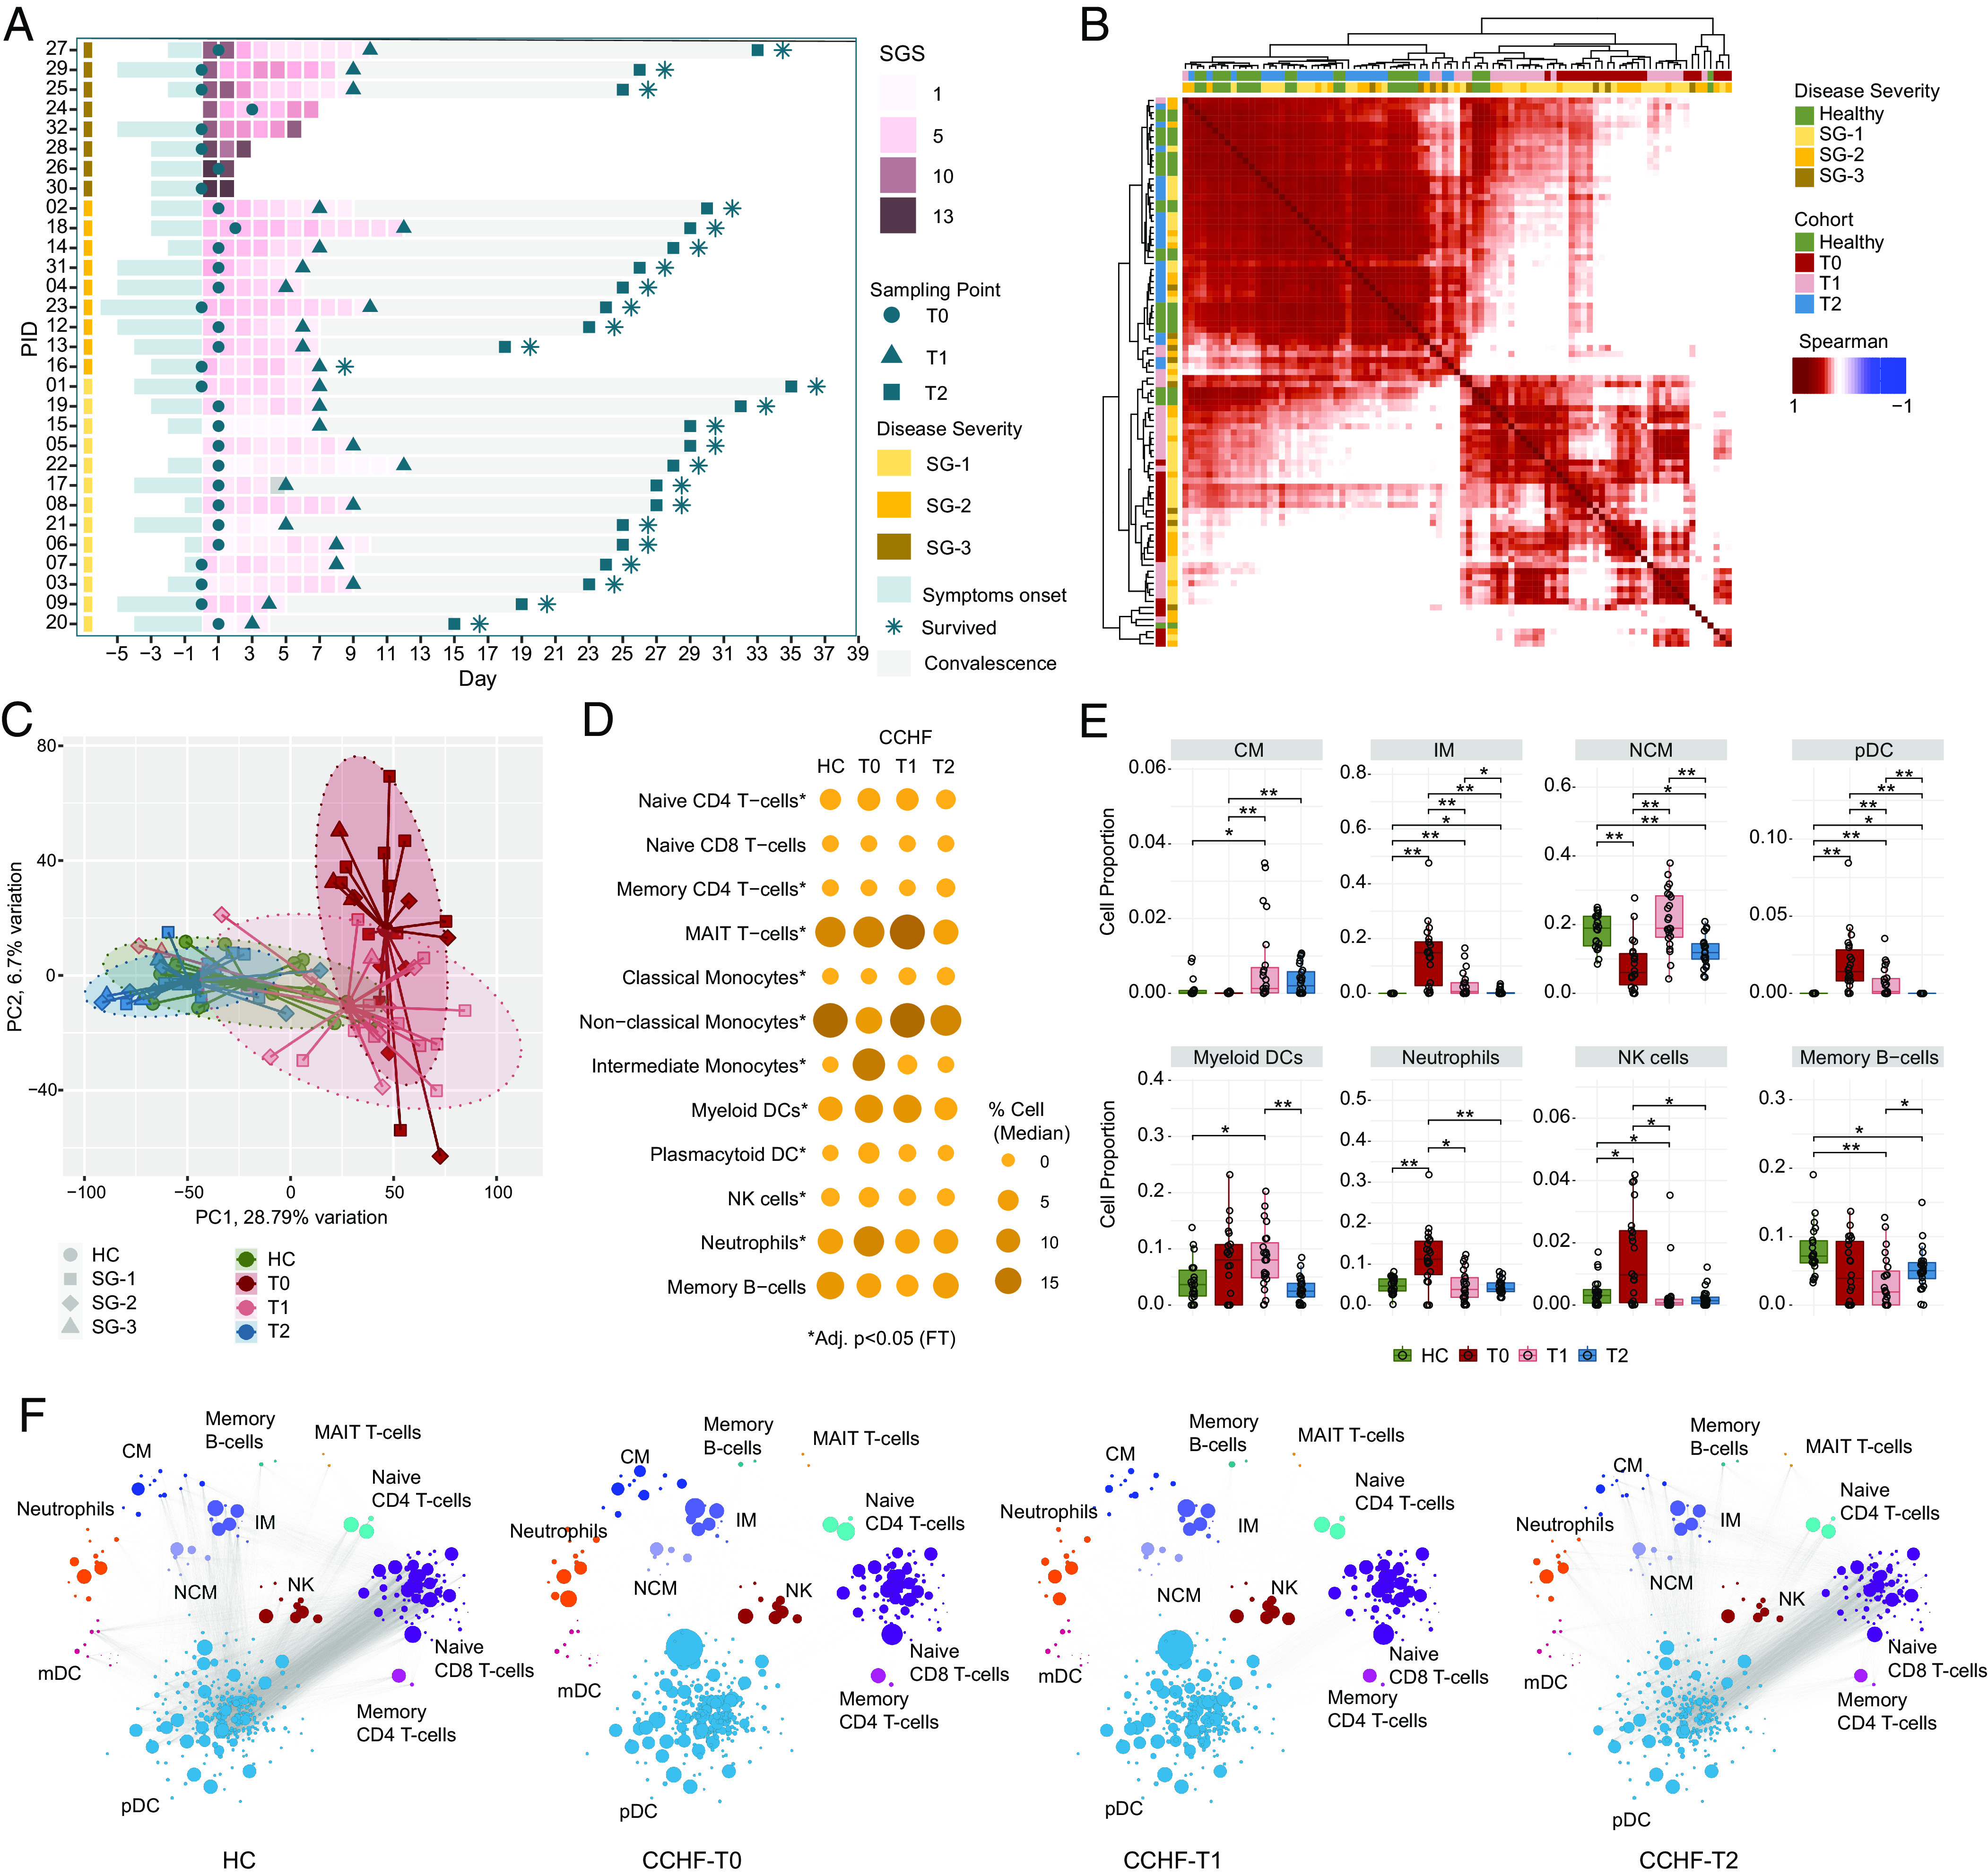
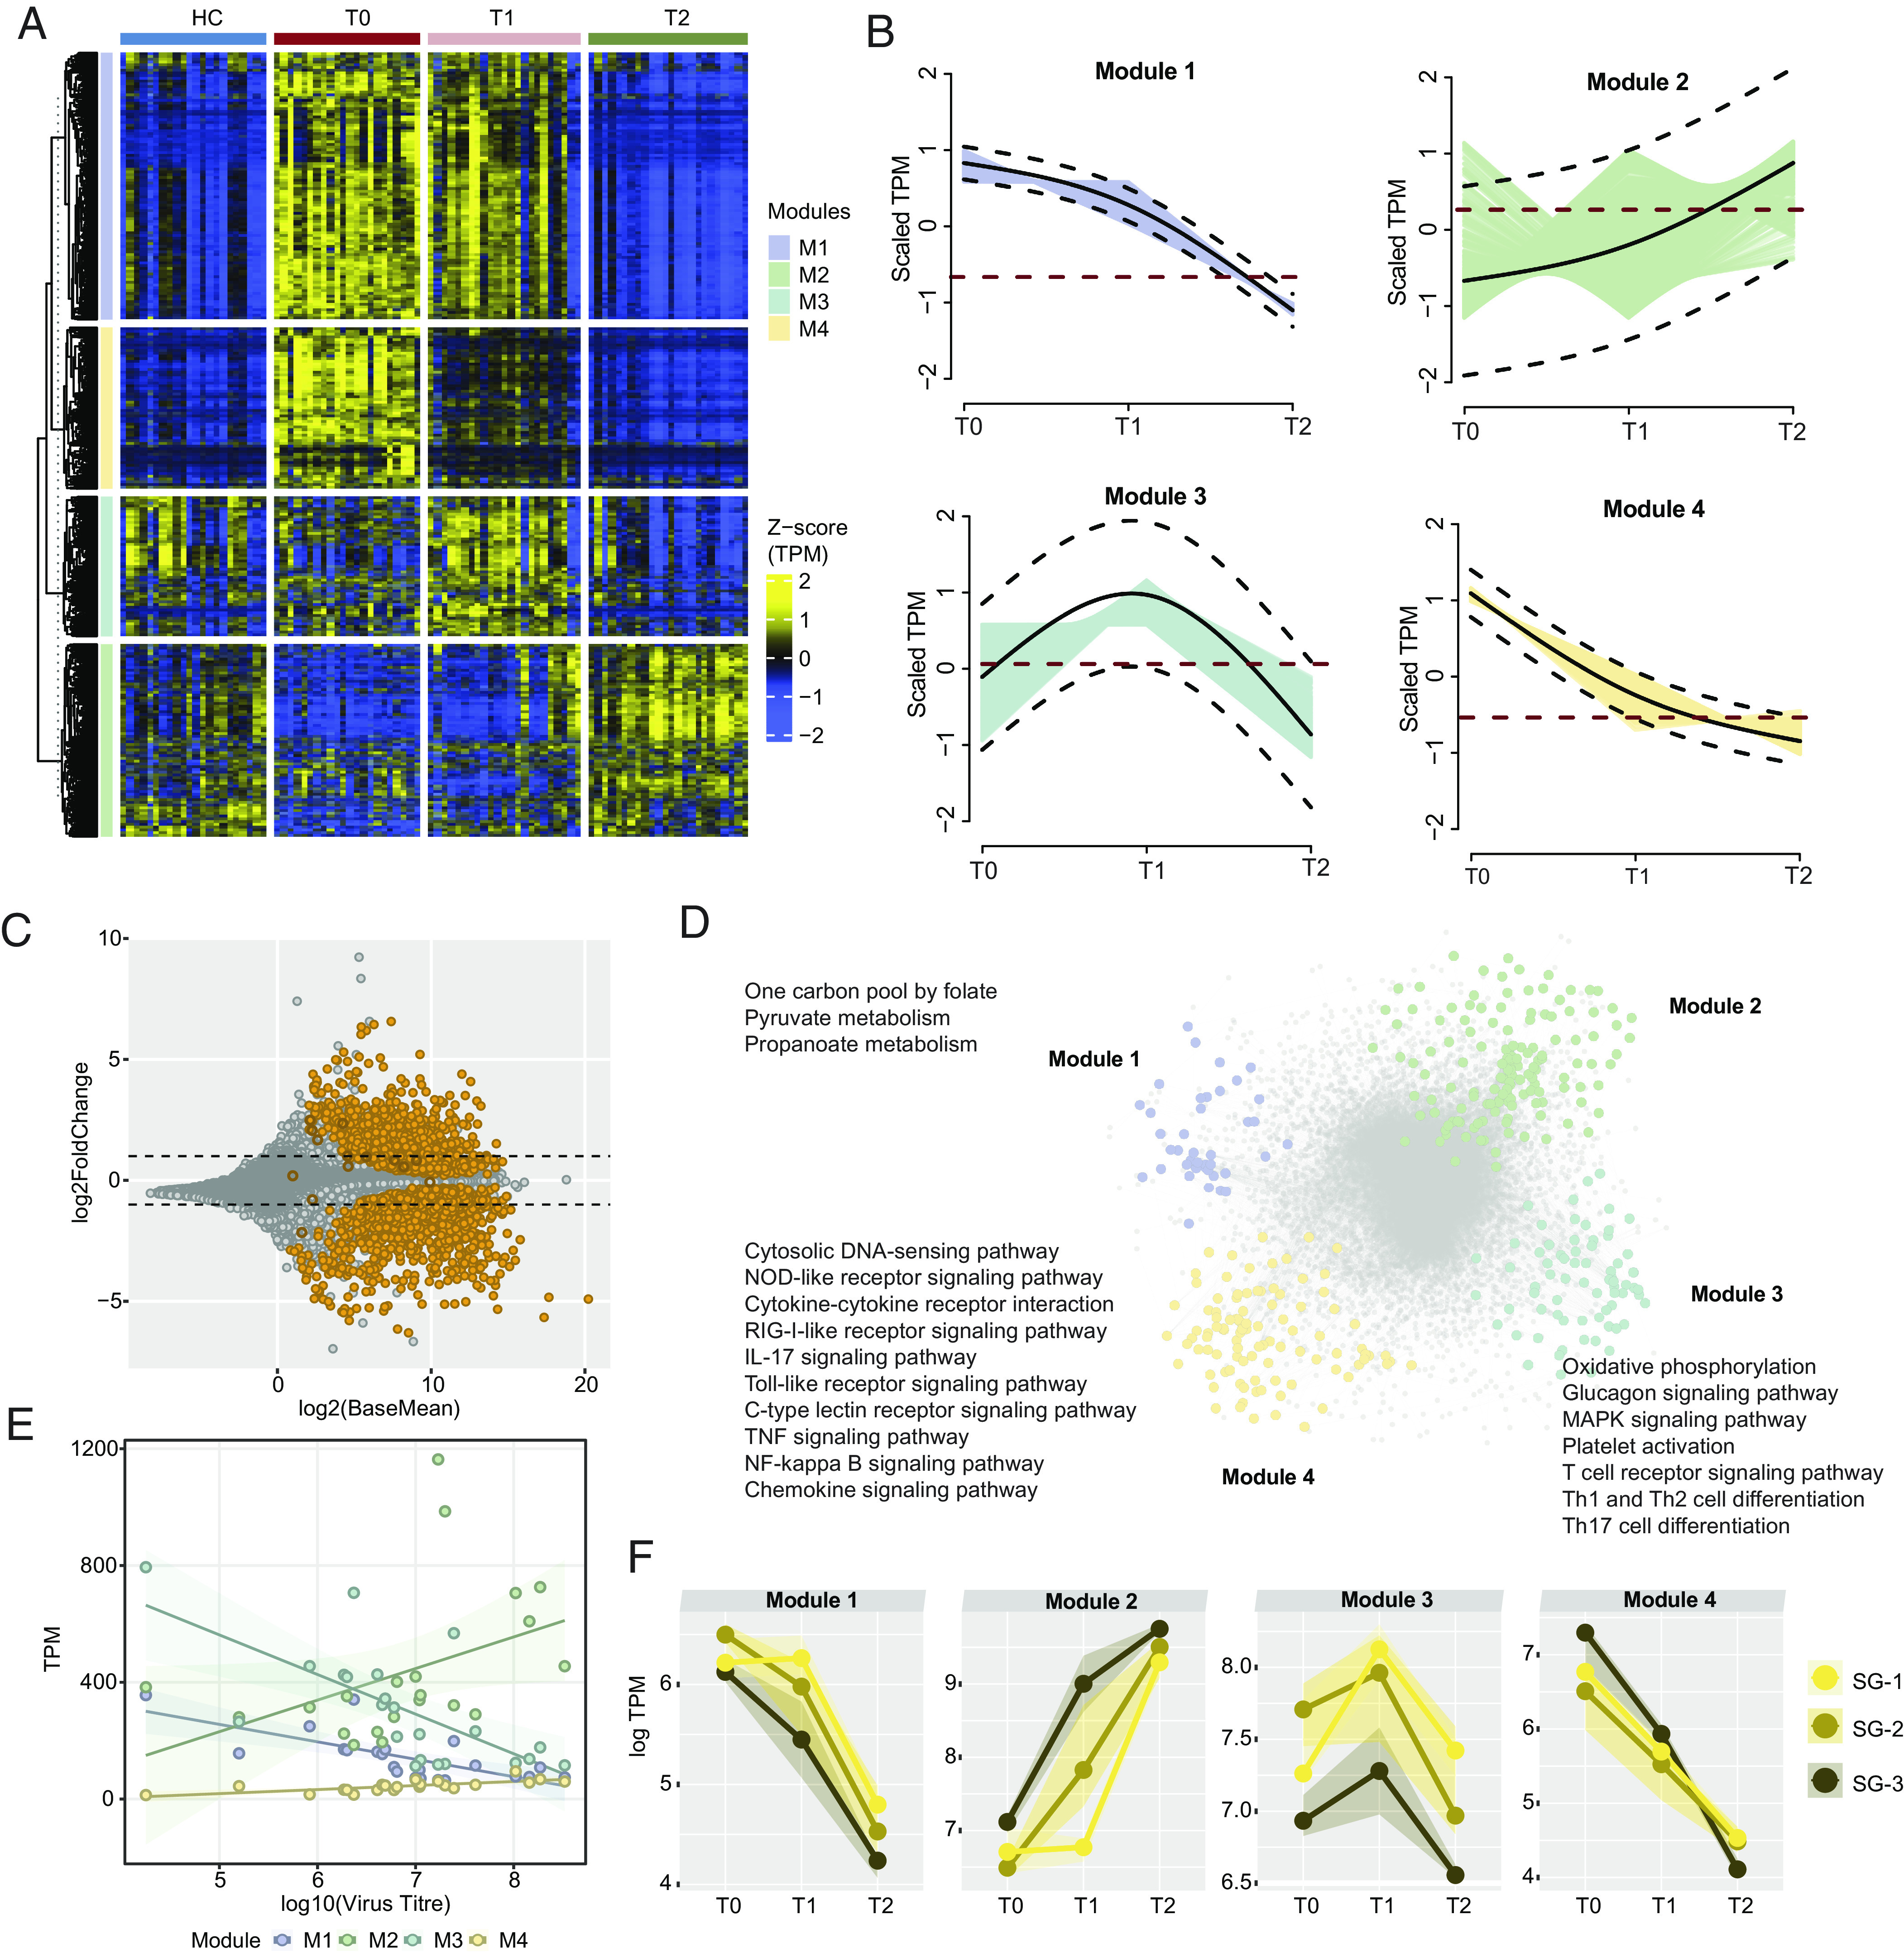
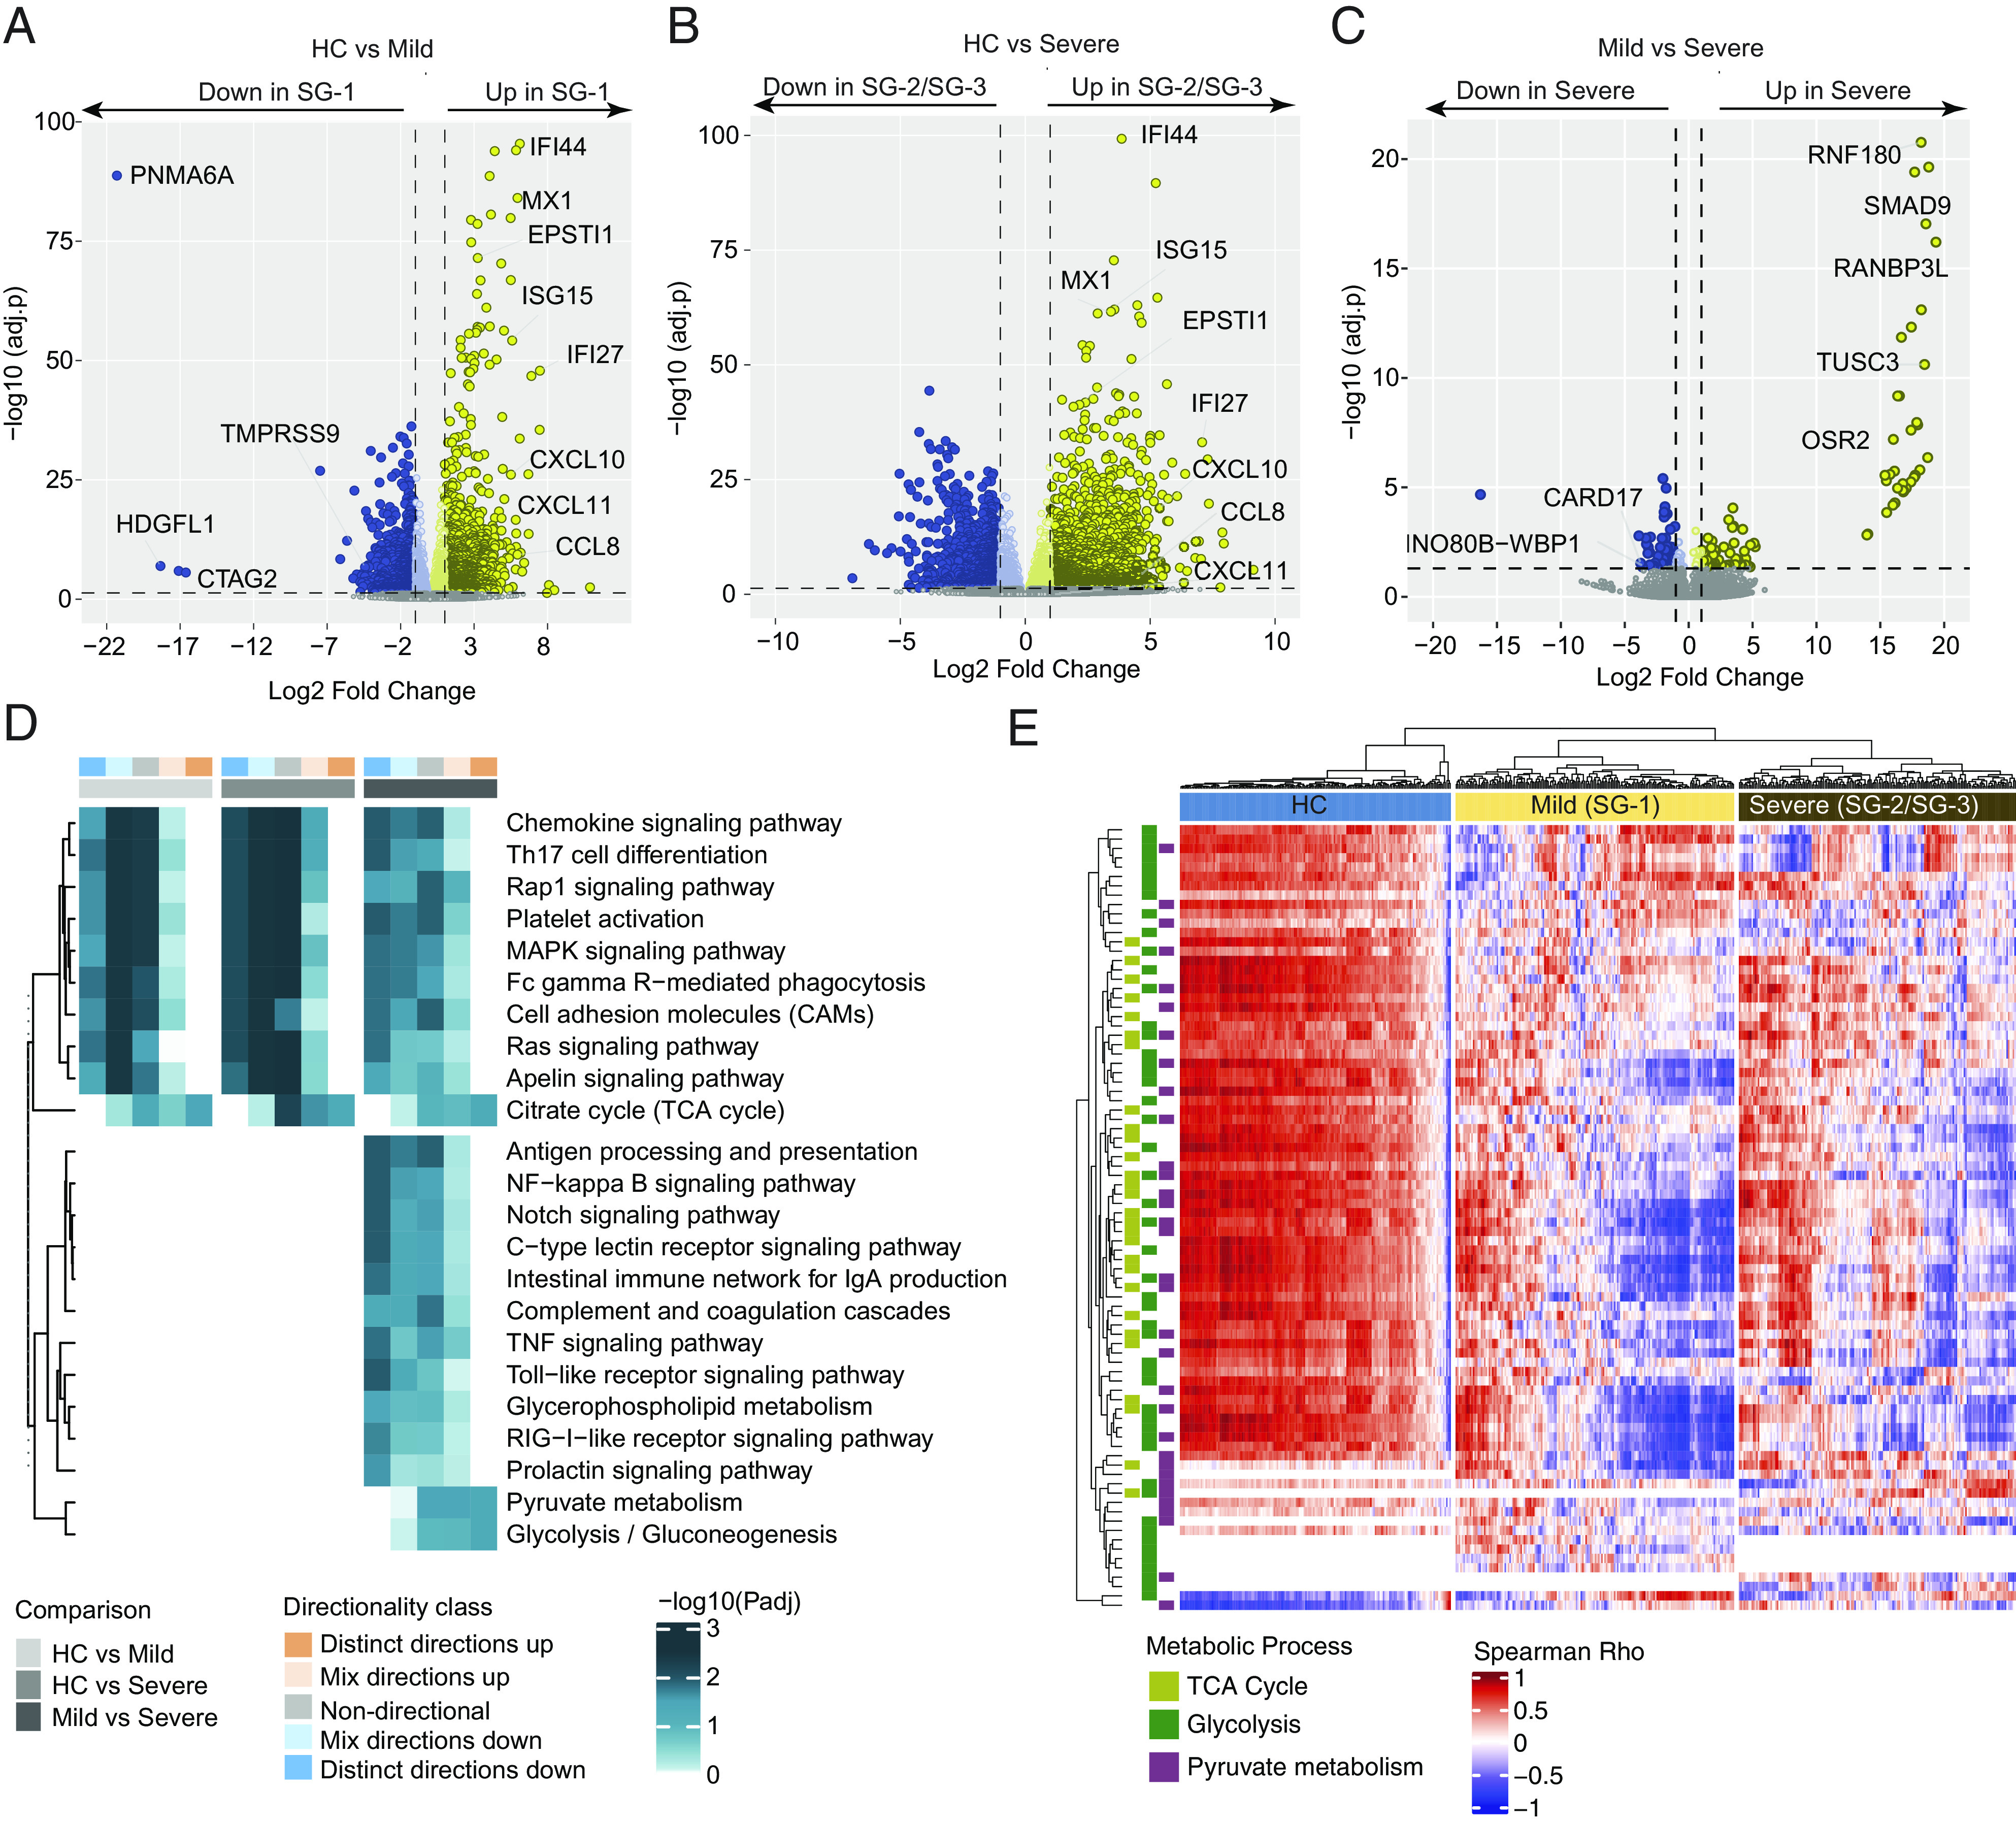
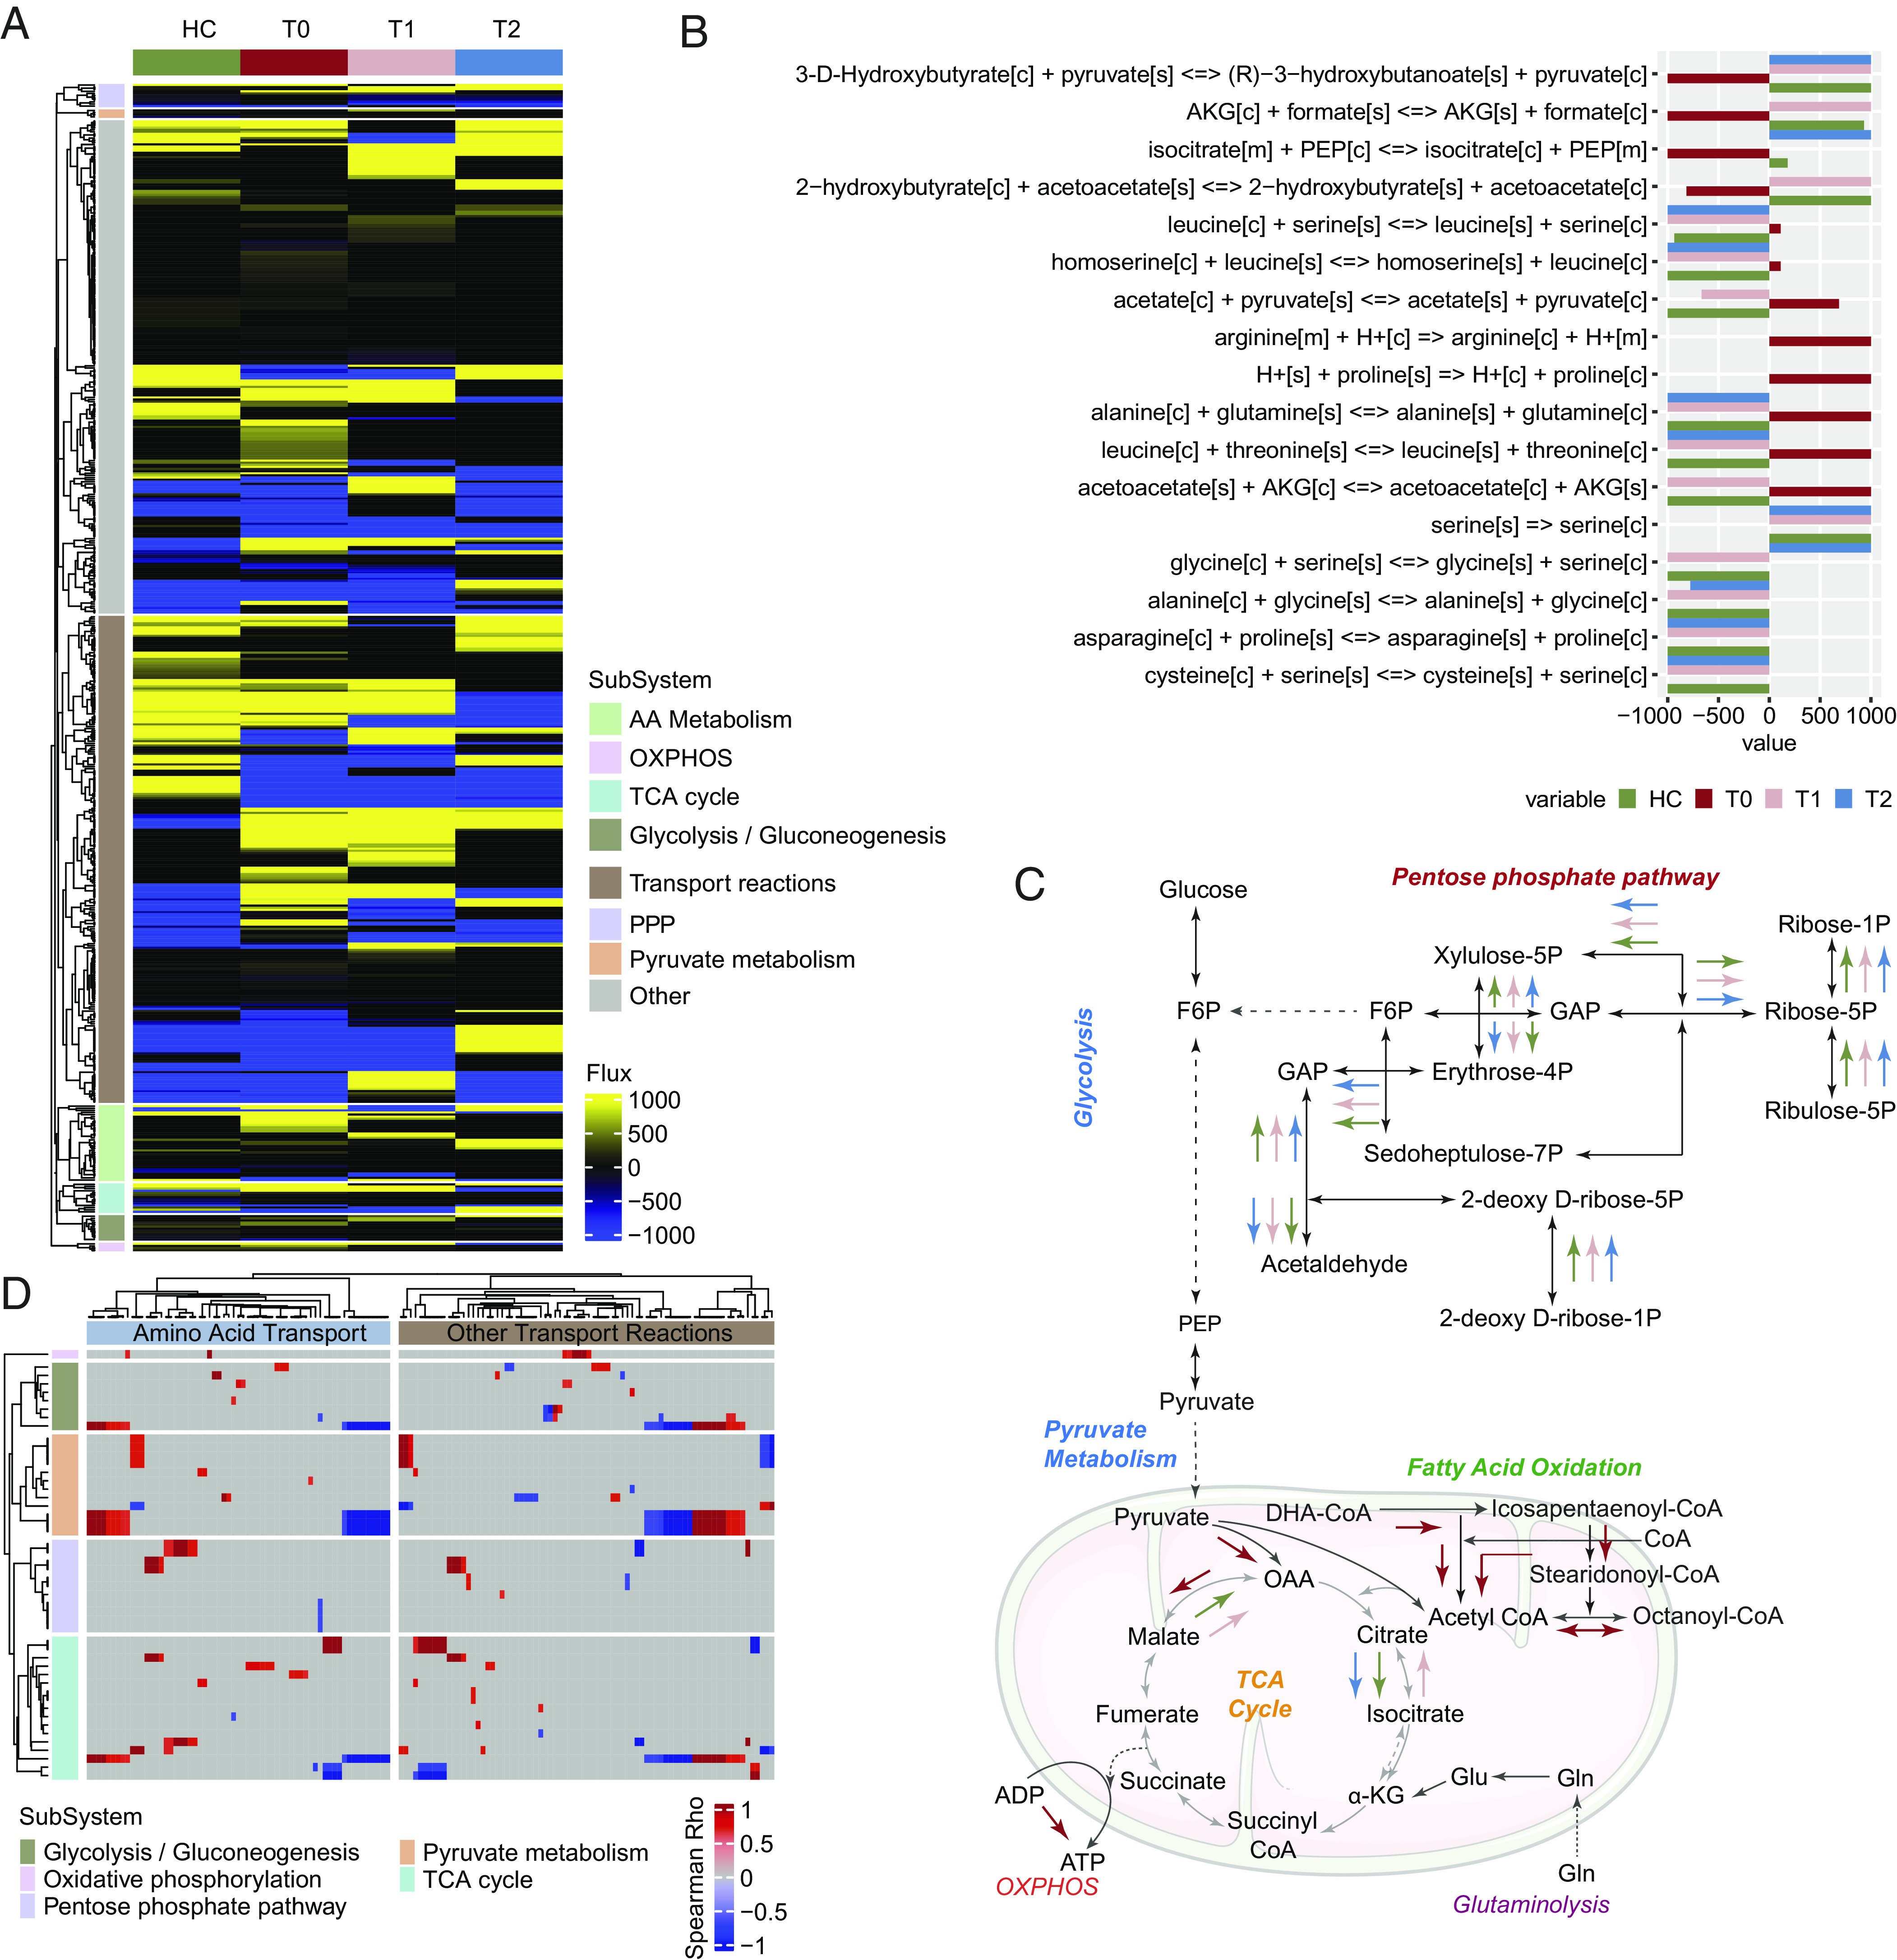
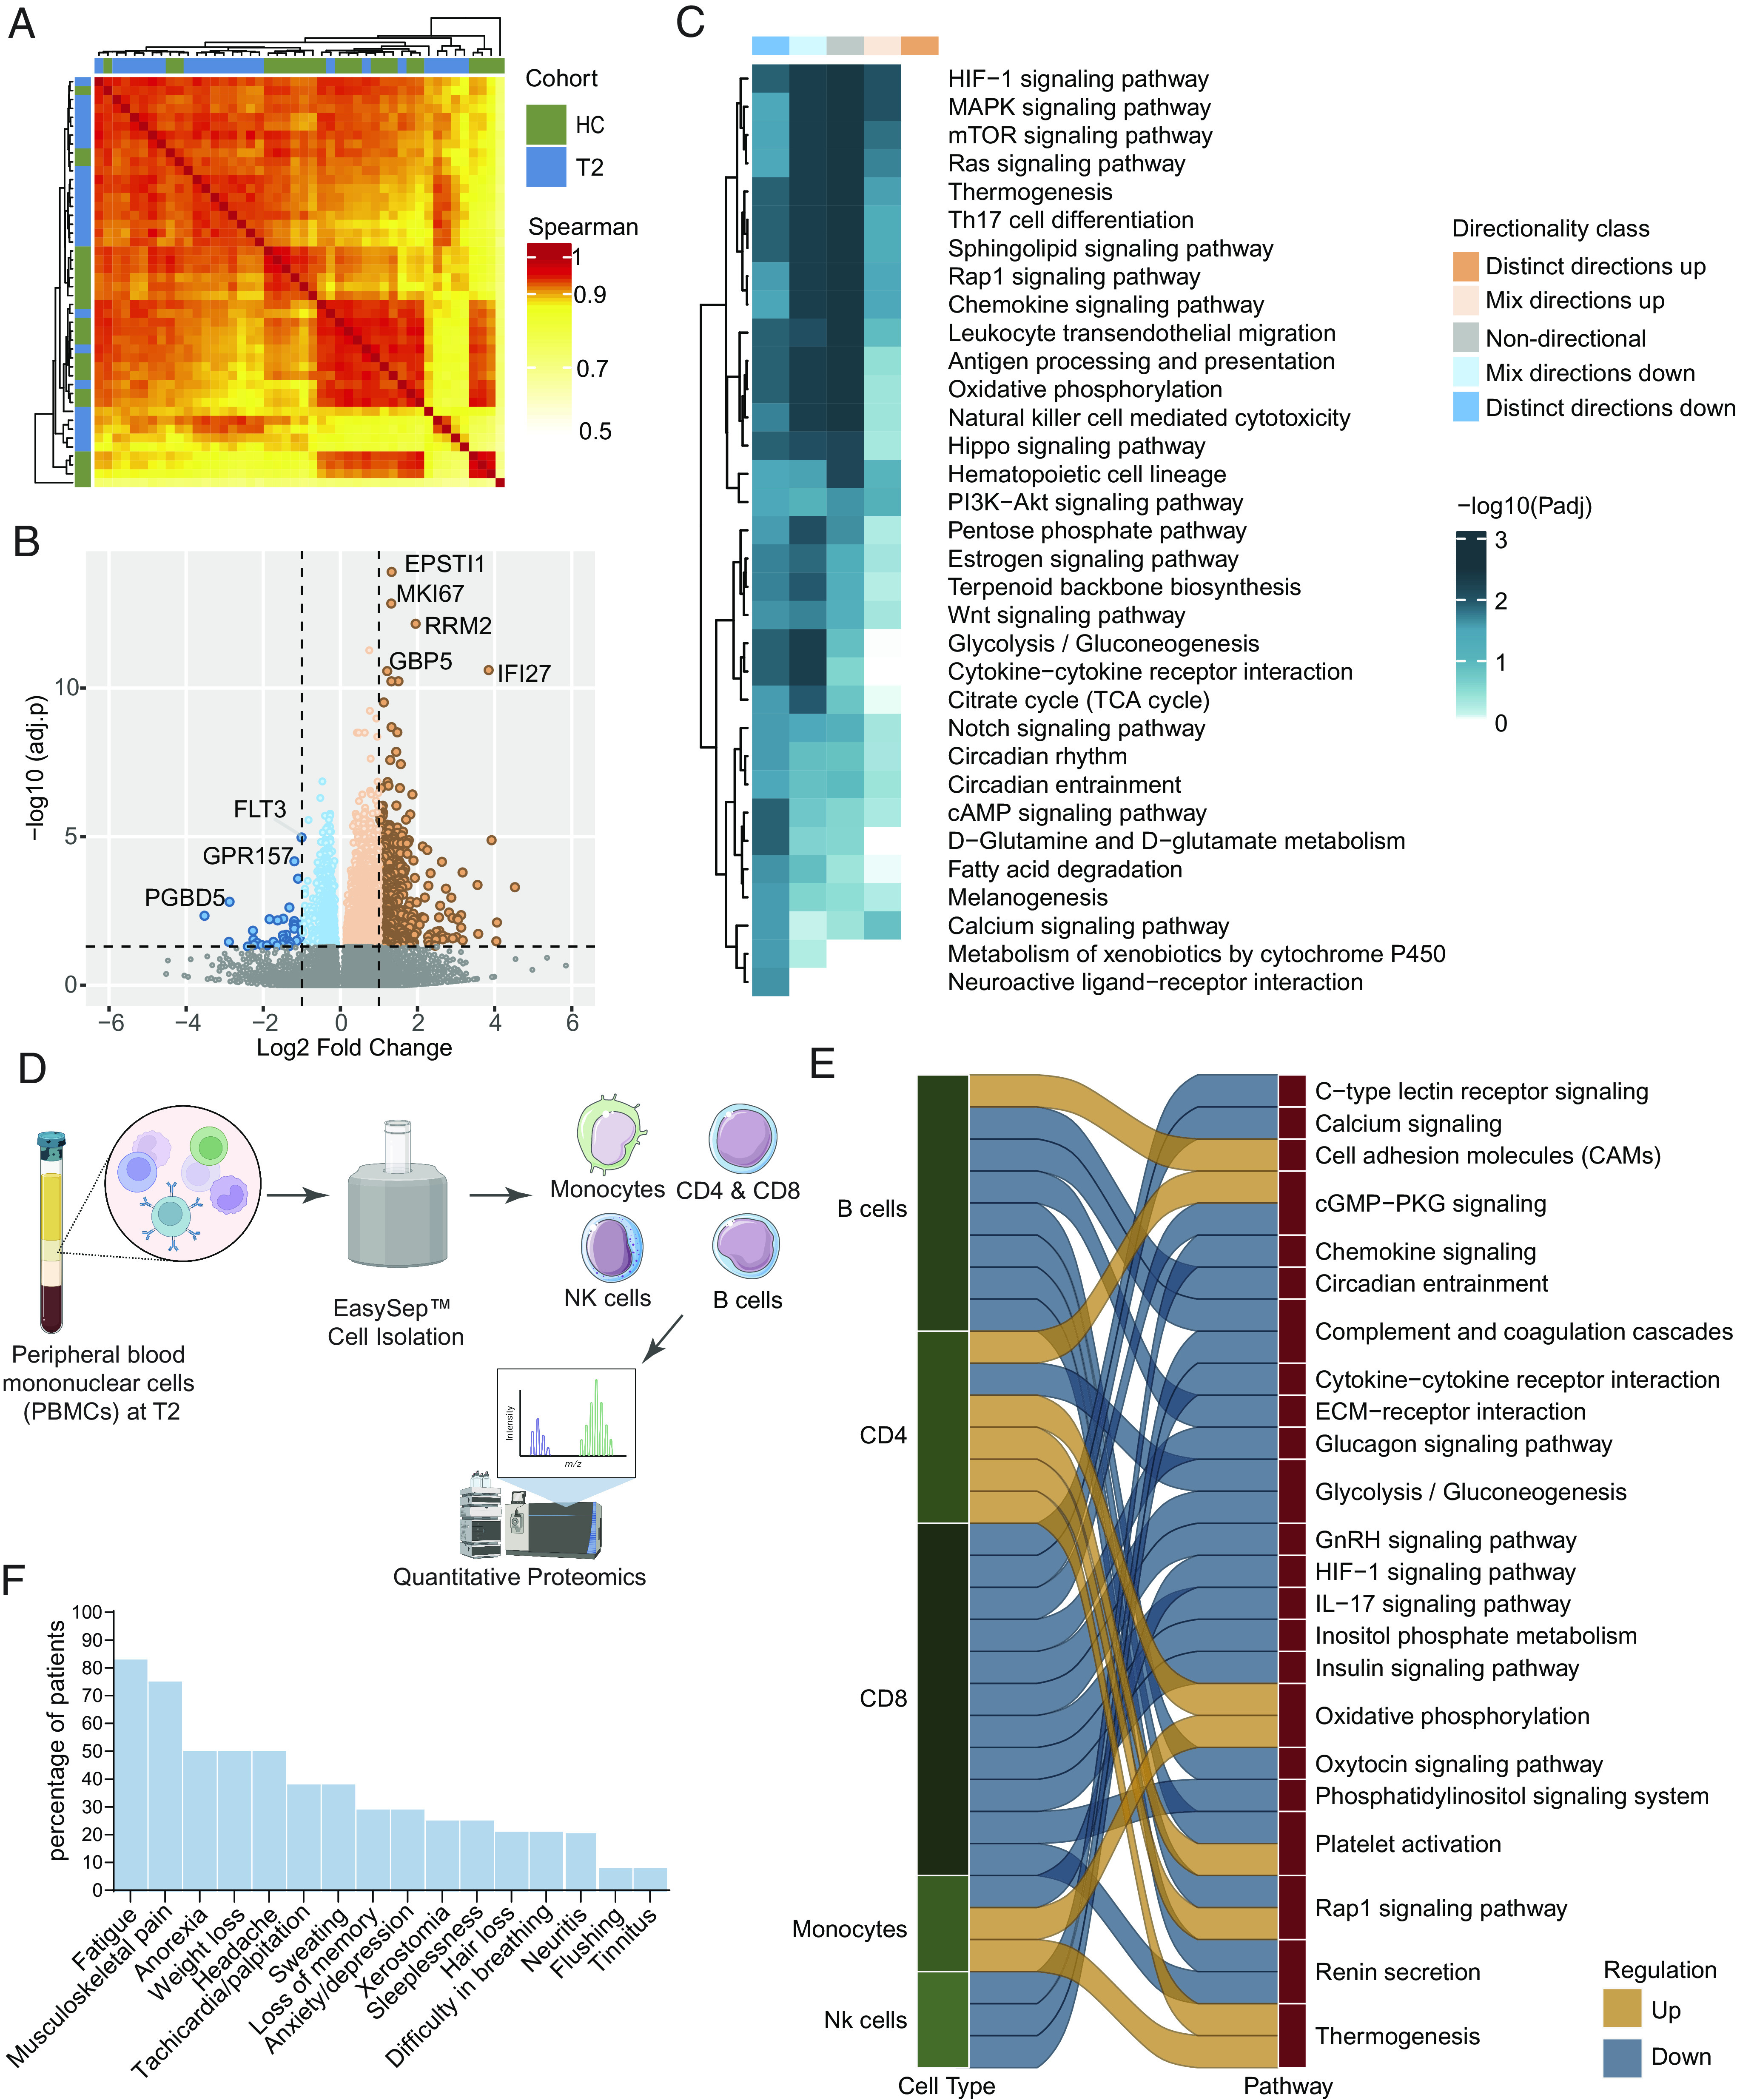
Crimean-Congo hemorrhagic fever (CCHF) caused by CCHF virus (CCHFV) is one of the epidemic-prone diseases prioritized by the World Health Organisation as public health emergency with an urgent need for accelerated research. The trajectory of host response against CCHFV is multifarious and remains unknown. Here, we reported the temporal spectrum of pathogenesis following the CCHFV infection using genome-wide blood transcriptomics analysis followed by advanced systems biology analysis, temporal immune-pathogenic alterations, and context-specific progressive and postinfection genome-scale metabolic models (GSMM) on samples collected during the acute (T0), early convalescent (T1), and convalescent-phase (T2). The interplay between the retinoic acid-inducible gene-I-like/nucleotide-binding oligomerization domain-like receptor and tumor necrosis factor signaling governed the trajectory of antiviral immune responses. The rearrangement of intracellular metabolic fluxes toward the amino acid metabolism and metabolic shift toward oxidative phosphorylation and fatty acid oxidation during acute CCHFV infection determine the pathogenicity. The upregulation of the tricarboxylic acid cycle during CCHFV infection, compared to the noninfected healthy control and between the severity groups, indicated an increased energy demand and cellular stress. The upregulation of glycolysis and pyruvate metabolism potentiated energy generation through alternative pathways associated with the severity of the infection. The downregulation of metabolic processes at the convalescent phase identified by blood cell transcriptomics and single-cell type proteomics of five immune cells (CD4+ and CD8+ T cells, CD14+ monocytes, B cells, and NK cells) potentially leads to metabolic rewiring through the recovery due to hyperactivity during the acute phase leading to post-viral fatigue syndrome.

Keywords: Crimean-Congo hemorrhagic fever virus; genome-scale metabolic models; post viral fatigue.


Conflict of interest statement

The authors declare no competing interest.

Figures

Fig. 1.
Fig. 1.
Temporal CCHFV pathogenesis and immune profiling: (A) Swimmer plot showing patient sampling information, including clinical features SGS, SG, and sampling time points. x axes represent days in the hospital, day 0 denotes the day of hospitalization, and y axes represent patient IDs ordered according to SG. (B) Patient-to-patient Spearman's correlation matrix clustering. The heatmap shows correlation coefficients computed using scaled TPM values of the top 5,000 varying genes based on median absolute deviation [HC (n = 22), T0 (n = 22), T1 (n = 23), T2 (n = 24)]. All correlations were highly significant (adjusted P < 0.0001) due to the high number of features used. Column and row annotations represent the patient cohort and disease severity group. (C) PCA plot visualizes the sample distribution. PCA was created using the scaled TPM values of top 5,000 varying genes based on the median absolute deviation. Ellipses represent 90% confidence space for each cohort, and point shapes correspond to the severity group. Centroid points of each cohort are computed and connected to each sample in the respective cohort with lines. (D) Bubble graph representing DCQ results. Bubble size and color gradient are relative to the median percentage of cell proportion estimated in each cohort. Asterisks represent a significant change in individual cell population from T0 to T2 by Friedman's test (adjusted P < 0.05). (E) Blood immune cell proportion using DCQ. Boxplot of DCQ results showing comparison among the four cohorts. Asterisks represent a significant change (adjusted P < 0.05) in the Mann–Whitney U test. (F) Network visualization of significant Spearman association (adjusted P < 0.001) between marker genes of cell types estimated in Fig. 1D in cohort HC, T0, T1, and T2, respectively. Bubble size corresponds to the mean TPM value. Nodes and edges represent marker genes of corresponding cell type and Spearman association, respectively.
Fig. 2.
Fig. 2.
Immuno-metabolic trajectories of CCHFV-pathogenesis. (A) Heatmap of genes identified as significantly changing (adjusted P < 0.001) among the three times of infection [T0 (n = 21), T1 (n = 21), T2 (n = 21)] using likelihood ratio test. The heatmap shows TPM transformed and z-scaled expression values of the genes. Column annotation represents the cohorts, and row annotation represents four gene expression trajectory pattern modules computed using the TMixClust algorithm. (B) Modules identified using the TMixClust algorithm. Each module represents a specific trajectory of gene expression. The red dotted line denotes the mean scaled expression value of genes belonging to the corresponding module in a healthy state. (C) MA plot of DGE analysis between T0 and T2. Orange-colored circles denote genes visualized in Fig. 2A. Empty circles denote nonsignificant expression (adjusted P > 0.05). (D) Network of significant Spearman correlation (adjusted P < 0.001) at T0 between and among genes of each module shown in Fig. 2A and their first neighbors. Gray-colored nodes denote the first neighbor genes. Significantly enriched pathways (adjusted P < 0.05) are labeled beside corresponding modules. (E) Spearman association between virus titer and average expression of genes of each trajectory module shown in Fig. 2A. (F) Severity group-specific expression dynamics of each module genes over the three time points of infection. Average expression (log TPM) values of each module for each severity group are plotted on the y axis. The shaded region represents the second and third quartiles of expression.
Fig. 3.
Fig. 3.
Severity-specific alterations during the CCHFV infection (A) Volcano plot showing expression changes in mild (SG-1) patients at T0 compared to HC. (B) Volcano plot showing expression changes in severe (SG-2/SG-3) patients at T0 compared to HC. (C) Volcano plot showing expression changes in severe (SG-2/SG-3) patients at T0 compared to mild (SG-1) patients at T0. Some of the essential genes related to antiviral responses are labeled. (D) Heatmap showing pathways significantly enriched (adjusted P < 0.05) in all the three pair-wise comparisons such as HC vs. mild (SG-1), HC vs. severe (SG-2/SG-3), and mild (SG-1) vs. severe (SG-2/SG-3) and uniquely enriched in mild (SG-1) vs. severe (SG-2/SG-3). The heatmap shows negative log scales adjusted P-values of different classes of directionality. Distinct directional classes of P-values calculated from gene statistics and expression direction were used to define up-regulated and down-regulated pathways. (E) Heatmap visualizing the association between IFN response genes (columns) and genes involved in the TCA cycle, glycolysis, and pyruvate metabolism pathways (rows) at T0. Column annotation represents patient groups and row annotation represents pathways. Spearman’s correlation coefficients were used to generate the heatmap.
Fig. 4.
Fig. 4.
Context-specific postinfection genome-scale metabolic models in CCHFV infection (A) Heatmap of metabolic flux computed from FBA using cohort-specific genome-scale metabolic models. The heatmap shows that reactions were different among the four cohorts. The heatmap was generated using metabolic flux (mmol/h/gDCW) values calculated for each reaction. Column annotation shows the cohort, and row annotation shows metabolic subsystems corresponding to the reactions. (B) Transport reactions during the acute phase of infection differ from the other two time points and HC. Bars are colored corresponding to the cohort, and the reaction's metabolic flux value (mmol/h/gDCW) is plotted on the x axis. (C) A representative diagram of reactions that were part of various metabolic subsystems was found to be uniquely active or inactive during the acute phase. Colored arrows represent the estimated direction of metabolic turnover in the corresponding cohort. (D) Association between the metabolic flux of transport reactions and reactions part of CCM pathways at the acute stage of infection (T0). Metabolic flux values (mmol/h/gDCW) computed from individual sample-wise GSMM (personalized models) were used to compute Spearman's correlation coefficient. Column and row annotations represent transport reactions and CCM pathways, respectively.
Fig. 5.
Fig. 5.
Postrecovery immune signature compared to the CCHFV-seronegative samples (A) Patient-to-patient correlation between patient samples using Spearman's correlation metric HC (n = 22) and T2 (n = 24). The heatmap shows correlation coefficients computed using scaled TPM values of the top 5,000 varying genes based on the median absolute deviation. All correlations were highly significant (adjusted P < 0.0001) due to the high number of features used. Column and row annotations represent patient cohorts. (B) Volcano plot of DGE analysis between cohorts. Negative log2 fold change values represent downregulation, and positive values represent upregulation at T2 compared to HC. The top significantly expressed genes are labeled. (C) Significantly enriched pathways at T2 compared to HC (adjusted P < 0.05). The heatmap shows negative log scales adjusted P-values of different classes of directionality. Distinct directional classes of P-values calculated from gene statistics and expression direction were used to define up-regulated and down-regulated pathways. (D) Experimental design of isolation of immune cells. Figure created with Biorender.com (E) Significantly up-regulated and down-regulated (adjusted P < 0.2) pathways in CCHFV convalescent patients compared to HC in each cell type computed from sctProteomics data analysis. (F) Proportion of the symptoms of the PVF syndrome in CCHFV-recovered patients.

References

    1. World Health Organisation, WHO, Situation report Iraq, Week 31 (World Health Organization, WHO Regional office for the Eastern Mediterranean, 2022).
    1. Mukherjee D., Roy S., Iturburu A., Jaiswal V., Crimean Congo hemorrhagic fever in COVID 19 times, an emerging concern in Iraq. Ann. Med. Surg. (Lond) 80, 104273 (2022). - PMC - PubMed
    1. Mertens M., Schmidt K., Ozkul A., Groschup M. H., The impact of Crimean-Congo hemorrhagic fever virus on public health. Antiviral Res. 98, 248–260 (2013). - PubMed
    1. Neogi U., et al. , Multi-omics insights into host-viral response and pathogenesis in Crimean-Congo hemorrhagic fever viruses for novel therapeutic target. Elife 11, e76071 (2022). - PMC - PubMed
    1. Yilmaz G. R., et al. , The epidemiology of Crimean-Congo hemorrhagic fever in Turkey, 2002–2007. Int. J. Infect. Dis. 13, 380–386 (2009). - PubMed

Publication types