. 2023 Sep 12;120(37):e2308891120.
doi: 10.1073/pnas.2308891120. Epub 2023 Sep 5.

Mouse models of SYNGAP1-related intellectual disability

Affiliations

Mouse models of SYNGAP1-related intellectual disability

Yoichi Araki et al. Proc Natl Acad Sci U S A. .

Abstract

SYNGAP1 is a Ras-GTPase-activating protein highly enriched at excitatory synapses in the brain. De novo loss-of-function mutations in SYNGAP1 are a major cause of genetically defined neurodevelopmental disorders (NDDs). These mutations are highly penetrant and cause SYNGAP1-related intellectual disability (SRID), an NDD characterized by cognitive impairment, social deficits, early-onset seizures, and sleep disturbances. Studies in rodent neurons have shown that Syngap1 regulates developing excitatory synapse structure and function, and heterozygous Syngap1 knockout mice have deficits in synaptic plasticity, learning, and memory and have seizures. However, how specific SYNGAP1 mutations found in humans lead to disease has not been investigated in vivo. To explore this, we utilized the CRISPR-Cas9 system to generate knock-in mouse models with two distinct known causal variants of SRID: one with a frameshift mutation leading to a premature stop codon, SYNGAP1; L813RfsX22, and a second with a single-nucleotide mutation in an intron that creates a cryptic splice acceptor site leading to premature stop codon, SYNGAP1; c.3583-9G>A. While reduction in Syngap1 mRNA varies from 30 to 50% depending on the specific mutation, both models show ~50% reduction in Syngap1 protein, have deficits in synaptic plasticity, and recapitulate key features of SRID including hyperactivity and impaired working memory. These data suggest that half the amount of SYNGAP1 protein is key to the pathogenesis of SRID. These results provide a resource to study SRID and establish a framework for the development of therapeutic strategies for this disorder.

Keywords: dendritic development; neurodevelopmental disorders; synaptic GTPase-activating protein; synaptic plasticity.


Conflict of interest statement

The authors declare no competing interest.

Figures
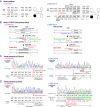
Fig. 1.
Fig. 1.
Generation of SRID model mice. (A) Schematic of SRID mutations. SYNGAP1; L813RfsX22, a frameshift mutation leading to a premature stop codon. SYNGAP1; c.3583-9G>A, a single nucleotide mutation in an intron that creates a cryptic splice acceptor site, the addition of 17 bp at the end of exon 17, and a premature stop codon. Pedigrees of affected individuals are shown to the right of each mutation. (B) CRISPR/Cas9 gene engineering for SRID model mice. Guide RNA, Cas9 protein, and homology-directed repair DNA were injected into fertilized egg. (C) Genomic DNA isolated from heterozygous SRID mice was sequenced by Sanger sequencing. The electropherogram near the disease mutation site is shown. SRID mutations, restriction enzyme sites for screening, and protospacer adjacent motif (PAM) site deletions are shown. Underline denotes the CRISPR technical mutations. Rectangular boxes indicate the splicing acceptor site (black: splicing-1, cyan: splicing-2, red: cryptic splicing site emerged by mutation, dotted: obsolete by disease mutation). (D) cDNA isolated from heterozygous SRID mice was sequenced by Sanger sequencing. The electropherogram near the disease mutation site is shown. In Syngap1+/L813Rfsx22 mice, sequencing confirmed SRID mutation L813RfsX22, XbaI site creation for screening, and PAM site deletions. Sequencing of cDNA from Syngap1+/c.3583-9G>A mice confirmed the aberrant 7 bp addition at the beginning of Exon 17 (red boxes). Blue boxes indicate the 6 bp difference between splicing-1 and splicing-2. Underline denotes the CRISPR technical mutations.
Fig. 2.
Fig. 2.
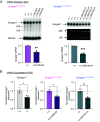
Expression of mRNA from SRID disease model mice was significantly reduced by 30 to 50%. (A) Northern blotting of mRNAs from SRID mice. The autoradiogram of northern blotting using the total brain of wild-type (+/+) or heterozygous mice (+/L813RfsX22 or +/c.3583-9G>A) was shown. L813RfsX22; Rps26 bands were used for loading controls. The amount of Syngap1 mRNA was normalized by Rps26 mRNA levels. C.3583-9G>A; 28S and 18S ribosomal RNA were used for loading controls. SYNGAP1 mRNA was normalized by ribosomal RNA levels. A two-tailed t test was performed (*P < 0.05, **P < 0.01, and ***P < 0.001). (B) Quantitative PCR from SRID mice and Syngap1+/− mice. The mRNA quantification normalized to actin expression is shown. All mutant mice show 30 to 40% Syngap1 mRNA reduction. A two-tailed t test was performed (*P < 0.05, **P < 0.01, and ***P < 0.001).
Fig. 3.
Fig. 3.
Severe reduction of Syngap1 protein expression and aberrant downstream signaling (Syngap1-Ras-ERK) in SRID mice. (A) Western blotting of total Syngap1 proteins and their c-terminal isoforms. L813RfsX22; the western blotting using N-terminal antibody was conducted to check for any truncated protein expression. Truncated protein expression was not detectable. One-way ANOVA followed by Tukey’s post hoc test [genotypes F (3,20) = 26.06; P < 0.0001, n = 4 to 7 independent brain samples, ***P < 0.001, **P < 0.01, and *P < 0.05) was performed. c.3583-9G>A; western blotting for all Syngap1 C-terminal isoforms is shown. Two-way ANOVA followed by Tukey’s post hoc test [isoforms F (4,30) = 0.2621; P = 0.899, genotype F (1,30) = 53.07; P < 0.0001, interaction F (4,30) = 0.2621; P = 0.899, n = 3 to 4 individual brains, ***P < 0.001, **P < 0.01, and *P < 0.05]. (B) Western blots of phosphorylated ERK (active)/total ERK from Syngap1 mutant lines. ERK activation levels were quantified by calculating phosphorylated ERK levels normalized with total ERK levels. Two-tailed t tests (*P < 0.05, **P < 0.01, and ***P < 0.001).
Fig. 4.
Fig. 4.
RNA-seq reveals aberrant splicing and converging downstream transcriptional changes in Syngap1+/c.3583-9G>A and Syngap1+/− mice. (A) Splice junction read abundance quantified as Reads Per Million Gapped (RPMG) between exons 16 and 17 of Syngap1. Reads with splice donor site at the 3′ end of exon 16 spliced to the “VK” exon extension at the 5′ end of exon 17 and non-VK splice acceptor 6 bp downstream in +/+ littermates, whereas only the Syngap1+/c.3583-9G>A mice displayed a small fraction of cryptic splice acceptor site −7 bp upstream, indicating efficient NMD. A two-way ANOVA revealed a significant effect of genotype, isoform, and interaction [genotype F (1, 5) = 50.67; P = 0.0008, isoform F (2, 10) = 297.7; P < 0.0001, interaction F (2, 10) = 49.32; P < 0.0001, n = 3 to 4 samples/group) and Šídák’s post hoc tests confirmed significant decreases in VK (P < 0.0001) and non-VK splice junction abundance (P < 0.0044). (B) Total Syngap1 expression was significantly decreased in Syngap1+/c.3583-9G>A mice (+/+: 1.000 ± 0.027; +/c.3583-9G>A: 0.626 ± 0.039; P = 0.0007, unpaired t test). (C) Splice junction read abundance in Syngap1+/− mice. Reads with Syngap1 splice acceptor site at the 5′ end of exon 8 spliced to the 5′ end of exon 7 in +/+ littermates, whereas only the Syngap1+/− mice displayed aberrant exon 6 and 7 skipping, verifying the intended knockout of exons 6 and 7. Note the significant amount of exon 5-8 junction reads detected, which indicates inefficient NMD. A two-way ANOVA revealed a significant effect of isoform and interaction [genotype F (1, 4) = 2.728; P = 0.1740, isoform F (1, 4) = 124.7; P < 0.0004, interaction F (1, 4) = 40.13; P < 0.0001, n = 3 to 4 samples/group) and Šídák’s post hoc tests confirmed significant decreases in exon 7-8 (P = 0.03) and exon 4-8 splice junction abundance (P < 0.0011). (D) Total Syngap1 expression was not significantly decreased in Syngap1+/− mice (+/+: 1.000 ± 0.087; +/−: 0.941 ± 0.040; P = 0.5714, unpaired t test). (E and F) Differential gene expression analysis of Syngap1+/c.3583-9G>A (E) and Syngap1+/− (F) mice reveals converging downstream regulated genes. (G) Gene set enrichment analysis of a merged dataset of both Syngap1 loss-of-function mouse lines (Syngap1+/c.3583-9G>A and Syngap1+/−) revealed transcriptional regulation significantly enriched in a number of biological processes (BP). Gene ratio is the portion of genes that significantly are significantly regulated from the total number of genes associated to that process. Genes with increased and decreased expression were pooled to visualize general roles of Syngap1-regulated genes rather than the polarity of regulation in each pathway.
Fig. 5.
Fig. 5.
SRID mice exhibit synaptic plasticity deficits. (A, 1) Averaged population field CA1 recordings of TBS-LTP time course obtained from brain slices of Syngap1+/L813RfsX22 mice and wild-type (Syngap1+/+) littermates. All data points are normalized to the averaged baseline fEPSP slope. Inset: Example averaged fEPSP traces from Syngap1+/+ and Syngap1+L813RfsX22 slices recorded during baseline (black) and 40 to 60 min after TBS-LTP induction (red). (A, 2) Quantification of averaged TBS-LTP in Syngap1+L813RfsX22 and Syngap1+/+ littermates. Individual data points are superimposed. TBS-LTP is calculated by the ratio of the mean fEPSP slope measured 40 to 60 min after TBS-LTP induction (gray shaded region) divided by the averaged fEPSP baseline slope within each recorded sample. (Syngap1+/+: n = 10, 156.8 ± 7.88% SEM; Syngap1+/L813RfsX22: n = 12, 131.1 ± 5.80% SEM) Statistics: D’Agostino & Pearson test: non-normal distribution, Mann–Whitney rank-sum test, P = 0.0169. Error bars and shading represent the SEM. *P < 0.05, **P < 0.01, and ***P < 0.001. (B, 1) Averaged population field CA1 recordings of TBS-LTP time course obtained from brain slices of Syngap1+/c.3583-9G>A mice and Syngap1+/+ littermates. Inset: Example averaged fEPSP traces from Syngap1+/c.3583-9G>A and Syngap1+/+ slices recorded during baseline (black) and 40 to 60 min after TBS-LTP induction (red). (B, 2) Quantification of averaged TBS-LTP in Syngap1+/c.3583-9G>A mice and Syngap1+/+ littermates. Individual data points are superimposed. (Syngap1+/+: n = 18, 169.9 ± 6.89% SEM; Syngap1+/c.3583-9G>A: n = 14, 134.9 ± 5.90% SEM) Statistics: D’Agostino and Pearson test: normal distribution, unpaired t test, P = 0.0008. Error bars and shading represent the SEM. *P < 0.05, **P < 0.01, and ***P < 0.001.
Fig. 6.
Fig. 6.
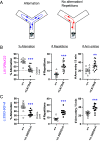
Recapitulation of working memory deficits, repetitive behavior, and hyperactivity in SRID model mice. (A) Diagram of the experimental Y-maze setup. An arm entry was recorded as an alternation when the mouse fully entered an arm that it had not visited most recently (e.g., arm A to arm B to arm C is an alternation; arm A to arm B to arm A is not an alternation). (B) Spontaneous alternation rate of arm visits (% alternation), the number of repetitive arm visits (# repetitions), and the number of arm visits (# arm entries) for wild type (Syngap1+/+) or Syngap1+/L813RfsX22 are shown. A two-tailed t test was performed (*P < 0.05, **P < 0.01, and ***P < 0.001). (C) % alternation, # repetitions, and # arm entries of for wild type (Syngap1+/+) or Syngap1+/c.3583-9G>A are shown. A two-tailed t test was performed (*P < 0.05, **P < 0.01, and ***P < 0.001).

Update of

References

    1. Fischbach G. D., Lord C., The Simons Simplex Collection: A resource for identification of autism genetic risk factors. Neuron 68, 192–195 (2010). - PubMed
    1. Sanders S. J., et al. , Insights into autism spectrum disorder genomic architecture and biology from 71 risk loci. Neuron 87, 1215–1233 (2015). - PMC - PubMed
    1. Satterstrom F. K., et al. , Large-scale exome sequencing study implicates both developmental and functional changes in the neurobiology of autism. Cell 180, 1–17 (2020). - PMC - PubMed
    1. Deciphering Developmental Disorders Study, Prevalence and architecture of de novo mutations in developmental disorders. Nature 542, 433–438 (2017). - PMC - PubMed
    1. Deciphering Developmental Disorders Study, Large-scale discovery of novel genetic causes of developmental disorders. Nature 519, 223–228 (2015). - PMC - PubMed

Publication types