

Convergence in sympatric swallowtail butterflies reveals ecological interactions as a key driver of worldwide trait diversification
- PMID: 37669385
- PMCID: PMC10500277
- DOI: 10.1073/pnas.2303060120
Convergence in sympatric swallowtail butterflies reveals ecological interactions as a key driver of worldwide trait diversification
Abstract
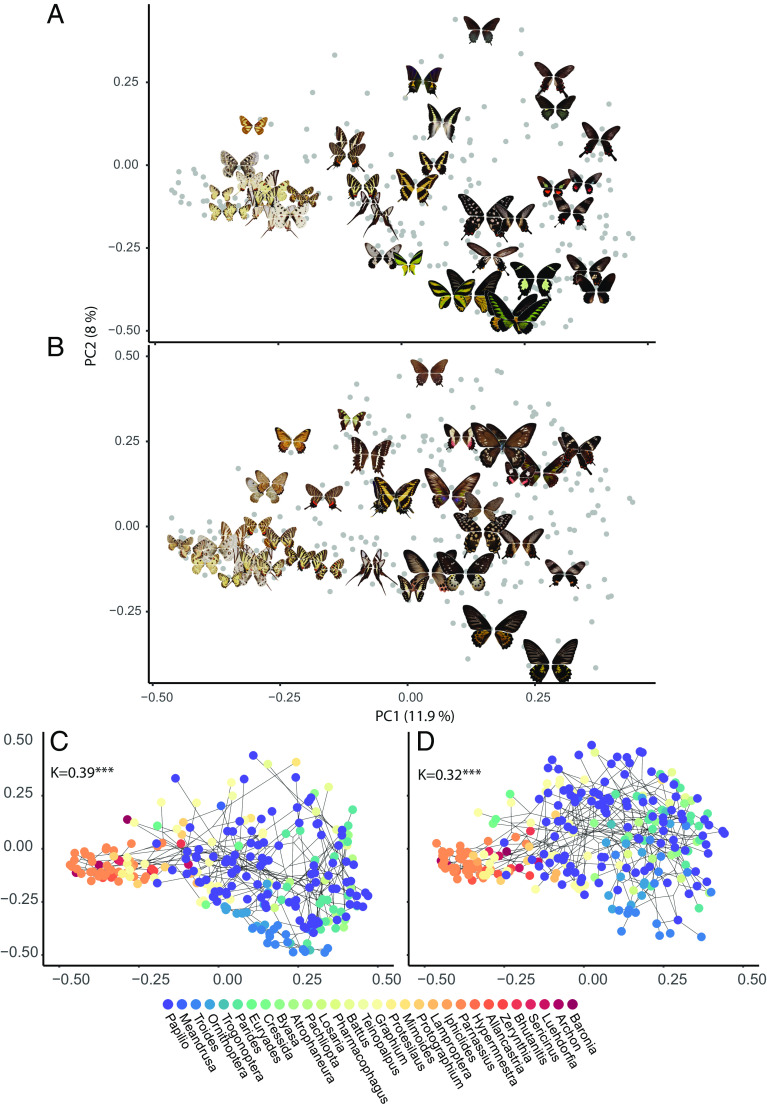
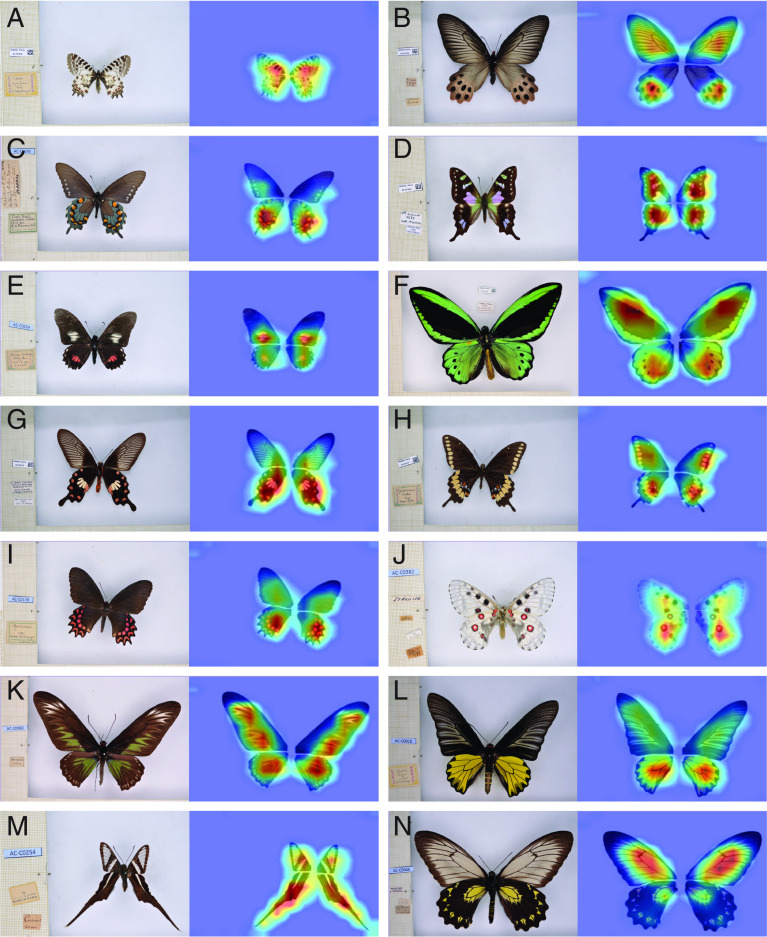
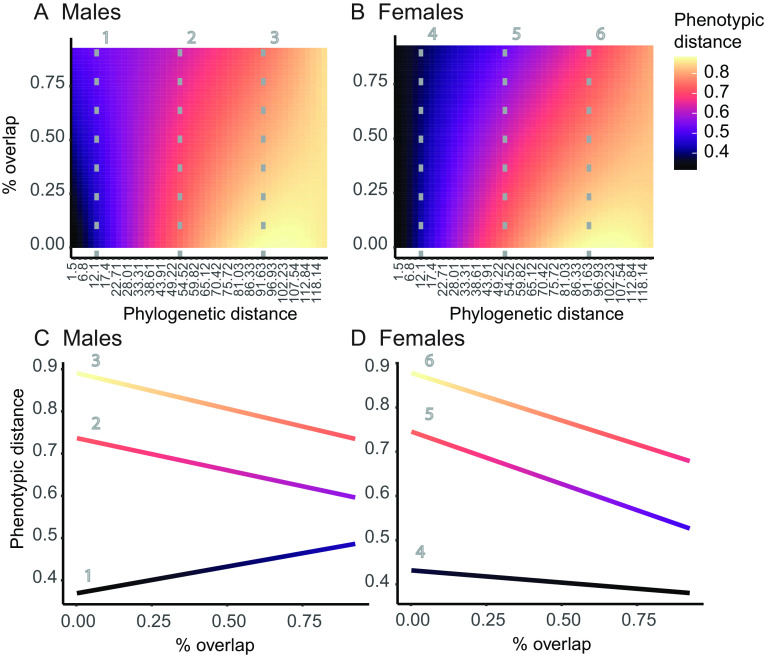
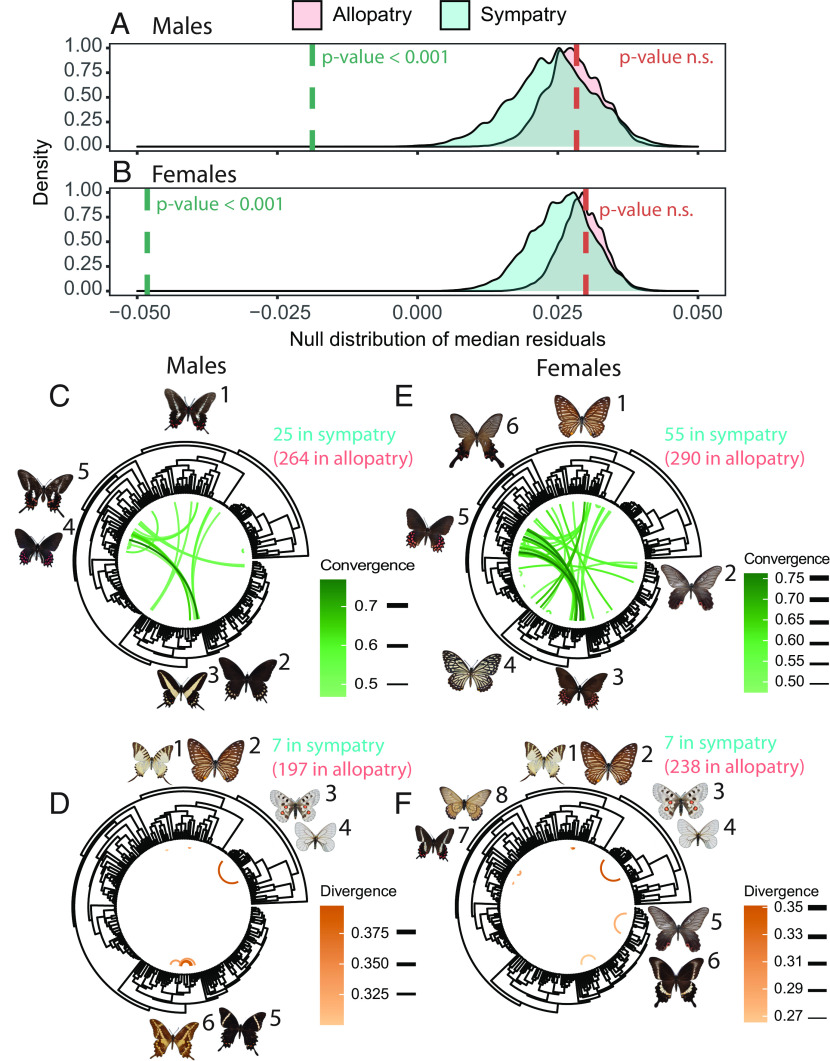
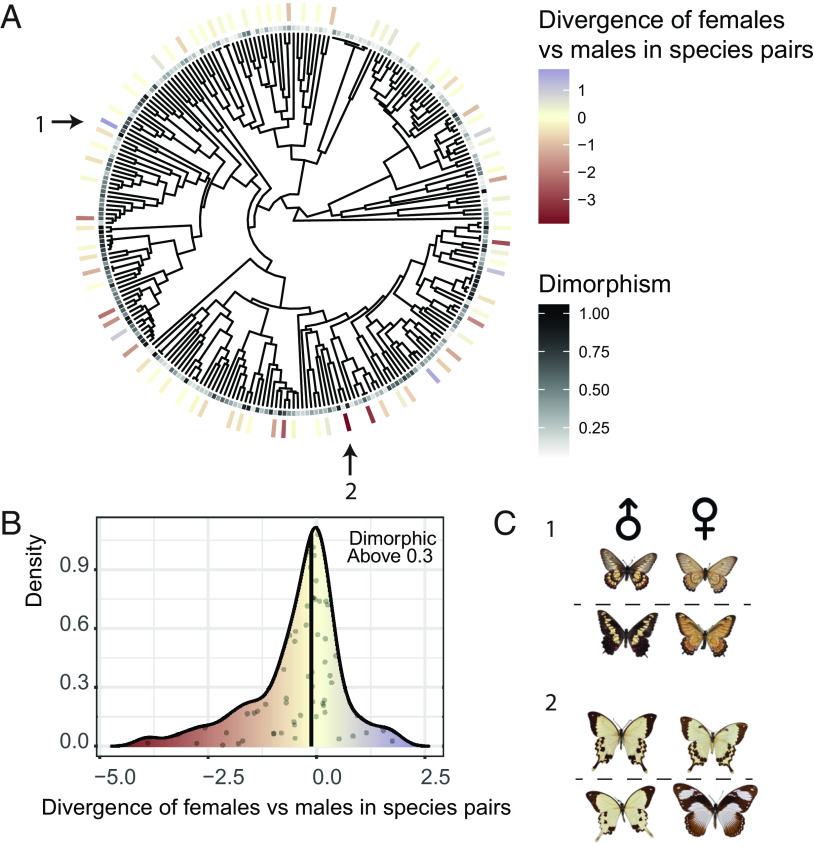
Ecological interactions can promote phenotypic diversification in sympatric species. While competition can enhance trait divergence, other ecological interactions may promote convergence in sympatric species. Within butterflies, evolutionary convergences in wing color patterns have been reported between distantly related species, especially in females of palatable species, where mimetic color patterns are promoted by predator communities shared with defended species living in sympatry. Wing color patterns are also often involved in species recognition in butterflies, and divergence in this trait has been reported in closely related species living in sympatry as a result of reproductive character displacement. Here, we investigate the effect of sympatry between species on the convergence vs. divergence of their wing color patterns in relation to phylogenetic distance, focusing on the iconic swallowtail butterflies (family Papilionidae). We developed an unsupervised machine learning-based method to estimate phenotypic distances among wing color patterns of 337 species, enabling us to finely quantify morphological diversity at the global scale among species and allowing us to compute pairwise phenotypic distances between sympatric and allopatric species pairs. We found phenotypic convergence in sympatry, stronger among distantly related species, while divergence was weaker and restricted to closely related males. The convergence was stronger among females than males, suggesting that differential selective pressures acting on the two sexes drove sexual dimorphism. Our results highlight the significant effect of ecological interactions driven by predation pressures on trait diversification in Papilionidae and provide evidence for the interaction between phylogenetic proximity and ecological interactions in sympatry, acting on macroevolutionary patterns of phenotypic diversification.
Keywords: Papilionidae; machine learning; macroevolution; mimicry; wing color pattern.
Conflict of interest statement
The authors declare no competing interest.
Figures
Comment in
-
The global butterfly effect of wing pattern convergence.Proc Natl Acad Sci U S A. 2023 Oct 3;120(40):e2314443120. doi: 10.1073/pnas.2314443120. Epub 2023 Sep 20. Proc Natl Acad Sci U S A. 2023. PMID: 37729172 Free PMC article. No abstract available.
Similar articles
-
Convergence in sympatry: Evolution of blue-banded wing pattern in Morpho butterflies.J Evol Biol. 2021 Feb;34(2):284-295. doi: 10.1111/jeb.13726. Epub 2020 Dec 5. J Evol Biol. 2021. PMID: 33119141
-
The Limits of Evolutionary Convergence in Sympatry: Reproductive Interference and Historical Constraints Leading to Local Diversity in Warning Traits.Am Nat. 2023 May;201(5):E110-E126. doi: 10.1086/723625. Epub 2023 Mar 22. Am Nat. 2023. PMID: 37130234
-
Ultraviolet in swallowtail butterflies: contrasted dorso-ventral evolution highlights a trade-off between natural and sexual selection on visual cues.Evolution. 2025 Jun 14;79(6):995-1006. doi: 10.1093/evolut/qpaf044. Evolution. 2025. PMID: 40052579
-
Secondary Sympatry as a Sorting Process.Ecol Lett. 2025 Apr;28(4):e70108. doi: 10.1111/ele.70108. Ecol Lett. 2025. PMID: 40213962 Free PMC article. Review.
-
Adaptive evolution of butterfly wing shape: from morphology to behaviour.Biol Rev Camb Philos Soc. 2019 Aug;94(4):1261-1281. doi: 10.1111/brv.12500. Epub 2019 Feb 21. Biol Rev Camb Philos Soc. 2019. PMID: 30793489 Review.
Cited by
-
The global butterfly effect of wing pattern convergence.Proc Natl Acad Sci U S A. 2023 Oct 3;120(40):e2314443120. doi: 10.1073/pnas.2314443120. Epub 2023 Sep 20. Proc Natl Acad Sci U S A. 2023. PMID: 37729172 Free PMC article. No abstract available.
References
-
- Cavender-Bares J., Ackerly D. D., Baum D. A., Bazzaz F. A., Phylogenetic overdispersion in Floridian oak communities. Am. Nat. 163, 823–843 (2004). - PubMed
Publication types
MeSH terms
LinkOut - more resources
Full Text Sources
