

Membrane Tension Inhibits Lipid Mixing by Increasing the Hemifusion Stalk Energy
- PMID: 37669531
- PMCID: PMC7615193
- DOI: 10.1021/acsnano.3c04293
Membrane Tension Inhibits Lipid Mixing by Increasing the Hemifusion Stalk Energy
Abstract
Fusion of biological membranes is fundamental in various physiological events. The fusion process involves several intermediate stages with energy barriers that are tightly dependent on the mechanical and physical properties of the system, one of which is membrane tension. As previously established, the late stages of fusion, including hemifusion diaphragm and pore expansions, are favored by membrane tension. However, a current understanding of how the energy barrier of earlier fusion stages is affected by membrane tension is lacking. Here, we apply a newly developed experimental approach combining micropipette-aspirated giant unilamellar vesicles and optically trapped membrane-coated beads, revealing that membrane tension inhibits lipid mixing. We show that lipid mixing is 6 times slower under a tension of 0.12 mN/m compared with tension-free membranes. Furthermore, using continuum elastic theory, we calculate the dependence of the hemifusion stalk formation energy on membrane tension and intermembrane distance and find the increase in the corresponding energy barrier to be 1.6 kBT in our setting, which can explain the increase in lipid mixing time delay. Finally, we show that tension can be a significant factor in the stalk energy if the pre-fusion intermembrane distance is on the order of several nanometers, while for membranes that are tightly docked, tension has a negligible effect.
Keywords: continuum elasticity; membrane fusion; micropipette aspiration; optical tweezers; tension.
Conflict of interest statement
The authors declare no competing financial interest.
Figures
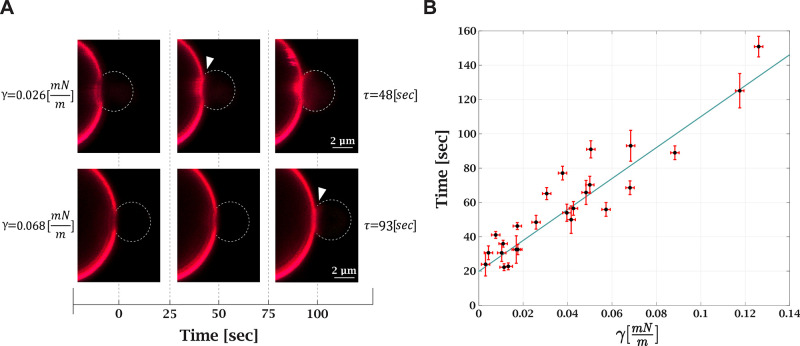
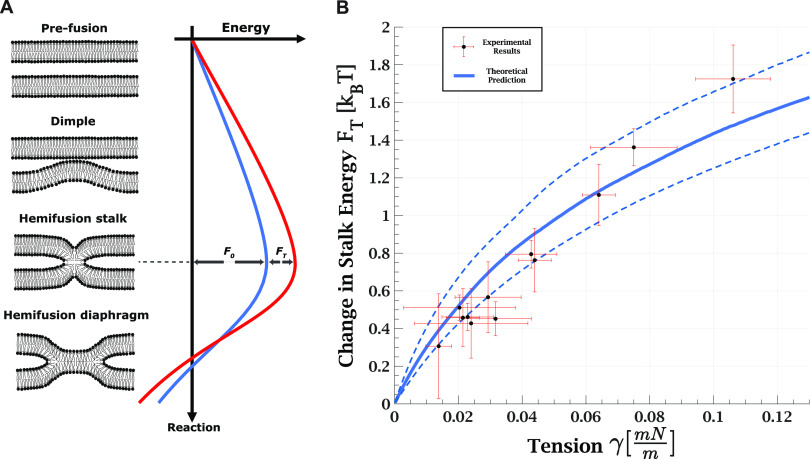
 , with
  being the ratio between lipid mixing time
delay with tension γ to the lowest measured tension for each
GUV. The error in the tension corresponds to the initial tension deviation
from zero for the lowest tension measurement of the specific GUV.
The continuous solid line is the theoretically predicted increase
in the stalk formation energy due to tension. The dashed lines represent
the validity limits of the theoretical prediction due to uncertainty
in the external pressure. Bilayer bending rigidity is taken as 35 kBT for the theoretical prediction.
being the ratio between lipid mixing time
delay with tension γ to the lowest measured tension for each
GUV. The error in the tension corresponds to the initial tension deviation
from zero for the lowest tension measurement of the specific GUV.
The continuous solid line is the theoretically predicted increase
in the stalk formation energy due to tension. The dashed lines represent
the validity limits of the theoretical prediction due to uncertainty
in the external pressure. Bilayer bending rigidity is taken as 35 kBT for the theoretical prediction.Similar articles
-
High curvature promotes fusion of lipid membranes: Predictions from continuum elastic theory.Biophys J. 2023 May 16;122(10):1868-1882. doi: 10.1016/j.bpj.2023.04.018. Epub 2023 Apr 18. Biophys J. 2023. PMID: 37077047 Free PMC article.
-
Lipid intermediates in membrane fusion: formation, structure, and decay of hemifusion diaphragm.Biophys J. 2002 Nov;83(5):2634-51. doi: 10.1016/S0006-3495(02)75274-0. Biophys J. 2002. PMID: 12414697 Free PMC article.
-
Calculating Transition Energy Barriers and Characterizing Activation States for Steps of Fusion.Biophys J. 2016 Mar 8;110(5):1110-24. doi: 10.1016/j.bpj.2016.01.013. Biophys J. 2016. PMID: 26958888 Free PMC article.
-
Structural intermediates in influenza haemagglutinin-mediated fusion.Mol Membr Biol. 1999 Jan-Mar;16(1):33-42. doi: 10.1080/096876899294733. Mol Membr Biol. 1999. PMID: 10332735 Review.
-
The mechanisms of lipid-protein rearrangements during viral infection.Bioelectrochemistry. 2004 Jun;63(1-2):129-36. doi: 10.1016/j.bioelechem.2003.10.016. Bioelectrochemistry. 2004. PMID: 15110263 Review.
Cited by
-
Boosting Lipofection Efficiency Through Enhanced Membrane Fusion Mechanisms.Int J Mol Sci. 2024 Dec 18;25(24):13540. doi: 10.3390/ijms252413540. Int J Mol Sci. 2024. PMID: 39769303 Free PMC article. Review.
-
Lipid asymmetry and membrane trafficking: Transbilayer distribution of structural phospholipids as regulators of exocytosis and endocytosis.J Biol Chem. 2025 Jul 2;301(8):110441. doi: 10.1016/j.jbc.2025.110441. Online ahead of print. J Biol Chem. 2025. PMID: 40609796 Free PMC article. Review.
References
Grants and funding
LinkOut - more resources
Full Text Sources
Research Materials
