. 2023 Sep 5;14(1):5434.
doi: 10.1038/s41467-023-41128-6.

Pathological pallidal beta activity in Parkinson's disease is sustained during sleep and associated with sleep disturbance

Affiliations

Pathological pallidal beta activity in Parkinson's disease is sustained during sleep and associated with sleep disturbance

Zixiao Yin et al. Nat Commun. .

Abstract

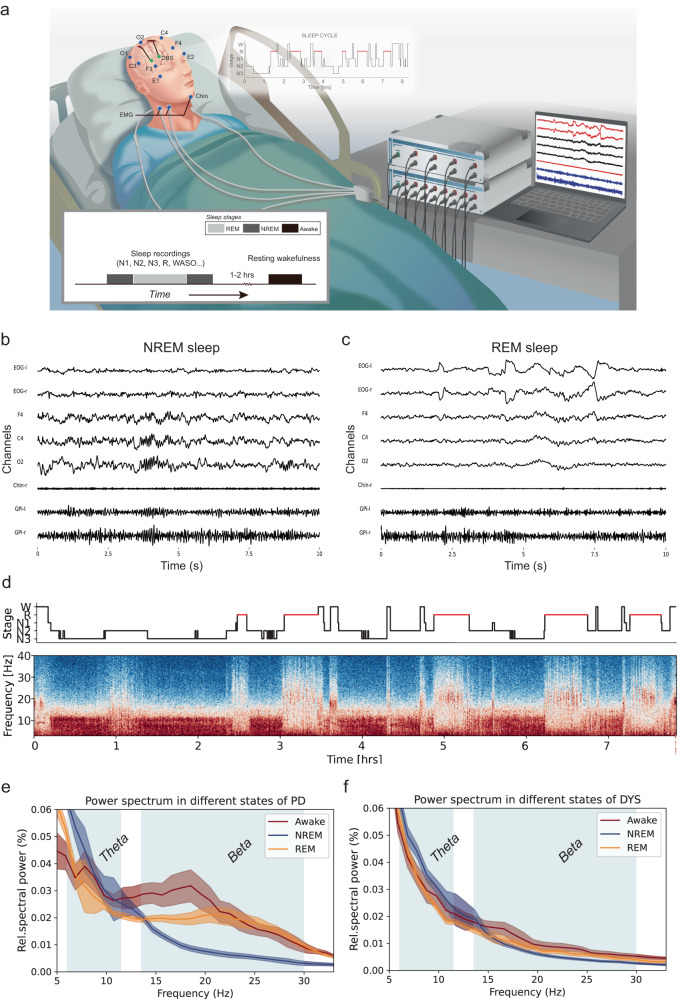
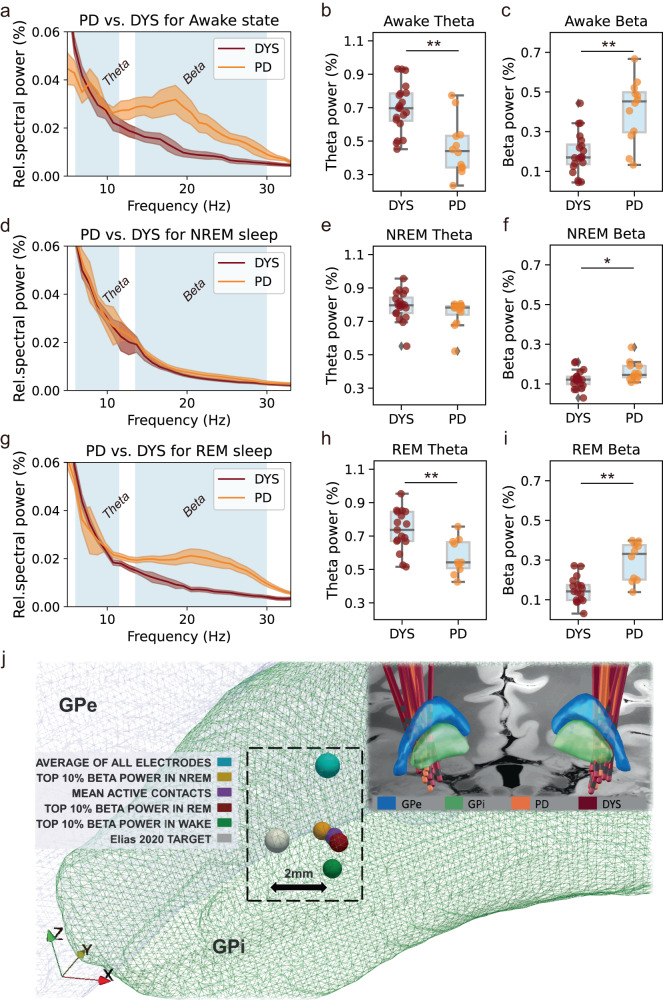
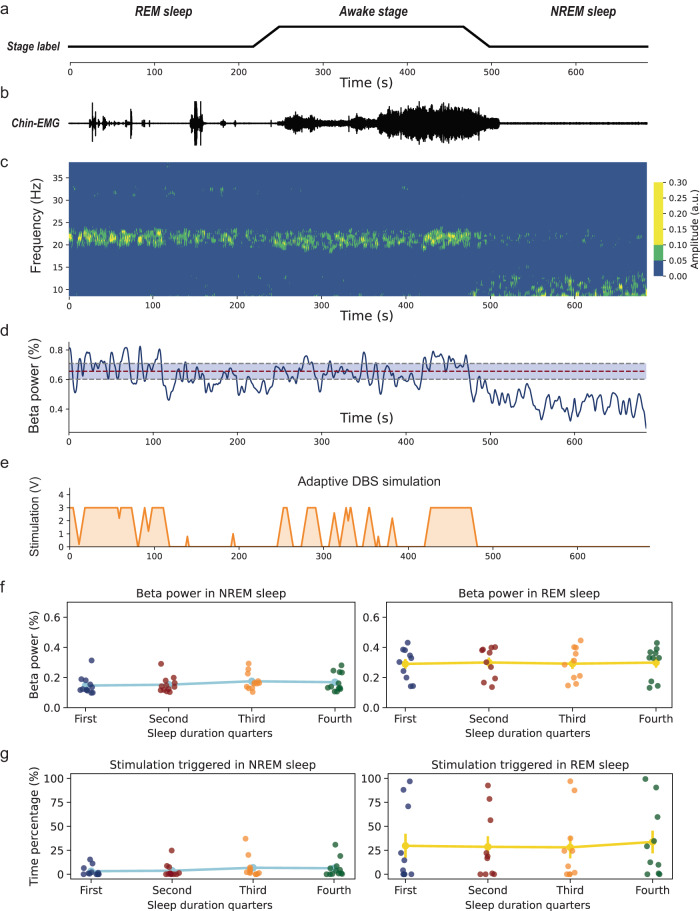
Parkinson's disease (PD) is associated with excessive beta activity in the basal ganglia. Brain sensing implants aim to leverage this biomarker for demand-dependent adaptive stimulation. Sleep disturbance is among the most common non-motor symptoms in PD, but its relationship with beta activity is unknown. To investigate the clinical potential of beta activity as a biomarker for sleep quality in PD, we recorded pallidal local field potentials during polysomnography in PD patients off dopaminergic medication and compared the results to dystonia patients. PD patients exhibited sustained and elevated beta activity across wakefulness, rapid eye movement (REM), and non-REM sleep, which was correlated with sleep disturbance. Simulation of adaptive stimulation revealed that sleep-related beta activity changes remain unaccounted for by current algorithms, with potential negative outcomes in sleep quality and overall quality of life for patients.


Conflict of interest statement

W.-J.N. received honoraria for talks unrelated to this manuscript from Medtronic which is a manufacturer of deep brain stimulation devices. A.A.K. is on the advisory board of Boston Scientific and Medtronic and has received honoraria unrelated to this manuscript from Boston Scientific, Medtronic, Stadapharm, and Teva, companies manufacturing deep brain stimulation or pharmaceutical therapies. H.B. is a consultant of Alpha Omega and has received travel honoraria from Boston Scientific and Medtronic unrelated to this manuscript. The remaining authors declare no competing interests.

Figures

Fig. 1
Fig. 1. Recordings of pallidal local field potentials in parallel to polysomnography in subjects with Parkinson’s disease and dystonia.
a Schematic representation of the sleep recording. Pallidal local field potentials are recorded in parallel to the polysomnography consisting of the electroencephalogram (EEG), electrooculogram (EOG), and electromyogram (EMG). In the morning after sleep recording, a 5-min recording of resting wakefulness is further obtained. b shows 10 s of characteristic N2 sleep from subject PD-8, epoch 26. Characteristic sleep spindles are seen in polysomnography. Note that for visualization, the amplitude of the pallidal channels is amplified. c shows 10 s of characteristic REM sleep from subject PD-8, epoch 16. Prominent rapid eye movement, low-voltage waves, and muscle atonia are seen in EOG, EEG, and EMG, respectively. d shows a representative spectrogram of a whole-night recording from subject PD-8 with the hypnogram on top. e shows the average power spectra across awake, NREM, and REM sleep epochs in all patients with Parkinson’s disease. f shows the average power spectra across awake, NREM, and REM sleep epochs in all patients with dystonia. Shaded areas represent SEM. Theta and beta frequency band ranges are highlighted in blue.
Fig. 2
Fig. 2. Comparisons of power spectra between Parkinson’s disease (PD) and dystonia across different sleep stages and the spatial localization of beta in PD.
a–c Power spectra and comparisons of theta and beta power in awake epochs between PD and dystonia. **P for theta power<0.001; **P for beta power=0.001; n for PD subjects = 12; n for dystonia subjects = 20; two-sided Mann–Whitney U test. df Power spectra and comparisons of theta and beta power in non-rapid eye movement (NREM) sleep between PD and dystonia. P for theta power = 0.083; * P for beta power = 0.021; n for PD subjects = 12; n for dystonia subjects = 20; two-sided Mann–Whitney U test. gi Power spectra and comparisons of theta and beta power in REM sleep between PD and dystonia. **P for theta power = 0.004; **P for beta power = 0.001; n for PD subjects = 10; n for dystonia subjects = 17; two-sided Mann–Whitney U test. Shaded areas in all spectrum plots represent SEM. For all box plots, the lower and upper borders of the box represent the 25th and 75th percentiles, respectively. The centerline represents the median. The whiskers extend to the smallest and largest data points that are not outliers (1.5 times the interquartile range). j A visualization of top-beta sites in different sleep stages in Montreal Neurological Institute space (wakefulness [X = −20.7, Y = −6.8, Z = −5.7], NREM [X = −21.5, Y = −5.7, Z = −5.1], and REM [X = −20.7, Y = −6.1, Z = −5.2] sleep) relative to the position of internal globus pallidus (GPi) and external globus pallidus (GPe). The three top-beta sites located near, with no significant difference in coordinates in the X, Y, or Z axes (P = 0.463, 0.603, and 0.944 for X, Y, and Z axes, respectively, two-sided Kruskal–Wallis test). Three sites of interest are also displayed including (1) the average of all electrodes (X = −21.4, Y = −4.6, Z = −3.3), (2) the mean active contacts (X = −21.1, Y = −5.7, Z = −5.3), and (3) a literature-based coordinate (X = −22.6, Y = −6.7, Z = −4.9) described by Elias et al. to represent the optimal pallidal site for deep brain stimulation in PD. The upper right inset shows the lead localization of all 32 subjects. Source data are provided as a Source Data file.
Fig. 3
Fig. 3. Correlations between pallidal beta power and sleep disturbance ratings in Parkinson’s disease.
a Regression plots showing the Spearman correlations between beta power during non-rapid eye movement (NREM) sleep and the Pittsburgh sleep quality index (PSQI) in Parkinson’s disease (red) and dystonia (gray). The error bands are the 95% confidence interval for the regression estimate. The null hypothesis is defined as two-sided. b Bar plot showing the Spearman correlation coefficients between beta power during NREM sleep and the PSQI when analyzing the high/low beta band and the NREM 1/2/3 stage of sleep. Bars and items with Spearman correlation P < 0.05 are colored in orange and highlighted in bold, respectively. P for the two-sided Spearman correlation between NREM high-beta power and PSQI = 0.001; P for the two-sided Spearman correlation between beta power in the NREM2 stage and PSQI = 0.033. c Heat map showing the correlation matrix between beta power in different sleep–wake stages, off-medication Unified Parkinson’s Disease Rating Scale motor score (UPDRS-III), and the PSQI. Squares with Spearman correlation P < 0.05 are displayed. Source data are provided as a Source Data file.
Fig. 4
Fig. 4. Simulation of adaptive deep brain stimulation during sleep.
a Line plots showing sleep stage definitions of a 700-s recording segment obtained from the subject PD-8. b Shows the corresponding chin electromyogram activities of the 700-s recording segment. Note that in wakefulness the electromyogram activities are highest; in rapid eye movement (REM) sleep the background electromyogram activities are lower than that in non-REM (NREM) sleep despite occasional twitch-related electromyogram bursts. c Shows the time–frequency representation of pallidal activities of the 700-s sleep recording segment. a.u. refers to the arbitrary units. d shows the dynamic beta power change in the 700-s recording segment. The median beta power in wakefulness is labeled with a red dashed line and the 25th and 75th beta power in wakefulness is labeled in gray dashed lines and shaded in light blue. e Shows a simulation of adaptive deep brain stimulations using the median beta power in wakefulness as triggering thresholds. f Shows the comparison of beta power across four quarters (i.e., 0–25%, 25–50%, 50–75%, and 75–100% of the total length) of NREM (left, P = 0.098, two-sided Friedman test) and REM sleep length (right, P = 0.782, two-sided Friedman test). Data are presented as mean values ± SEM. g Shows the comparison of ON-stimulation time across four quarters of NREM (left, P = 0.258, two-sided Friedman test) and REM sleep length (right, P = 0.056, two-sided Friedman test). Data are presented as mean values ± SEM. Source data are provided as a Source Data file.

References

    1. Zahed H, et al. The neurophysiology of sleep in Parkinson’s disease. Mov. Disord. 2021;36:1526–1542. - PubMed
    1. Garcia-Borreguero D, Larrosa O, Bravo M. Parkinson’s disease and sleep. Sleep Med. Rev. 2003;7:115–129. - PubMed
    1. Postuma RB, Gagnon JF, Vendette M, Charland K, Montplaisir J. REM sleep behaviour disorder in Parkinson’s disease is associated with specific motor features. J. Neurol. Neurosurg. Psychiatry. 2008;79:1117–1121. - PubMed
    1. Postuma RB, Gagnon J-F, Vendette M, Charland K, Montplaisir J. Manifestations of Parkinson disease differ in association with REM sleep behavior disorder. Mov. Disord. 2008;23:1665–1672. - PubMed
    1. Vendette M, et al. REM sleep behavior disorder predicts cognitive impairment in Parkinson disease without dementia. Neurology. 2007;69:1843–1849. - PubMed

Publication types