. 2023 Sep 5;14(1):5414.
doi: 10.1038/s41467-023-41144-6.

Cis P-tau is a central circulating and placental etiologic driver and therapeutic target of preeclampsia

Affiliations

Cis P-tau is a central circulating and placental etiologic driver and therapeutic target of preeclampsia

Sukanta Jash et al. Nat Commun. .

Abstract

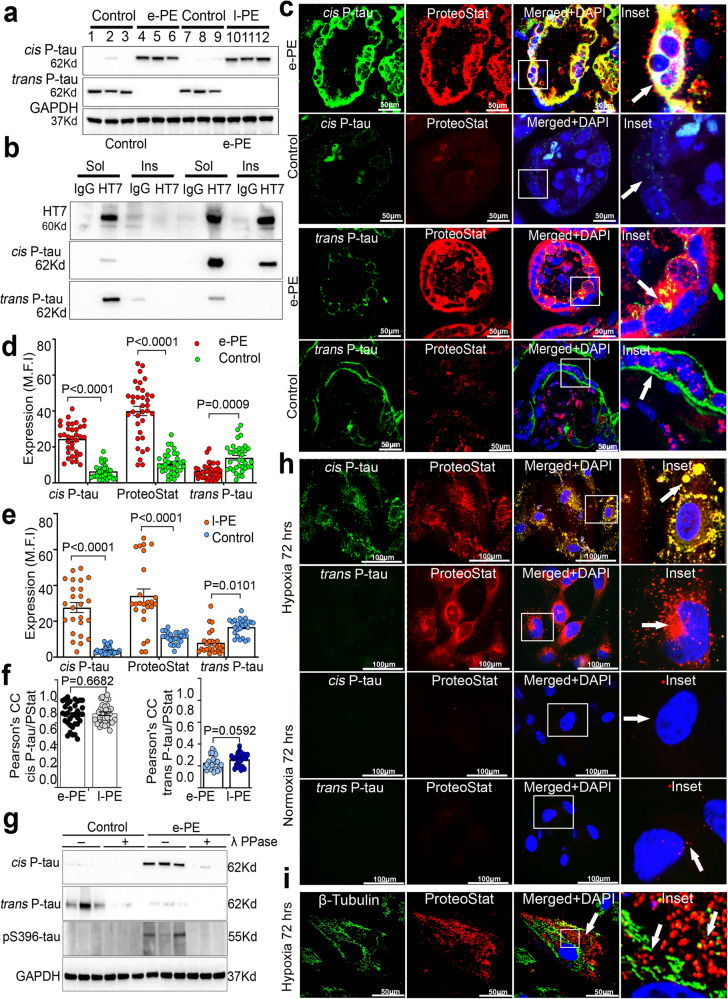
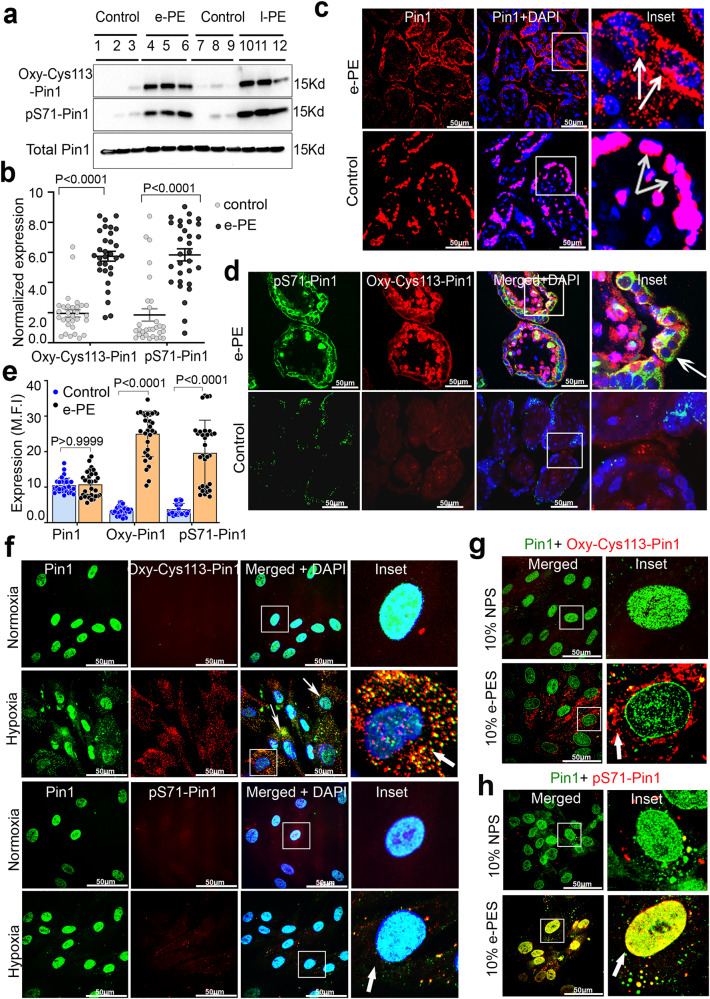
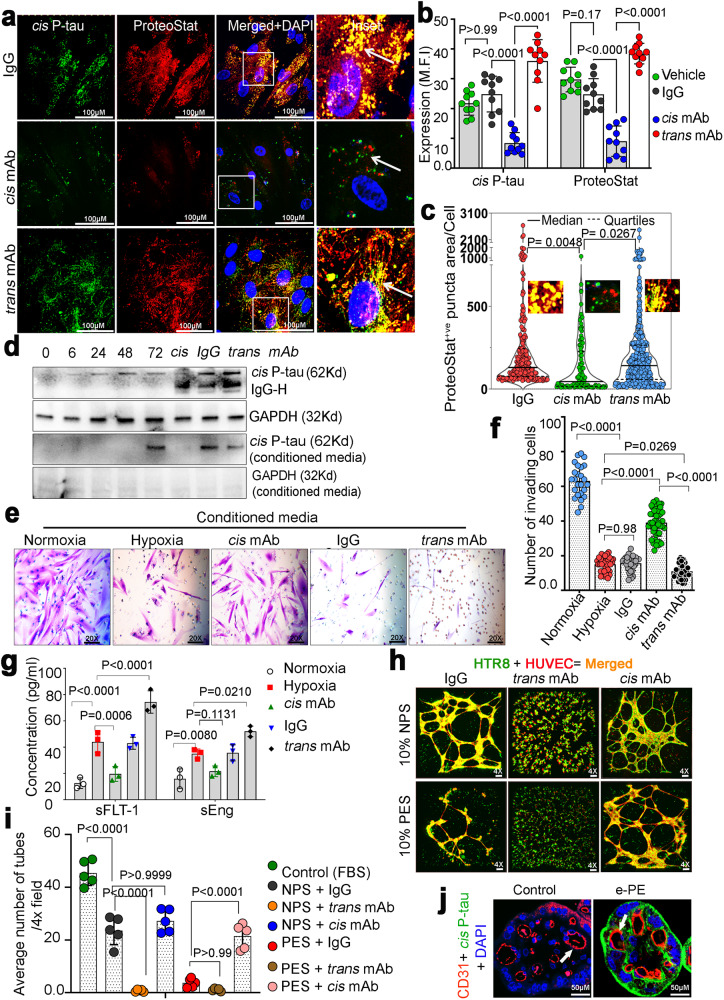
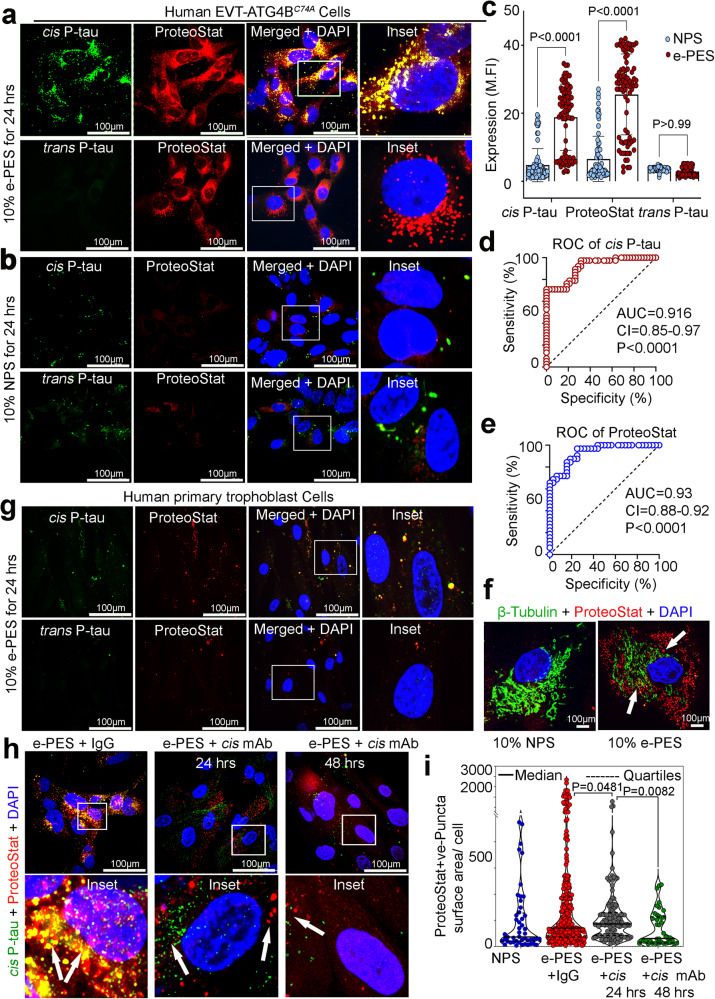
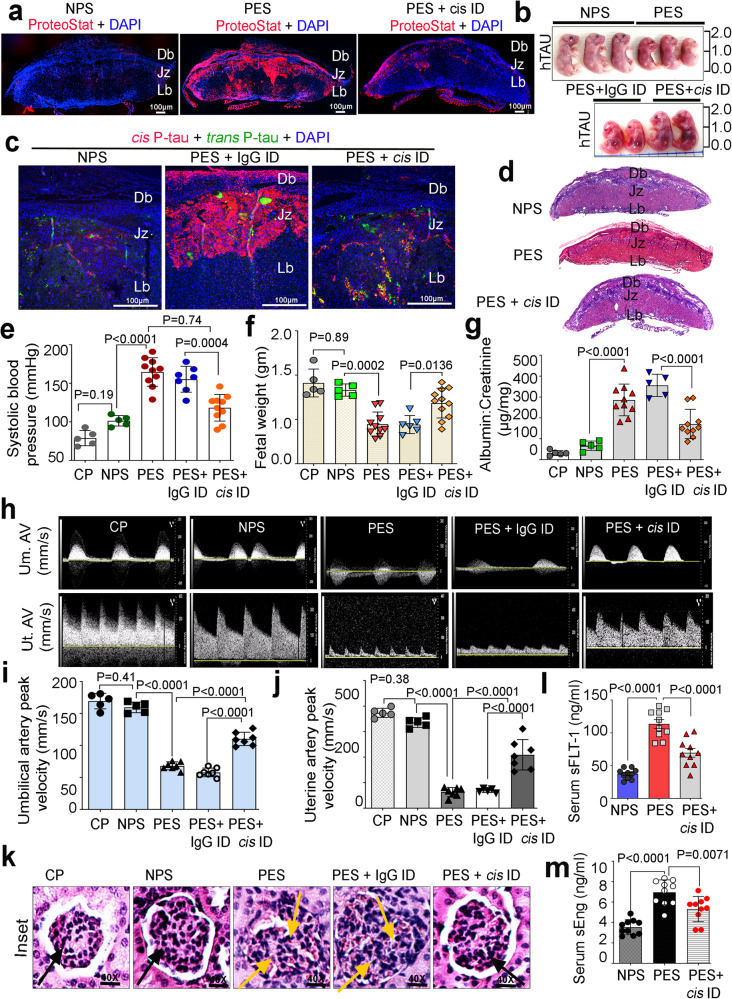
Preeclampsia (PE) is the leading cause of maternal and fetal mortality globally and may trigger dementia later in life in mothers and their offspring. However, the etiological drivers remain elusive. Cis P-tau is an early etiological driver and blood biomarker in pre-clinical Alzheimer's and after vascular or traumatic brain injury, which can be targeted by stereo-specific antibody, with clinical trials ongoing. Here we find significant cis P-tau in the placenta and serum of PE patients, and in primary human trophoblasts exposed to hypoxia or sera from PE patients due to Pin1 inactivation. Depletion of cis P-tau from PE patient sera by the antibody prevents their ability to disrupt trophoblast invasion and endovascular activity and to cause the PE-like pathological and clinical features in pregnant humanized tau mice. Our studies uncover that cis P-tau is a central circulating etiological driver and its stereo-specific antibody is valuable for early PE diagnosis and treatment.


Conflict of interest statement

X.Z.Z. and K.P.L. are inventors of issued patents and/or pending patent applications including on cis and trans P-tau antibodies and the scientific founders and former scientific advisors of and own equity in Pinteon. The other authors declare no competing interests.

Figures

Fig. 1
Fig. 1. Robust cis P-tau expression in PE placenta and trophoblast cells exposed to hypoxia.
a Immunoblots of placental protein extracts from gestational age-matched control (control; n = 3), early onset PE (e-PE; n = 3), and late onset PE (l-PE; n = 3) probed for cis and trans P-tau. b Sarkosyl soluble and insoluble fractions of placental extracts from age-matched controls (n = 7) and early-onset PE (e-PE; n = 7) were immunoprecipitated with HT7 (t-tau) and IgG antibodies before immunoblots against cis and trans P-tau. c Representative confocal images of human placental tissue sections from e-PE and age match control for double immunofluorescence with cis P-tau (green), trans P-tau (green), and ProteoStat (red). Inserts are magnified images of boxed areas. Cytotrophoblasts: complete arrow; syncytiotrophoblasts: incomplete arrows. Scale bar: 50 μm. Mean fluorescence intensity (MFI) quantification of cis P-tau, trans P-tau and ProteoStat positive protein aggregates in e-PE (d) and l-PE (e) placental sections (e-PE, n = 17; control, n = 16; l-PE, n = 19; control, n = 21, total 33–40 placental sections were analyzed per condition, two way ANOVA followed by Bonferroni’s post hoc test; mean±s.e.m. f Pearson’s colocalization coefficient (PCC) for cis P-tau and ProteoStat (left) is higher than for trans P-tau and ProteoStat (right); n = 35. Statistics are represented in the figure derived from two-tailed unpaired t test with Mann Whitney test.; mean±s.e.m. g Age-matched (control) and e-PE placental lysates were treated with (+λ) or without (-λ) lambda phosphatase (Ppase), followed by immunoblot with antibodies identifying early (cis P-tau and trans P-tau) or late (pS396) tau phosphorylation. Loading control was GAPDH. h Hypoxia-reoxygenation (H/R) stress induces robust cis P-tau aggregation. Human primary trophoblast cells were exposed to hypoxia (1% O2) for 72 h followed by 2-3 h incubation in reoxygenation (21% O2) conditions or normoxia environment (21% O2). The merged picture with nuclear DAPI demonstrated co-localization. Inserts were enlargements of boxed portions. Images are representatives of n = 7 independent experiments, scale bar: 50 μm. i Disruption of β-tubulin positive microtubule network due to hypoxia in human primary trophoblast cells. ProteoStat positive protein aggregate puncta accumulated near damaged microtubule structure. Images are representatives of n = 5 independent experiments. Bar: 100 μm.
Fig. 2
Fig. 2. Robust Pin1 inhibitory post-translational modifications in PE placenta and primary trophoblast cells exposed to hypoxia or PES.
a Placental protein extracts from age matched control, e-PE and l-PE (n = 3) were subjected to immunoblot to detect total Pin1 and inactive forms of Pin1 (Oxy-Cys113 Pin1 and pS71-Pin1). b Mean normalized expression of Oxy-Cys113 Pin1 and pS71-Pin1. Three separate placental segments were selected for analysis from each person (e-PE, n = 17; control, n = 16, two-way ANOVA followed by Sidak’s post hoc test; mean ± s.e.m). c Representative confocal images of human placental tissue sections from e-PE and age match control to probe total nuclear Pin1. The merged pictures with nuclear DAPI (and enlarged inset) demonstrated nuclear localization of total Pin1. Scale bar: 50 μm. d Human placental tissue sections from e-PE and gestational age match control were probed for double immunofluorescence with oxidized Pin1 (Oxy-Cys113 Pin1, red) and phospho-Pin1 (pS71-Pin1, green) and then subjected to confocal imaging. pS71-Pin1 and Oxy-Cys113Pin1 significantly concentrated at the Cyto and syncytotrophoblast layers of the human placenta. Pin1 inactivation by oxidation (Oxy-Cys113 Pin1) is more prominent than phosphorylation (pS71-Pin1). Inactive Pin1 forms are localized outside DAPI positive nucleus. Scale bar: 50 μm. e Mean fluorescence intensity (M.F.I) quantification of Pin1, Oxy-Cys113 Pin1 and pS71-Pin1 in placental sections from e-PE and age matched control (e-PE, n = 17; control, n = 16, total 27–35 placental sections were analyzed per condition, two way ANOVA followed by Bonferroni’s post hoc test; mean ± s.e.m. f, g Hypoxia induced Pin1 Cys113 oxidation inhibits its catalytic activity and impairs Pin1 subcellular localization. Human primary trophoblast cells were exposed to normoxia (21% O2) or hypoxic stress (1% O2) for 24 h followed by double immunofluorescence with (f) anti-Pin1 (green) and anti-Oxy-Cys113-Pin1 (red) or (g) anti-Pin1 (green) and anti-pS71-Pin1 antibodies. The merged picture with nuclear DAPI (and enlarged inset) showing colocalization. Hypoxia reduces Pin1 nuclear localization and increases cytoplasmic localization. Images are representatives of n = 7 independent experiments. Scale bar: 50 μm. h Robust induction of Pin1 inactive forms (Oxy-Cys113 Pin1 and pS71-Pin1) at 24 h following incubation of primary trophoblast cells with PES (n = 5), but not NPS (n = 5). Confocal Images are representatives of n = 5 independent experiments. Scale bar: 50 μm.
Fig. 3
Fig. 3. Hypoxia- and PES-induced cis P-tau promotes tau aggregation in trophoblasts and disrupts the crosstalk between extravillous trophoblasts and endothelial cells.
ac Human primary trophoblast cells were subjected to acute hypoxia for 72 h before being incubated for 24 h with cis, trans, or IgG isotype, followed by immunostaining with cis P-tau and ProteoStat (a), quantification of mean fluorescence intensity (b) and a violin plot to depict the abundance, distribution and area of ProteoStat positive protein aggregate puncta (c). Arrowhead points to either aggregation or disaggregation between cis P-tau and ProteoStat. n = 5, scale bar, 100 μm; two way ANOVA followed by Bonferroni’s post hoc test; mean±s.e.m. b 120 individual cells from each group were analyzed from n = 5 and statistics are represented derived from one way ANOVA followed by Tukey’s post hoc test; mean ± s.e.m. c, d Dynamic cis P-tau induction in trophoblast cells after acute hypoxia exposure. After 72 h of H/R exposure, cells were treated for another 24 h to the corresponding neutralizing antibody, followed by immunoblotting for cis P-tau (bottom panel). Condition media (CM) from the indicated time points as well as after indicated treatment with neutralizing antibodies were collected and concentrated, followed by immunoblot for cis P-tau and GAPDH. n = 5. e The effect of intracellular cis-P-tau accumulation and extracellular spread. Human trophoblast cells were seeded on the upper layer of the Matrigel coated membrane in the 3D Matrigel chamber and incubated with concentrated CM from experiments a and d for 24 and 48 h. The representative images were obtained after 24 h (n = 5) and show 20 x fields of Matrigel-coated 8 mm pore PET membranes after eliminating all noninvasive cells and staining the membrane with Crystal violet. f The percentage of cells migrating/invading through the Matrigel matrix to reach the underlying membrane is shown. Total 25–49 separate fields were analyzed from n = 5, one way ANOVA followed by Tukey’s post hoc test; mean±s.e.m. g CM from experiment a and d were analyzed by ELISA for the presence of soluble fms-like tyrosine kinase-1 (sFlt-1) and soluble endoglin (sEng). n = 3, two way ANOVA followed by Bonferroni’s post hoc test; mean±s.e.m. h, i CellTrackerTM red tagged HUVEC and CellTrackerTM green tagged HTR-8/SVneo were co-cultured overnight on Matrigel for in vitro 3D vascular tube development in the presence of NPS (10%) or e-PES (10% e-PES) supplemented with cis, trans or IgG isotype (10 μg/ml) (h). Tube-like structures created by coupled capillary bridges were counted in four fields to determine the average number of tubes/vacuoles formed (i). n = 7 different PES and NPS patients, two-way ANOVA followed by Bonferroni’s post hoc test; mean ± s.e.m. j Confocal images of single placental villi exhibiting juxtaposition of cis P-tau positive trophoblast layer and CD31 positive endothelial cells in human PE placenta (e-PE, n = 11; control, n = 8).
Fig. 4
Fig. 4. Robust detection of cis P-tau in human PES.
Autophagy-deficient trophoblast cells (ADTs) were incubated for 24 h with 10% of PES (e-PES; n = 34) (a) or NPS (n = 28) (b), followed by immune-colocalization with cis P-tau (green) and ProteoStat (red) or trans P-tau (green) and ProteoStat (red). Representative merged and inset confocal images are depicted showing colocalization. Scale bar: 100 μm. c Mean fluorescence intensity (MFI) quantification of cis P-tau, trans P-tau and proteo-Stat positive protein aggregates from the experiment in a and b were shown. PES, n = 34; control, NPS, n = 28, 2-3 coverslips were analyzed per donor, two-way ANOVA followed by Bonferroni’s post hoc test; mean ± s.e.m. d ROC curve analysis of cis P-tau abundance for prediction of PE (n = 38) and NP (n = 38). Area under the ROC curve (AUC) = 0.9162, std error = 0.03043, 95% confidence interval (CI) 0.8566 to 0.9759. P value = <0.0001. e ROC curve analysis of ProteoStat abundance for prediction of PE (n = 38) and NP (n = 38). Area under the ROC curve (AUC) = 0.9346, std error = 0.02786, 95% confidence interval (CI) 0.8800 to 0.9892. P value = <0.0001. f PES disrupts the β-tubulin positive microtubule network in ADT cells. Clusters of ProteoStat positive protein aggregates were found near disrupted microtubule networks (arrowhead). n = 5. Bar: 100 μm. g There was no substantial accumulation of cis P-tau and protein aggregates when autophagy-proficient human primary trophoblasts were treated with NPS or PES. Bar: 50μm. n = 5. h Cis mAb blocks and disaggregates PES-induced cis P-tau induction and aggregation. ADT cells were treated with 10% PES or NPS for 24 h before being incubated with cis mAb or IgG isotype for a further 24 and 48 h, followed by staining with cis P-tau and ProteoStat. i A violin plot illustrating the frequency, distribution, and area of ProteoStat positive protein aggregate puncta after neutralization with IgG and cis mAbs. Solid and dashed black lines represent the median, upper and lower dashed black line represents 3rd quartiles (75%) and 1st quartiles (25%) and the quartiles of the distributions, respectively. Statistics are represented in the figure derived from one way ANOVA followed by Tukey’s post hoc test; mean ± s.e.m. Puncta area was analyzed by ImageJ from NPS (n = 17), e-PES+ IgG isotype (n = 15), e-PES+ cis mAb 24 h (n = 20), e-PES+ cis mAb 48 h (n = 19) cells in each condition.
Fig. 5
Fig. 5. Cis P-tau immunodepletion from PES effectively prevents the development of PE-like pathological and clinical features in humanized tau mouse model of PE.
Pregnant htau mice were injected (I.P) on gestational day 10 (gd10) with 100 µl saline (control; n = 5), NPS (n = 5), PES (n = 10), IgG isotype immunodepleted PES (PES + IgG ID; n = 7), or cis mAb immunodepleted PES (PES+ cis ID; n = 10) before being subject to the following assays. a Confocal images of placental slices on gd 17.5 reveal ProteoStat positive protein aggregation formation after PES induced PE, which was reversed by cis P-tau depletion. Scale bars, 1 mm. Db = Maternal decidua basalis, Jz = Junctional zone, Lz = Labyrinth zone, b Representative gross images of fetuses on gd 17.5 exhibit PES-induced intrauterine growth restriction, which were reversed by cis P-tau depletion. c Representative confocal images of placentas from NPS, + IgG ID and PES + cis ID-treated htau mice reveal PES-induced strongest placental expression of cis P-tau in the junctional zone and decidia basalis, which was reversed by cis P-tau depletion. n = 5–7 placental sections. d Microscopic morphologies of the placenta on gd 17.5 reveal PES-induced placental histology, which was revered by cis P-tau depletion. Three layers of decidua basalis (Db), junctional zone (Jz) and labyrinth (Lb) are indicated. H&E staining, 20× magnification. e The systolic blood pressure measurements of mice on gd17.5 reveal PES-induced systolic hypertension, which was reversed by cis P-tau depletion. f Weight measurements of individual embryos on GD17.5 reveal PES-induced intrauterine growth restriction, which was reversed by cis P-tau depletion. g Spot urine albumin/creatinine ratio evaluations on gd17.5 reveal PES-induced proteinuria, which was reversed by cis P-tau depletion. Representative pulse-wave Doppler ultrasound images (h) and analyses of systolic velocities (i, j) of umbilical artery and uterine artery on GD16.5 reveal PES-induced decreases in umbilical and uterine artery systolic velocities, which were reversed by cis P-tau depletion. k Representative images of H&E-stained histopathological analysis of sagittal kidney sections reveal PES-induced glomerular endotheliosis, which was reversed by cis P-tau depletion. black arrow, normal glomeruli; yellow arrow, glomerular endotheliosis. Measurements of serum sFLT-1 (l) and sEng (m) concentrations on gd17 reveal PES-induced elevation of sFLT-1 and sEng, which was reversed by cis P-tau depletion. Data are presented as mean ± s.e.m. and analyzed by two-way ANOVA followed by Bonferroni post-tests, n = 10.

Similar articles

Cited by

References

    1. Chappell LC, Cluver CA, Kingdom J, Tong S. Pre-eclampsia. Lancet. 2021;398:341–354. - PubMed
    1. Phipps EA, Thadhani R, Benzing T, Karumanchi SA. Pre-eclampsia: pathogenesis, novel diagnostics and therapies. Nat. Rev. Nephrol. 2019;15:275–289. - PMC - PubMed
    1. Burton GJ, Redman CW, Roberts JM, Moffett A. Pre-eclampsia: pathophysiology and clinical implications. BMJ. 2019;366:l2381. - PubMed
    1. Sibai B, Dekker G, Kupferminc M. Pre-eclampsia. Lancet. 2005;365:785–799. - PubMed
    1. Bornstein E, Eliner Y, Chervenak FA, Grunebaum A. Concerning trends in maternal risk factors in the United States: 1989-2018. EClinicalMedicine. 2020;29–30:100657. - PMC - PubMed

Publication types