. 2023 Sep 5;14(1):5409.
doi: 10.1038/s41467-023-41006-1.

Programmable RNA detection with CRISPR-Cas12a

Affiliations

Programmable RNA detection with CRISPR-Cas12a

Santosh R Rananaware et al. Nat Commun. .

Abstract

Cas12a, a CRISPR-associated protein complex, has an inherent ability to cleave DNA substrates and is utilized in diagnostic tools to identify DNA molecules. We demonstrate that multiple orthologs of Cas12a activate trans-cleavage in the presence of split activators. Specifically, the PAM-distal region of the crRNA recognizes RNA targets provided that the PAM-proximal seed region has a DNA target. Our method, Split Activator for Highly Accessible RNA Analysis (SAHARA), detects picomolar concentrations of RNA without sample amplification, reverse-transcription, or strand-displacement by simply supplying a short DNA sequence complementary to the seed region. Beyond RNA detection, SAHARA outperforms wild-type CRISPR-Cas12a in specificity towards point-mutations and can detect multiple RNA and DNA targets in pooled crRNA/Cas12a arrays via distinct PAM-proximal seed DNAs. In conclusion, SAHARA is a simple, yet powerful nucleic acid detection platform based on Cas12a that can be applied in a multiplexed fashion and potentially be expanded to other CRISPR-Cas enzymes.


Conflict of interest statement

The authors declare the following competing interests: P.K.J., S.R.R., E.K.V., and S.S.A. are listed as inventors on a patent application related to the content of this work. Applicant: University of Florida. US Patent App. 63/726,074. Systems and methods for reverse transcription free RNA detection with CRISPR-Cas12a. Status: Patent pending. P.K.J. is a co-founder of Genable Biosciences, Par Biosciences, and CRISPR, LLC. The remaining authors declare no competing interests.

Figures

Fig. 1
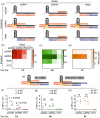
Fig. 1. Cas12a orthologs tolerate short ssDNA activators (6-12 nt) when added in combination.
a Schematic representation of a crRNA-Cas12a complex performing trans-cleavage of ssDNA reporters following the recognition of two split-activators. bd Fold change of fluorescence intensity normalized to No Target Control (NTC) at t = 60 minutes of in vitro trans-cleavage assay with Cas12a orthologs (red = LbCas12a, green = AsCas12a, orange = ErCas12a) activated by individual truncated ssDNA activators of length 6–20 nt. Statistical comparisons are made for a combination of both Pp and Pd data sets between the different lengths of the targets. Statistical analysis for n = 3 biologically independent replicates was performed using a two-tailed t-test where ns = not significant with p  >  0.05, and the asterisks (*p ≤ 0.05, **p ≤ 0.01, ***p ≤ 0.001, and ****p ≤ 0.0001) denote significant differences. Error bars represent Mean value +/− Standard Error of Mean (SEM) (n = 3). eg Heat maps representing fold change with respect to NTC at t = 60 min of an in vitro trans-cleavage assay activated by combinations of truncated ssDNA activators of different lengths ranging from 6 to 14 nt in the Pp and Pd regions. The reactions contained 25 nM truncated ssDNA GFP-activators, 60 nM Cas12a, and 120 nM crGFP and were incubated for 60 min at 37 °C. The NTC represents the condition when neither the Pp nor the Pd activator is present in the reaction. Source data are provided as a Source Data file.
Fig. 2
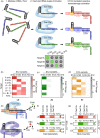
Fig. 2. Split-activator detection of ssDNA, dsDNA, and RNA substrates by Cas12a.
a Schematic representation of Cas12a activated by combinations of ssDNA/dsDNA (orange), and RNA (blue) in the PAM proximal and PAM distal regions. bd Heat maps representing the fold changes in the fluorescence intensity of in vitro trans-cleavage assay (n = 3) with Cas12a orthologs for the combinatorial schemes seen in (a). eh Comparison of the WT crRNA and ENHANCE crRNA for in vitro trans-cleavage assay of split activators. The line represents the mean of the scatter plot in each group. Statistical analysis for n = 3 biologically independent replicates comparing WT vs. En data in each group was performed using a two-tailed t-test where ns = not significant with p  >  0.05, and the asterisks (*p ≤ 0.05, **p ≤ 0.01, ***p ≤ 0.001, and ****p ≤ 0.0001) denote significant differences. Note that ssDNA and ssRNA substrates were used as targets in the Pd region while dsDNA was supplied in the Pp. Reactions were incubated for 60 min at 37 °C. The reactions contained 25 nM of each truncated activator, 60 nM Cas12a, and 120 nM crRNA. Source data are provided as a Source Data file.
Fig. 3
Fig. 3. Development of SAHARA for the detection of a wide range of RNA targets.
a Schematic representation of Cas12a complexed with WT vs. SAHARA crRNA and activated by either a short (20-nt) or a long (730-nt) RNA activator. bd. Comparison of trans-cleavage activity among Cas12a orthologs for the short vs. long combinatorial schemes seen in (a). The plot represents raw fluorescence units (RFU) plotted for time t = 60 min. For this experiment, two biological replicates each with three technical replicates were performed. The data points for the two biological replicates are represented by black and gray, respectively. eg Detection of the long RNA target with SAHARA by using either a non-targeting scrambled S12 (SR-Scr) or a targeting S12 (SR-S12). The plot represents RFU at t = 60 min. Error bars for all charts represent mean value +/− SEM. Statistical analysis for n = 6 samples comparing short vs. long targets and n = 3 replicates comparing Pos vs. NTC was performed using a two-tailed t-test where ns = not significant with p  >  0.05, and the asterisks (*P ≤ 0.05, **P ≤ 0.01, ***P ≤ 0.001, ****P ≤ 0.0001) denote significant differences. Source data are provided as a Source Data file.
Fig. 4
Fig. 4. Application of SAHARA for the detection of HCV and miR-155.
a Schematic of an HCV polypeptide precursor RNA target and three crRNAs targeting it at different positions. Colors within the target and crRNA indicate the following: crRNA Pp region (green), head (orange), tail (purple), and middle (blue) sections of an HCV polypeptide precursor RNA. b Comparison among the head, tail, mid, and pooled HCV targeting crRNA. The plot represents the fold change in fluorescence intensity normalized to the NTC at t = 60 min (n = 3). c Limit of detection of HCV target using a pool of head, tail, and mid crRNA sequences. Plot represents the background subtracted fluorescence intensity at t = 60 min, for different concentrations of the target. d Head vs. Tail detection for a mature miRNA-155 target meditated by a split activator system. crRNAs were designed to target an S12 dsDNA GFP-activator in the Pp region and target either the head or tail region of an miR-155 target in the Pd region. e Comparison of normalized fluorescence intensity fold change values among cr155-Tail, cr155-Head, and a combination of both Head and Tail targeting crRNAs. f miR-155 limit of detection using a pooled crRNA with a split activator system. The plot represents the background subtracted fluorescence intensity at t = 60 min, for different concentrations of the target. All error bars represent the mean value +/− SD (n = 3). Statistical analysis for n = 3 biologically independent replicates comparing the fluorescence intensity at different target concentrations vs. the NTC was performed using a two-tailed t-test where ns = not significant with p > 0.05, and the asterisks (*p ≤ 0.05, **p ≤ 0.01, ***p ≤ 0.001, and ****p ≤ 0.0001) denote significant differences. ErCas12a was used for all experiments in this section. Source data are provided as a Source Data file.
Fig. 5
Fig. 5. Specificity of SAHARA towards single point mutations in target.
a Schematic of WT vs. SAHARA CRISPR-Cas systems for the detection of a target nucleic acid. b ssDNA activators were designed with point mutations across the length of the activator. GFP-activator mutants were designed for a WT CRISPR activator (24-nt) and a SAHARA split activator system (12-nt + 12-nt). The mutation location is identified by ‘M’ following the nucleotide number where the base has been changed to guanine (3’ to 5’ direction). ce Comparison of fold changes for the in vitro trans-cleavage assay between WT and SAHARA activator mutants normalized to the WT activator for Cas12a orthologs (c: LbCas12a, d: AsCas12a, and e: ErCas12a). Comparison of RFU values at t = 60 min for the in vitro trans-cleavage assay between WT and SAHARA. Statistical analysis for n = 3 biologically independent replicates comparing the normalized fold change for the WT assay vs. SAHARA was performed using a two-tailed t-test where ns = not significant with p > 0.05, and the asterisks (*p ≤ 0.05, **p ≤ 0.01, ***p ≤ 0.001, and ****p ≤ 0.0001) denote significant differences. Error bars represent mean value +/− SD (n = 3). Source data are provided as a Source Data file.
Fig. 6
Fig. 6. Characterizing properties of the S12 DNA binding at the Pp region in SAHARA.
ad PAM sequence tolerance of Cas12a orthologs (red = LbCas12a, green = AsCas12a, orange = ErCas12a) coupled with SAHARA. Comparison of trans-cleavage activity among S12 dsDNA activators containing different PAM sequences (n = 3). The PAM sequences TTTA, AAAT, and VVVN were assessed. The plot represents the fluorescence intensity in each group at time t = 60 min (n = 3). eg Cas12a orthologs tolerate a wide range of GC contents in the crRNA and S12 dsDNA for RNA detection. The plots represent a graph of background subtracted fluorescence vs. time for the different groups (n = 3). hj. The trans-cleavage activity of Cas12a with varying concentrations of S12 after incubation for 60 min at 37 °C. The heat map represents the fluorescence intensity at time t = 60 min. Error bars for all charts represent mean value +/− SD (n = 3). Source data are provided as a Source Data file.
Fig. 7
Fig. 7. Simultaneous detection of multiple targets with SAHARA.
a Schematic of multiplexed detection with SAHARA. A mixture of different crRNAs can be differentiated for trans-cleavage activity using sequence-specific S12 activators. bd The heat maps depicting the trans-cleavage activity of 3 different pooled crRNAs (crRNA-a, crRNA-b, and crRNA-c) in the presence of 3 different S12 activators (S12a, S12b, S12c) or a no S12 control for Lb, As, and Er cas12a orthologs. Fold change compared to the No Target Control (NTC) at t = 60 min from the start of the reaction is plotted. 30 nM Cas12a, 60 nM crRNA, 25 nM S12 activators, and 25 nM of DNA or RNA targets were used in the assay (n = 3). e Schematic of multiplexed RNA detection with a combination of SAHARA and Cas13b. DNA or RNA reporters consisting of different colored dyes are used to distinguish the signal produced by Cas12a and Cas13b. f, g Multiplexed RNA detection using Lb, As, and Er orthologs of Cas12a in combination with PsmCas13b. Cas12a targets activator T1 and produces a signal in the FAM channel, while Cas13b targets activator T2 and produces a signal in the HEX channel. Heat map represents fluorescence intensity at time t = 60 min (n = 3). Source data are provided as a Source Data file.

Update of

References

    1. Barrangou R, et al. CRISPR provides acquired resistance against viruses in prokaryotes. Science. 2007;315:1709–1712. - PubMed
    1. Brouns Stan JJ, et al. Small CRISPR RNAs guide antiviral defense in prokaryotes. Science. 2008;321:960–964. - PMC - PubMed
    1. Fineran PC, Charpentier E. Memory of viral infections by CRISPR-Cas adaptive immune systems: Acquisition of new information. Spec. Issue Viruses Microbes. 2012;434:202–209. - PubMed
    1. Makarova KS, et al. Evolutionary classification of CRISPR–Cas systems: a burst of class 2 and derived variants. Nat. Rev. Microbiol. 2020;18:67–83. - PMC - PubMed
    1. Pinilla-Redondo R, et al. Type IV CRISPR–Cas systems are highly diverse and involved in competition between plasmids. Nucleic Acids Res. 2020;48:2000–2012. - PMC - PubMed

Publication types

LinkOut - more resources