Multicenter Study
. 2023 Sep 5;13(1):14604.
doi: 10.1038/s41598-023-41915-7.

Subsets of preoperative sex hormones in testicular germ cell cancer: a retrospective multicenter study

Affiliations
Multicenter Study

Subsets of preoperative sex hormones in testicular germ cell cancer: a retrospective multicenter study

Péter Törzsök et al. Sci Rep. .

Abstract

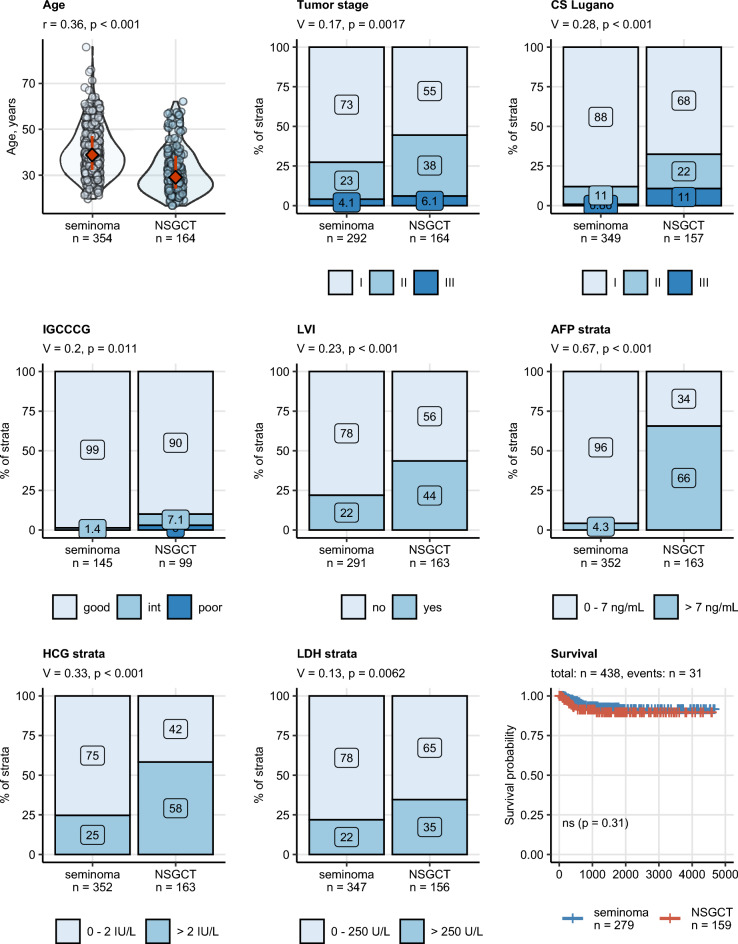
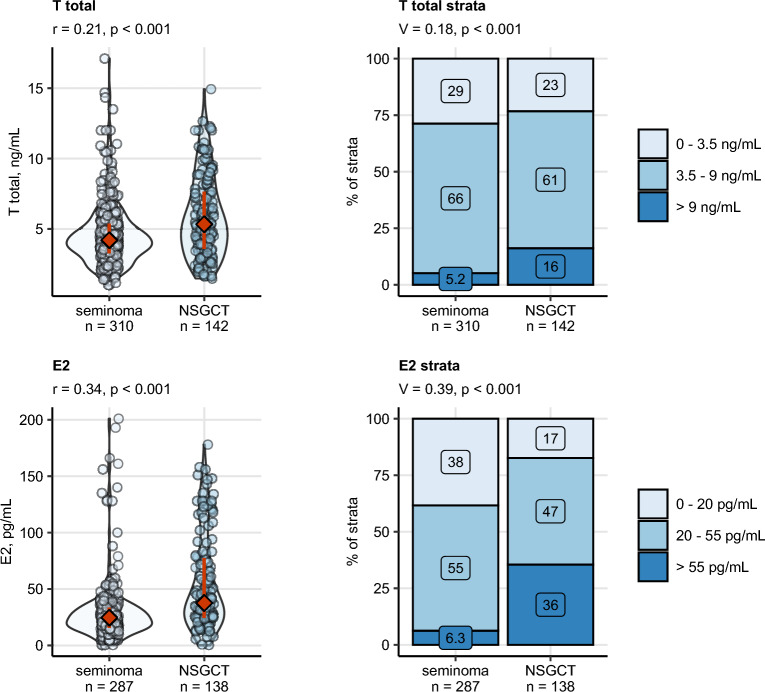
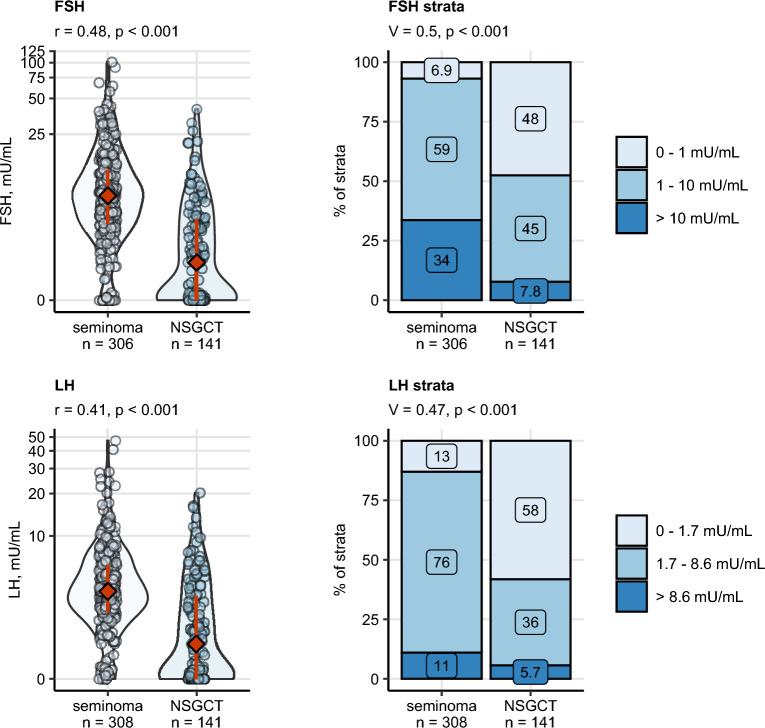
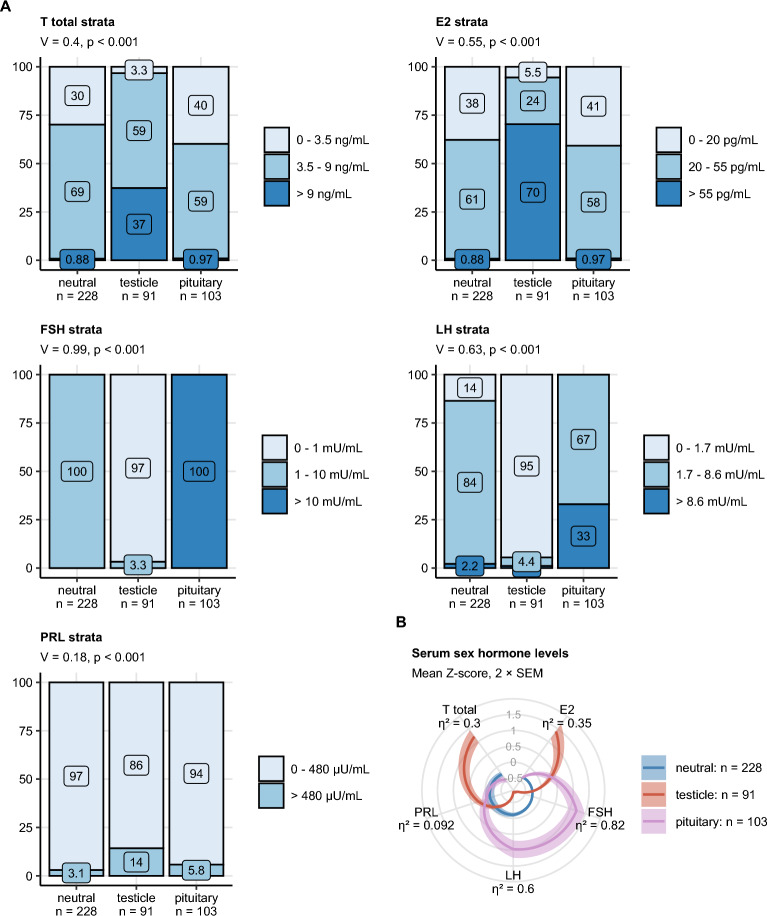
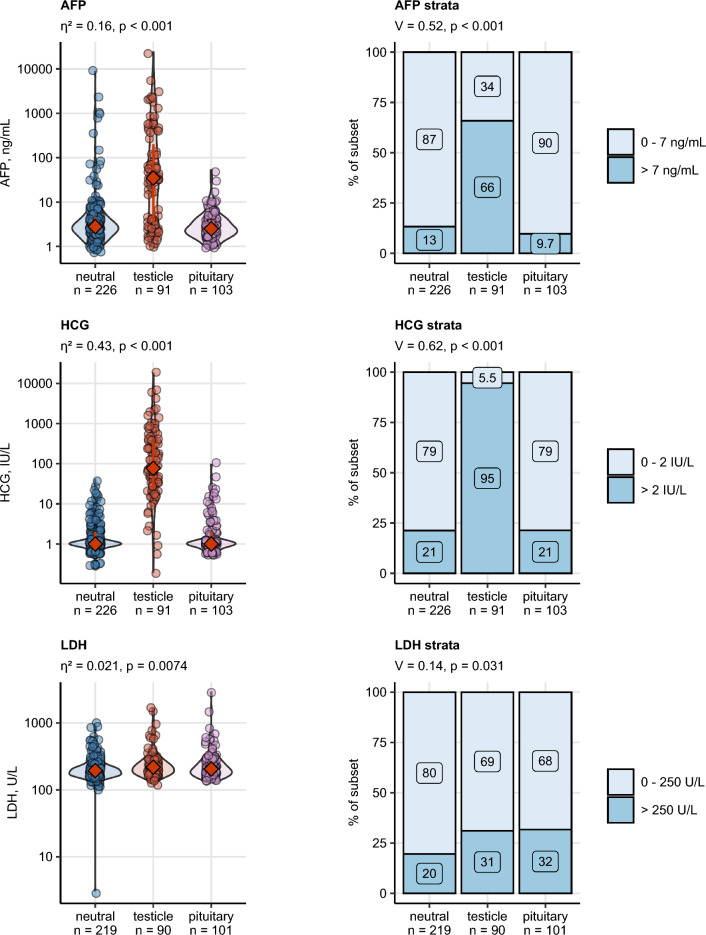
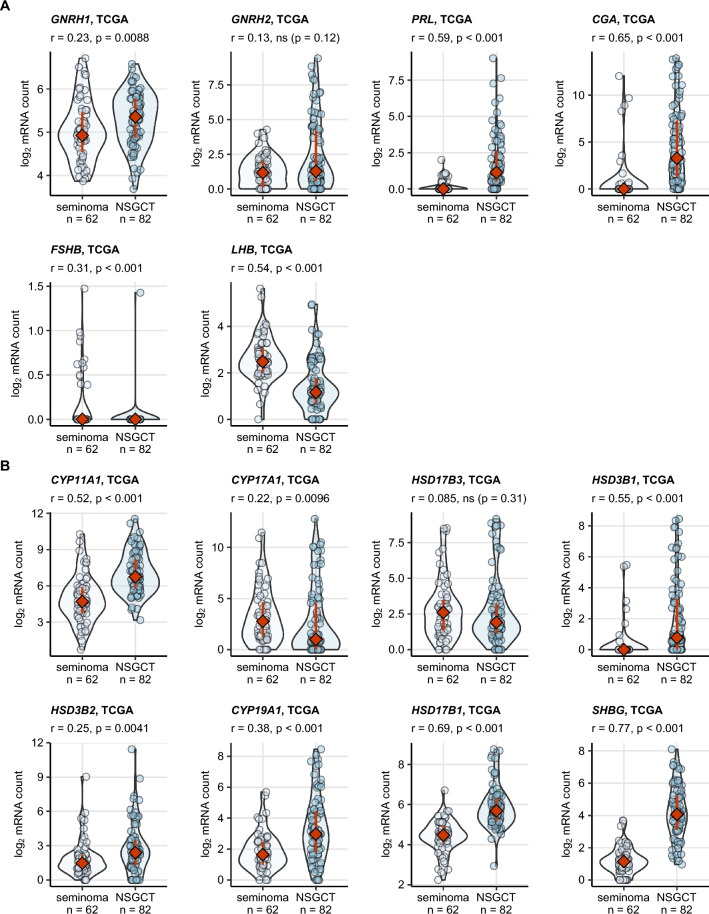
Preoperative homeostasis of sex hormones in testicular germ cell tumor (TGCT) patients is scarcely characterized. We aimed to explore regulation of sex hormones and their implications for histopathological parameters and prognosis in TGCT using a data-driven explorative approach. Pre-surgery serum concentrations of luteinizing hormone (LH), follicle-stimulating hormone (FSH), testosterone (T), estradiol (E2) and prolactin were measured in a retrospective multicenter TGCT cohort (n = 518). Clusters of patients were defined by latent class analysis. Clinical, pathologic and survival parameters were compared between the clusters by statistical hypothesis testing, Random Forest modeling and Peto-Peto test. Cancer tissue expression of sex hormone-related genes was explored in the publicly available TCGA cohort (n = 149). We included 354 patients with pure seminoma and 164 patients with non-seminomatous germ cell tumors (NSGCT), with a median age of 36 years. Three hormonal clusters were defined: 'neutral' (n = 228) with normal sex hormone homeostasis, 'testicle' (n = 91) with elevated T and E2, low pituitary hormones, and finally 'pituitary' subset (n = 103) with increased FSH and LH paralleled by low-to-normal levels of the gonadal hormones. Relapse-free survival in the hormonal subsets was comparable (p = 0.64). Cancer tissue expression of luteinizing hormone- and follicle-stimulating hormone-coding genes was significantly higher in seminomas, while genes of T and E2 biosynthesis enzymes were strongly upregulated in NSGCT. Substantial percentages of TGCT patients are at increased risk of sex hormone dysfunction at primary diagnosis before orchiectomy. TGCT may directly influence systemic hormonal homeostasis by in-situ synthesis of sex hormones.


Conflict of interest statement

The authors declare no competing interests.

Figures

Figure 1
Figure 1
Comparison of age, pathological and clinical stage, IGCCCG stage, lymphovascular invasion, AFP, HCG, LDH strata and relapse-free survival between seminoma and NSGCT. Differences in age at cancer surgery, in blood concentrations of alpha fetoprotein (AFP), human chorionic gonadotropin (HCG) and lactate dehydrogenase (LDH) between the histology types were assessed by Mann–Whitney test with r effect size statistic. Differences in distribution of tumor stages, Lugano classes (CS Lugano), IGCCCG (International Germ Cell Cancer Collaborative Group) risk classes, frequency of LVI, AFP, HCG and LDH strata between the histology types were investigated by χ2 test with Cramer V effect size statistic. P values were corrected for multiple testing with the false discovery rate (FDR). Numeric variables are presented in violin plots with single observations depicted as points, and medians with interquartile ranges represented by red diamonds and whiskers. Frequencies for levels of categorical variables are shown in stack plots. Effect sizes and p values are displayed in the plot captions. Numbers of complete observations are indicated in the X axes. Differences in relapse-free survival between seminoma and NSGCT histology cancers were assessed by log-rank test. Fractions of surviving individuals are presented in a Kaplan–Meier plot. Numbers of observations and relapses are displayed in the plot caption. The test p value is shown in the plot.
Figure 2
Figure 2
Differences in preoperative levels of total testosterone (T total) and estradiol (E2) between seminoma and non-seminomatous germ cell tumors (NSGCT). Differences in blood concentrations of testosterone (T) and estradiol (E2) between the histology types were assessed by Mann–Whitney test with r effect size statistic. Differences in frequency of clinical strata of hormone levels were investigated by χ2 test with Cramer V effect size statistic. P values were corrected for multiple testing with the false discovery rate (FDR) method. Numeric variables are presented in violin plots with single observations depicted as points, and medians with interquartile ranges represented by red diamonds and whiskers. Frequencies for levels of categorical variables are shown in stack plots. Effect sizes and p values are displayed in the plot captions. Numbers of complete observations are indicated in the X axes.
Figure 3
Figure 3
Differences in preoperative levels of follicle-stimulating hormone, luteinizing hormone between seminoma and non-seminomatous germ cell tumors (NSGCT). Differences in blood concentrations of follicle-stimulating hormone (FSH) and luteinizing hormone (LH) between the histology types were assessed by Mann–Whitney test with r effect size statistic. Differences in frequency of clinical strata of hormone levels were investigated by χ2 test with Cramer V effect size statistic. P values were corrected for multiple testing with the false discovery rate (FDR) method. Numeric variables are presented in violin plots with single observations depicted as points, and medians with interquartile ranges represented by red diamonds and whiskers. Frequencies for levels of categorical variables are shown in stack plots. Effect sizes and p values are displayed in the plot captions. Numbers of complete observations are indicated in the X axes.
Figure 4
Figure 4
Hormonal subsets of testis cancer patients defined by latent class analysis in respect to preoperative strata of sex hormones and pre-surgery blood concentrations of sex hormones in the hormonal subsets of TGCT. (A) Distribution of clinical strata of pre-surgery sex hormone levels in the hormone subsets of testicle cancer defined by latent class analysis (T: testosterone, E2: estradiol, FSH: follicle stimulating hormone, LH: luteinizing hormone, PRL: prolactin). Statistical significance was determined by χ2 test with Cramer V effect size statistic. (B) Normalized pre-surgery blood concentrations of sex hormones (Z-scores) were compared between the hormonal subsets of testicle cancer defined by latent class analysis by Kruskal–Wallis test with η2 effect size statistic. P values were corrected for multiple testing with the false discovery rate method. Strata frequencies within the hormonal subsets are presented in stack plots. Effect sizes and p values are displayed in the plot captions. Mean values with 2 × SEM are presented as solid lines with tinted ribbons in a radar plot. Numbers of observations in the subsets are indicated in the X axes.
Figure 5
Figure 5
Clinico-pathological comparison of the three hormonal subsets. Differences in age, body mass index (BMI), and maximal tumor size between the hormonal subsets were assessed by Kruskal-46Wallis test with η2 effect size statistic. Differences in distribution of body mass classes, of tumor stages and Lugano classes (CS Lugano), and frequencies of lymphovascular invasion (LVI) and histology types were investigated by χ2 test with Cramer V effect size statistic. P values were corrected for multiple comparisons with the false discovery rate. Numeric variables are presented in violin plots with single observations depicted as points, and medians with interquartile ranges represented by red diamonds and whiskers. Frequencies for levels of categorical variables are shown in stack plots. Effect sizes and p values are displayed in the plot captions. Numbers of observations in the subsets are indicated in the X axes. Differences in relapse-free survival in the hormonal subsets were assessed by log-rank test. Fractions of surviving patients are displayed in a Kaplan–Meier plot. The test p value is presented in the plot. Numbers of observations and relapses are shown in the plot caption.
Figure 6
Figure 6
Serum tumor markers in the hormonal subsets of TGCT. Differences in blood concentrations of alpha fetoprotein (AFP) and human chorionic gonadotropin (HCG), and activity of lactate dehydrogenase (LDH) were compared between the hormonal subsets by Kruskal–Wallis test with η2 effect size statistic. Differences in distribution of AFP and LDH strata were assessed by χ2 test with Cramer V effect size statistic. P values were corrected for multiple testing with the false discovery rate method. Numeric variables are presented in violin plots with single observations depicted as points, and medians with interquartile ranges represented by red diamonds and whiskers. Frequencies for levels of categorical variables are shown in stack plots. Effect sizes and p values are displayed in the plot captions. Numbers of observations in the subsets are indicated in the X axes.
Figure 7
Figure 7
Expression of sex hormone-related genes in seminoma and NSGCT samples from the TCGA cohort. Expression of sex hormone-related genes was presented as log2-transformed transcript counts. (A) key gonadotropin-releasing hormones (GNRH1GNRH2), pituitary gonadotropins (PRLCGALHB and FSHB) as well as (B) genes involved in gonadal testosterone (CYP11A1CYP17A1HSD17B3HSD3B1HSD3B2) and estradiol synthesis (CYP19A1HSD17B1), and steroid hormone transport (SHBG). Differences in gene expression between the histology types were assessed by Mann–Whitney test with r effect size statistic. P values were corrected for multiple testing with the false discovery rate method. Expression values are presented in violin plots with single samples depicted as points and red diamonds with whiskers representing medians with interquartile ranges. Effect sizes and p values are shown in the plot captions. Numbers of complete observations are indicated in the X axes.

References

    1. Albers P, Albrecht W, Algaba F, et al. Guidelines on testicular cancer: 2015 update. Eur. Urol. 2015;68(6):1054–1068. doi: 10.1016/j.eururo.2015.07.044. - DOI - PubMed
    1. Park JS, Kim J, Elghiaty A, Ham WS. Recent global trends in testicular cancer incidence and mortality. Medicine (Baltimore) 2018;97(37):e12390. doi: 10.1097/MD.0000000000012390. - DOI - PMC - PubMed
    1. Rajpert-De Meyts E, McGlynn KA, Okamoto K, Jewett MAS, Bokemeyer C. Testicular germ cell tumours. Lancet. 2016;387(10029):1762–1774. doi: 10.1016/S0140-6736(15)00991-5. - DOI - PubMed
    1. Dieckmann KP, Simonsen-Richter H, Kulejewski M, et al. Serum tumour markers in testicular germ cell tumours: Frequencies of elevated levels and extents of marker elevation are significantly associated with clinical parameters and with response to treatment. Biomed. Res. Int. 2019;2019:5030349. doi: 10.1155/2019/5030349. - DOI - PMC - PubMed
    1. Pedrazzoli P, Rosti G, Soresini E, Ciani S, Secondino S. Serum tumour markers in germ cell tumours: From diagnosis to cure. Crit. Rev. Oncol. Hematol. 2021;159:103224. doi: 10.1016/j.critrevonc.2021.103224. - DOI - PubMed

Publication types

Substances

Supplementary concepts