. 2023 Sep 5;14(1):5435.
doi: 10.1038/s41467-023-41305-7.

Placental growth factor exerts a dual function for cardiomyogenesis and vasculogenesis during heart development

Affiliations

Placental growth factor exerts a dual function for cardiomyogenesis and vasculogenesis during heart development

Nevin Witman et al. Nat Commun. .

Erratum in

Abstract

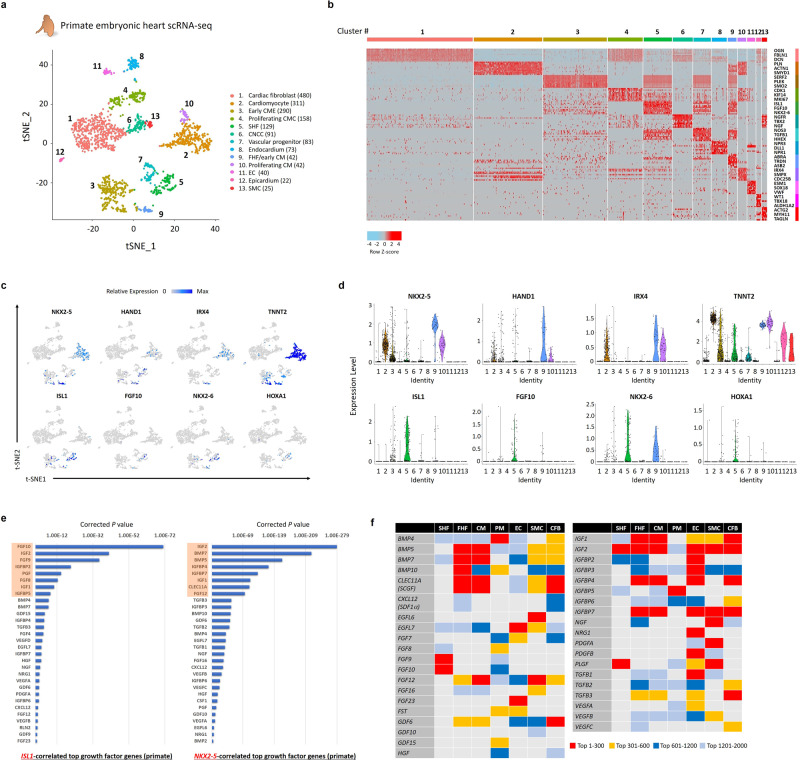
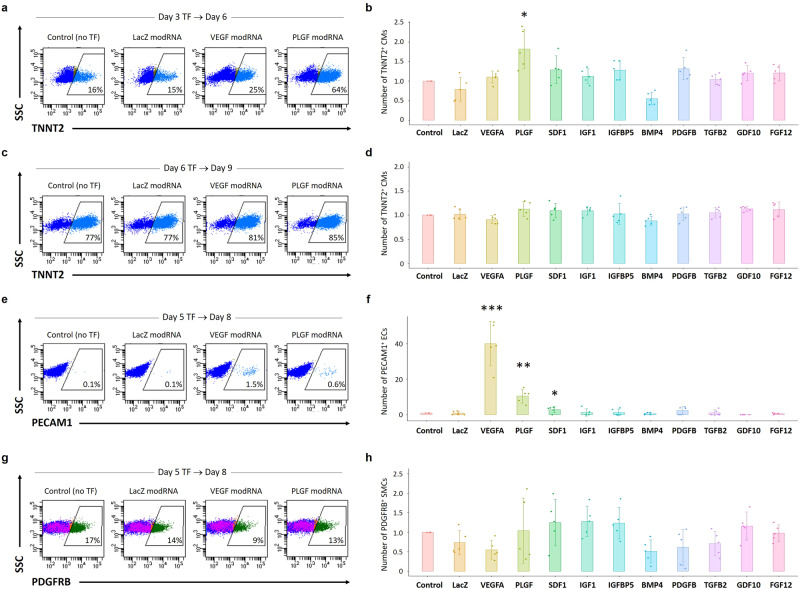
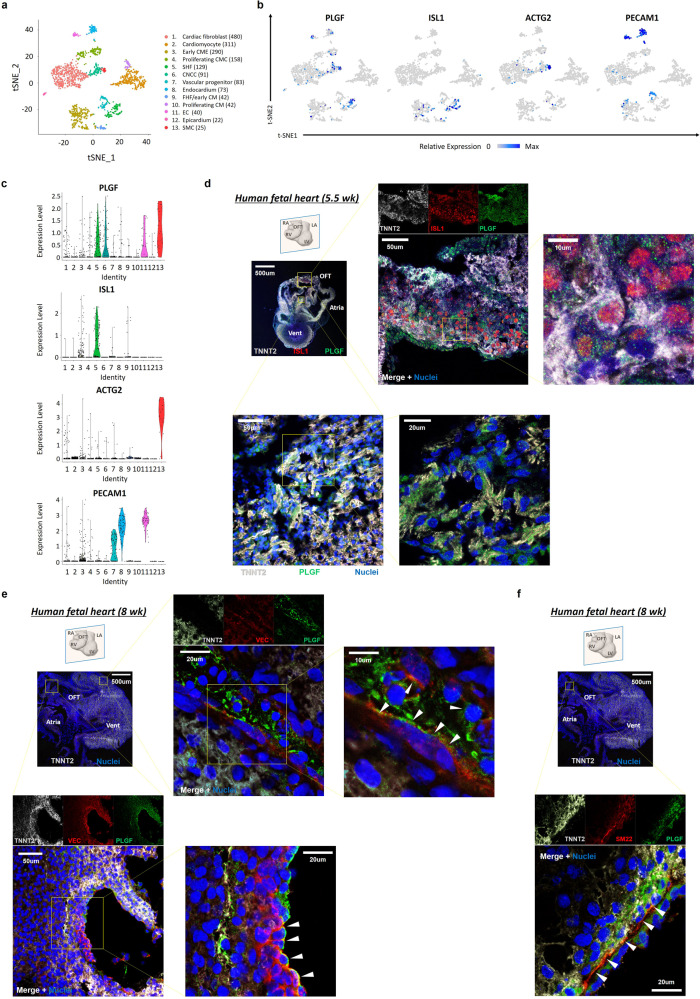
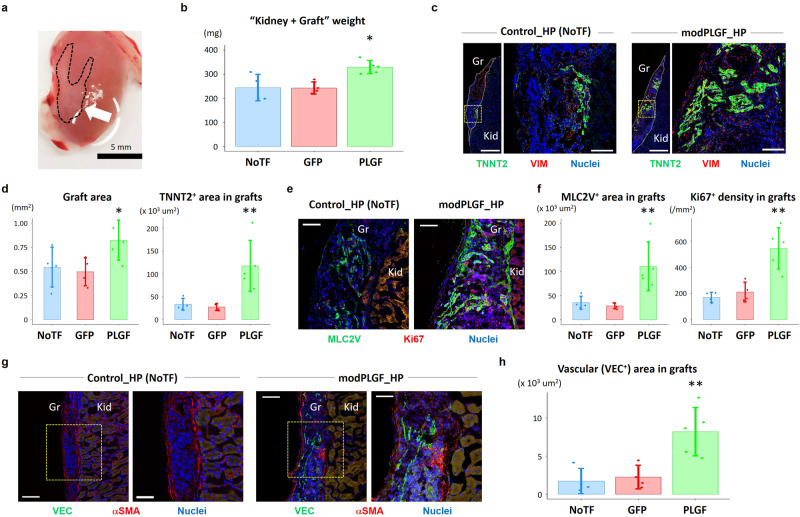
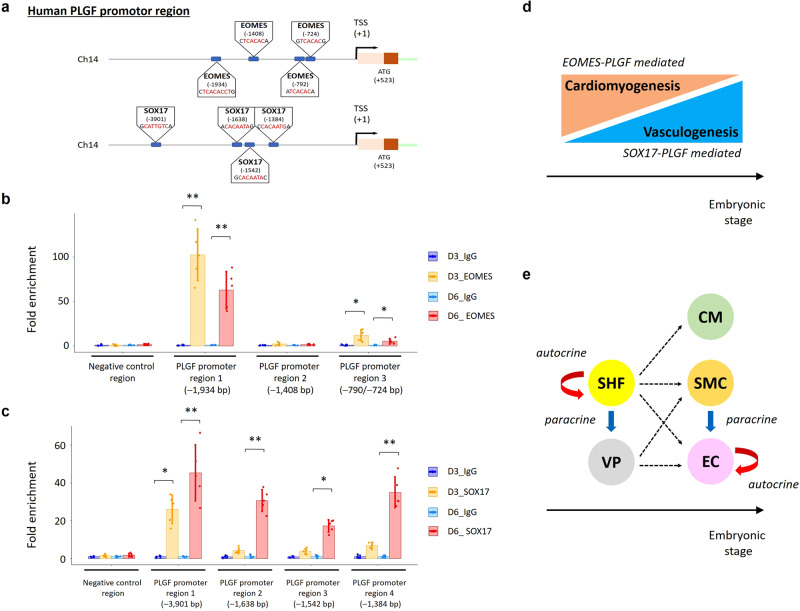
Cardiogenic growth factors play important roles in heart development. Placental growth factor (PLGF) has previously been reported to have angiogenic effects; however, its potential role in cardiogenesis has not yet been determined. We analyze single-cell RNA-sequencing data derived from human and primate embryonic hearts and find PLGF shows a biphasic expression pattern, as it is expressed specifically on ISL1+ second heart field progenitors at an earlier stage and on vascular smooth muscle cells (SMCs) and endothelial cells (ECs) at later stages. Using chemically modified mRNAs (modRNAs), we generate a panel of cardiogenic growth factors and test their effects on enhancing cardiomyocyte (CM) and EC induction during different stages of human embryonic stem cell (hESC) differentiations. We discover that only the application of PLGF modRNA at early time points of hESC-CM differentiation can increase both CM and EC production. Conversely, genetic deletion of PLGF reduces generation of CMs, SMCs and ECs in vitro. We also confirm in vivo beneficial effects of PLGF modRNA for development of human heart progenitor-derived cardiac muscle grafts on murine kidney capsules. Further, we identify the previously unrecognized PLGF-related transcriptional networks driven by EOMES and SOX17. These results shed light on the dual cardiomyogenic and vasculogenic effects of PLGF during heart development.


Conflict of interest statement

The authors declare the following competing interests that K.R.C. is a past co-founder of Moderna Therapeutics and is currently a member of the board of directors of eTheRNA. All other authors declare no competing interests.

Figures

Fig. 1
Fig. 1. Single-cell RNA-seq analysis of primate embryonic hearts.
a The tSNE analysis segregated a total of 1786 single cardiac cells, obtained from micro-dissected heart regions of primate embryos at 4 and 7 weeks of fetal age, into 13 clusters, including SHF/OFT progenitors (cluster #5). b Heatmap image depicting the representative differentially expressed genes in each of the 13 clusters in a. c Feature plots of the pan-cardiac and first heart filed (FHF)-related genes, as well as the SHF marker genes on the tSNE plots in a. d Violin plots of the same genes as in c in the segregated 13 clusters of the primate embryonic heart-derived single cells. e The rankings of the growth factor genes correlated with expression of the SHF-specific gene ISL1 (left) and the pan-cardiac/FHF-specific gene NKX2-5 (right) in single-cell RNA-seq data of primate embryonic hearts. The top 8 growth factors are highlighted in red shades, respectively. The corrected P-value for each gene was calculated by Guilt-by-Association and correlation analysis (with Pearson correlation coefficient test). Source data are provided as a Source Data file. f Atlas of growth factor expression from multiple heart cell types in developing hearts (i.e., SHF, FHF, CM, pacemaker cell [PM], EC, SMC, and cardiac fibroblasts [CFB]), which was analyzed and defined by the Seurat and Guilt-by-Association and correlation analyses using single-cell RNA-seq data of primate embryonic hearts. In the Seurat program, each cluster (e.g., SHF: cluster #5, FHF: cluster #9, etc. [Supplementary Fig. 2a, b])-specific growth factors were identified, while in the latter, the growth factors correlated with each of the cell type-specific markers (i.e., SHF: ISL1, FHF: NKX2-5, CM: TNNT2; PM: SHOX2; EC: PECAM1, SMC: ACTG2, and CFB: DCN) were identified. The red, yellow, blue, and sky-blue colors indicate that each growth factor is ranked within the top 300 (red), top 301–600 (yellow), top 601–1200 (blue), or top 1201–2000 (sky-blue) genes correlated with each of the clusters and/or the cell type-specific markers. Thus, a red color in the chart indicates the strongest association between each of the growth factors and each of the heart cell types.
Fig. 2
Fig. 2. Cardiomyogenic and vasculogenic effects of modRNAs encoding growth factors in in vitro hESC differentiation assays.
a, b The cardiomyogenic assays were analyzed on day 6. For the in vitro hESC-CM differentiation,, the cells were treated with each of the 24 selected growth factors’ modRNAs for 5 h on day 3 and analyzed for a CM marker TNNT2 by flow cytometry on day 6. The cell numbers of TNNT2+ CMs were then calculated. The panels in a show selected representative images on flow cytometry analysis, and the chart in b shows relative ratios of the cell numbers of TNNT2+ CMs, obtained with treatment with the representative 10 growth factors’ modRNAs, as well as control (no modRNA transfection [TF]) and LacZ modRNA-transfected cells. Of note, only PLGF modRNA significantly increased the number of TNNT2+ CMs on day 6 among all growth factors tested. c, d The cardiomyogenic assays were analyzed on day 9. The cells were treated with modRNAs encoding each of the 24 selected growth factors for 5 h on day 6 and analyzed for a CM marker TNNT2 by flow cytometry on day 9. e, f The vasculogenic assays for ECs analyzed on day 8. In the hESC-CM differentiation, the cells were treated with each of the 24 selected modRNAs encoding growth factors for 5 h on day 5 and analyzed for an EC marker PECAM1 by flow cytometry on day 8. VEGF-A modRNA significantly increased the number of PECAM1+ ECs, as expected. Albeit to a lesser degree than VEGF-A, PLGF modRNA also showed a significant increase in the number of ECs compared to the control. g, h The vasculogenic assays for SMCs analyzed on day 8. The same cells as in e and f were also analyzed for an SMC marker PDGFRB by flow cytometry. Data in b, d, f, and h are presented as mean ± SD (n = 5 independent experiments). Differences between groups were examined with one-way ANOVA followed by Tukey multiple comparisons test. *P < 0.05, **P < 0.01, and ***P < 0.0001 vs. control. Source data are provided as a Source Data file.
Fig. 3
Fig. 3. Distribution of PLGF expression on the human and primate embryonic hearts.
a The 13 cell populations were segregated by the Seurat/tSNE analysis using a total of 1786 single cardiac cells of primate embryonic hearts. b Feature plots of PLGF, a SHF marker ISL1, a SMC marker ACTG2, and an EC marker PECAM1 on the tSNE plots in a. c Violin plots of the same genes as in b, in the segregated 13 clusters of the primate embryonic heart-derived single cells. d Immunohistochemistry of the sectioned human embryonic heart at 5.5 weeks of fetal age. Coronal view. The confocal microscopic images highlight the PLGF+ cells (green) co-expressing an SHF marker ISL1 (red) and/or a CM marker TNNT2 (light gray) in the outflow tract (OFT) region. Vent, ventricle. e Immunohistochemistry of the sectioned human embryonic heart at 8 weeks of fetal age. Coronal view. The confocal microscopic images highlight the PLGF+ ECs (top; arrowheads) in the ventricular wall and the PLGF+ endocardial cells (bottom; arrowheads) in the atrium, both of which co-expressed an endothelial marker VE-cadherin (VEC; red). f Immunohistochemistry of the sectioned human embryonic heart at 8 weeks of fetal age. Coronal view. The confocal microscopic images highlight the PLGF+ SMCs, which co-expressed a SMC marker SM22 (arrowheads). Representative images in each of d, e, and f were obtained from the repeated experiments (n = 2 [d] or 3 [e and f] biologically independent samples) with similar results.
Fig. 4
Fig. 4. Impacts of PLGF deletion in in vitro hESC differentiation of CMs, SMCs, and ECs.
a, b Representative images on flow cytometry analysis showing the ratios of a cell-proliferation marker Ki67+ (left), a SHF/heart progenitor marker ISL1+ (middle), and a differentiated CM marker TNNT2+ (right) in WT (top) and PLGF-KO (bottom) cells at days 6 (a) and 15 (b) in hESC-CM differentiation,. c Statistical data of the ratios of %Ki67+ (left), %ISL1+ (middle), and %TNNT2+ (right) in a and b. d Flow cytometry analysis and statistical data showing the ratios of vascular SMCs (PDGFRB+) at day 6 in hESC-SMC differentiation of WT and PLGF-KO hESCs. e Flow cytometry analysis and statistical data showing the ratios of vascular ECs (VE-cadherin [VEC]+) at day 6 in hESC-EC differentiation of WT and PLGF-KO hESCs. Data in c, d, and e are presented as mean ± SD (n = 5 independent experiments). Differences between groups were examined with one-way ANOVA followed by Tukey multiple comparisons test. *P < 0.05, **P < 0.01, and ***P < 0.0001. Source data are provided as a Source Data file.
Fig. 5
Fig. 5. Population RNA-seq analyses compared between WT cells and PLGF overexpressing or PLGF-KO cells during hESC-CM differentiation.
a The principal component analysis using the population RNA-seq data of WT, modRNA (LacZ or PLGF)-transfected WT, and PLGF-KO cells harvested at days 4 and 6 in hESC-CM differentiation. ModRNA transfection was conducted 24 h before cell harvesting (i.e., at day 3 or 5). b Differential gene expression analysis of the 8 cell groups in a. Heatmap image depicting the representative differentially expressed genes (partly listed in the left column) in each of the 8 groups. c, e, g, i Volcano plots visualizing differentially expressed gene analysis with the limma package between WT and PLGF modRNA-transfected cells (c [day 4] and g [day 6]), as well as between WT and PLGF-KO cells (e [day 4] and i [day 6]) in hESC-CM differentiation, respectively. For each gene, the average difference (log2[Fold change]) between the cell groups on the same day was plotted against the power to discriminate between groups (-log10[p.value]), in which p.values were obtained from a two-tailed unpaired t-test. Top-scoring genes for both metrics are indicated as red dots, and representative differentially expressed genes’ names are labeled. d, h The gene set enrichment analysis (GSEA) was performed using the top 250 WT or PLGF modRNA-transfected cells-enriched genes with the GSEA software (Broad Institute; http://www.gsea-msigdb.org/gsea/). Bar graphs showing the representative gene ontology (GO) terms specific to WT (right) or PLGF modRNA-transfected cells (left) at days 4 (d) and 6 (h), respectively. f, j The GSEA was performed using the top 250 WT or PLGF-KO cells-enriched genes with the GSEA software. Bar graphs showing the representative GO terms specific to WT (left) or PLGF-KO cells (right) at days 4 (f) and 6 (j), respectively. Source data are provided as a Source Data file.
Fig. 6
Fig. 6. In vivo cardiomyogenic and vasculogenic effects of PLGF modRNA-enhanced HPs.
a In vivo human heart progenitor (HP)-derived cardiac muscle grafts on murine kidney capsules (arrow) were generated by transplantation of hESC-derived HPs. b Comparison of the weights of the non-transfected (NoTF) HP-, GFP modRNA (modGFP)-transfected HP-, and PLGF modRNA (modPLGF)-transfected HP-engrafted kidneys. c Immunohistochemistry of the sectioned human HP-derived cardiac muscle grafts on murine kidney capsules, generated by NoTF HPs (left) and modPLGF-transfected HPs (right). The grafts (Gr) were indicated by white dotted lines in the left images, respectively. The right image in each is the enlarged one of a yellow square in the left image, respectively. Scale bars, 500 μm (left in each) and 100 μm (right in each). Kid, kidney; VIM, vimentin. d Quantitative data of the entire graft areas (left) and TNNT2+ areas in grafts (right) in the three groups, i.e., NoTF-, modGFP-, and modPLGF-HPs. Quantitative analyses were conducted using ImageJ/FIJI software (NIH, USA). e Immunohistochemistry of the sectioned human HP-derived cardiac muscle grafts on murine kidney capsules generated by NoTF HPs (left) and modPLGF-transfected HPs (right), highlighting a CM maturation marker MLC2V and a proliferation marker Ki67. Scale bars, 100 μm. f Quantitative data of MLC2V+ areas in grafts (left) and Ki67+ density in grafts (right) in the three groups. g Immunohistochemistry of the sectioned human HP-derived cardiac muscle grafts on murine kidney capsules generated by NoTF HPs (left) and modPLGF-transfected HPs (right), highlighting an EC marker VE-cadherin (VEC) and a SMC marker α-smooth muscle actin (αSMA). The right image in each is the enlarged one of a yellow square in the left image, respectively. Scale bars, 100 μm (left in each) and 50 μm (right in each). h Quantitative data of VEC+ areas in grafts in the three groups. Data in b, d, f, and h are presented as mean ± SD (n = 4–5 biologically independent samples). Differences between groups were examined with one-way ANOVA followed by Tukey multiple comparisons test. *P < 0.05 and **P < 0.01 between modPLGF-transfected HP-engrafted kidneys vs. NoTF HP- or modGFP-transfected HP-engrafted kidneys. Source data are provided as a Source Data file.
Fig. 7
Fig. 7. Chromatin immunoprecipitation assays highlight the binding sites of EOMES and SOX17 on the PLGF promoter region.
a Schematic showing the putative binding sites of a cardiogenic transcription factor EOMES (5’-[AG]GTGTGA-3’; top) and a vasculogenic transcription factor SOX17 (5’-[C/T]ATTGT[C/G]−3’; bottom) on the human PLGF promoter region. b Chromatin immunoprecipitation (ChIP) assays demonstrated that recruitment of EOMES protein onto one of the putative EOMES-binding motif sites of the human PLGF promoter (−1934 bp upstream from the transcription start site [TSS]) was significantly augmented at days 3 (D3) and 6 (D6) in CM differentiation of WT hESCs. The degree of fold enrichment was larger at day 3 than at day 6. Albeit to a lesser degree, recruitment of EOMES was also detected onto another putative EOMES-binding motif site (−790/−724 bp upstream from the TSS) at D3 and D6. c The ChIP assays demonstrated that recruitment of SOX17 protein was significantly augmented onto one of the putative SOX17-binding motif sites of the human PLGF promoter (−3901 bp upstream from the TSS) at D3 and onto all of the four putative SOX17-binding motif sites (−3901, −1638, −1542, and −1384 bp upstream from the TSS) at D6. Data in b and c are presented as mean ± SD (n = 5 independent experiments). Differences between groups were examined with one-way ANOVA followed by Tukey multiple comparisons test. *P < 0.01 and **P < 0.0001 vs. IgG (negative control). Source data are provided as a Source Data file. d Schematic highlighting the EOMES-PLGF-mediated cardiomyogenesis in the early embryonic stage and the SOX17-PLGF-mediated vasculogenesis in the middle/late embryonic stage. e Schematic highlighting the stage-dependent PLGF’s roles in cardiogenesis. In the early stage, the second heart field (SHF) heart progenitors play a dual role, such as an autocrine role in the SHF and a paracrine role to function to the vascular progenitors (VP). In the late stage, smooth muscle cells (SMCs) play a paracrine role in functioning to endothelial cells (ECs), while ECs play an autocrine role. Black dashed arrows indicate putative differentiation paths. CM cardiomyocyte.

References

    1. Bergmann O, et al. Dynamics of cell generation and turnover in the human heart. Cell. 2015;161:1566–1575. doi: 10.1016/j.cell.2015.05.026. - DOI - PubMed
    1. Sahara M, Santoro F, Chien KR. Programming and reprogramming a human heart cell. EMBO J. 2015;34:710–738. doi: 10.15252/embj.201490563. - DOI - PMC - PubMed
    1. Madonna R, et al. Position Paper of the European Society of Cardiology Working Group Cellular Biology of the Heart: cell-based therapies for myocardial repair and regeneration in ischemic heart disease and heart failure. Eur. Heart J. 2016;37:1789–1798. doi: 10.1093/eurheartj/ehw113. - DOI - PMC - PubMed
    1. Karbassi E, et al. Cardiomyocyte maturation: advances in knowledge and implications for regenerative medicine. Nat. Rev. Cardiol. 2020;17:341–359. doi: 10.1038/s41569-019-0331-x. - DOI - PMC - PubMed
    1. de Soysa TY, et al. Single-cell analysis of cardiogenesis reveals basis for organ-level developmental defects. Nature. 2019;572:120–124. doi: 10.1038/s41586-019-1414-x. - DOI - PMC - PubMed

Publication types

Substances