. 2023 Sep 5;21(1):591.
doi: 10.1186/s12967-023-04475-y.

Proteomic analysis unveils Gb3-independent alterations and mitochondrial dysfunction in a gla-/- zebrafish model of Fabry disease

Affiliations

Proteomic analysis unveils Gb3-independent alterations and mitochondrial dysfunction in a gla-/- zebrafish model of Fabry disease

Hassan Osman Alhassan Elsaid et al. J Transl Med. .

Abstract

Background: Fabry disease (FD) is a rare lysosomal storage disorder caused by mutations in the GLA gene, resulting in reduced or lack of α-galactosidase A activity. This results in the accumulation of globotriaosylceramide (Gb3) and other glycosphingolipids in lysosomes causing cellular impairment and organ failures. While current therapies focus on reversing Gb3 accumulation, they do not address the altered cellular signaling in FD. Therefore, this study aims to explore Gb3-independent mechanisms of kidney damage in Fabry disease and identify potential biomarkers.

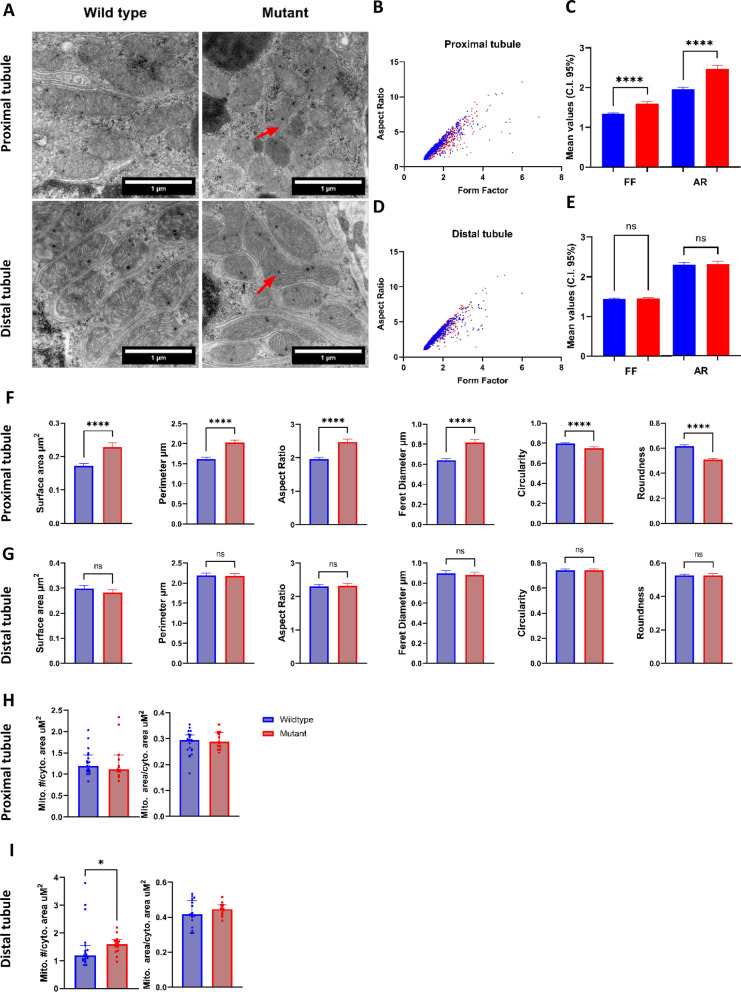
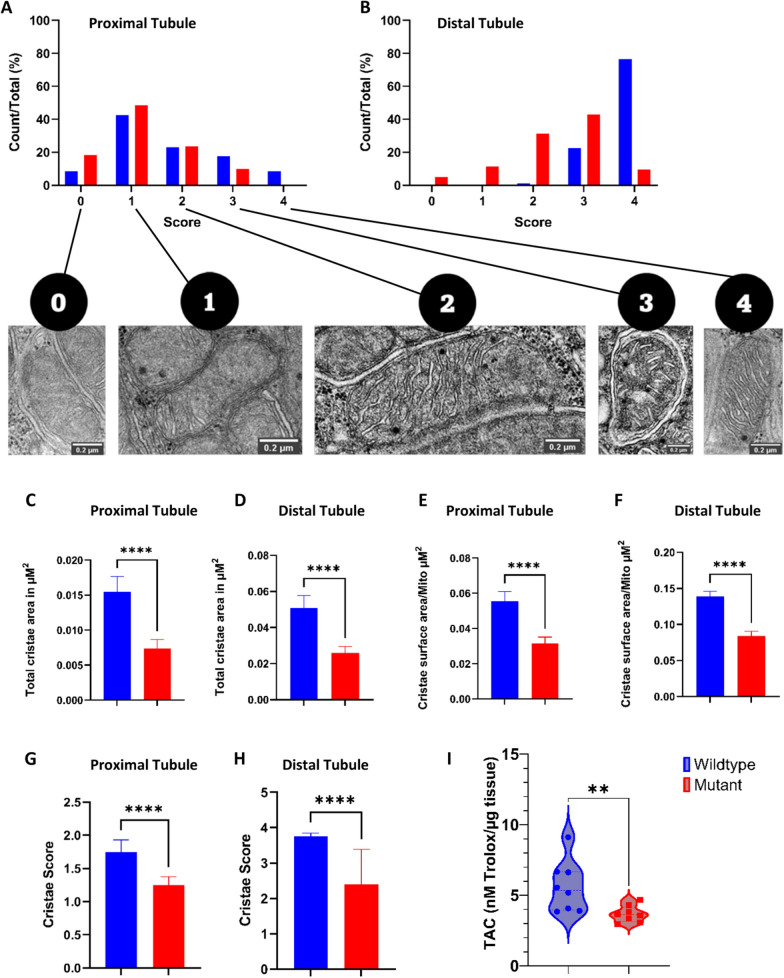
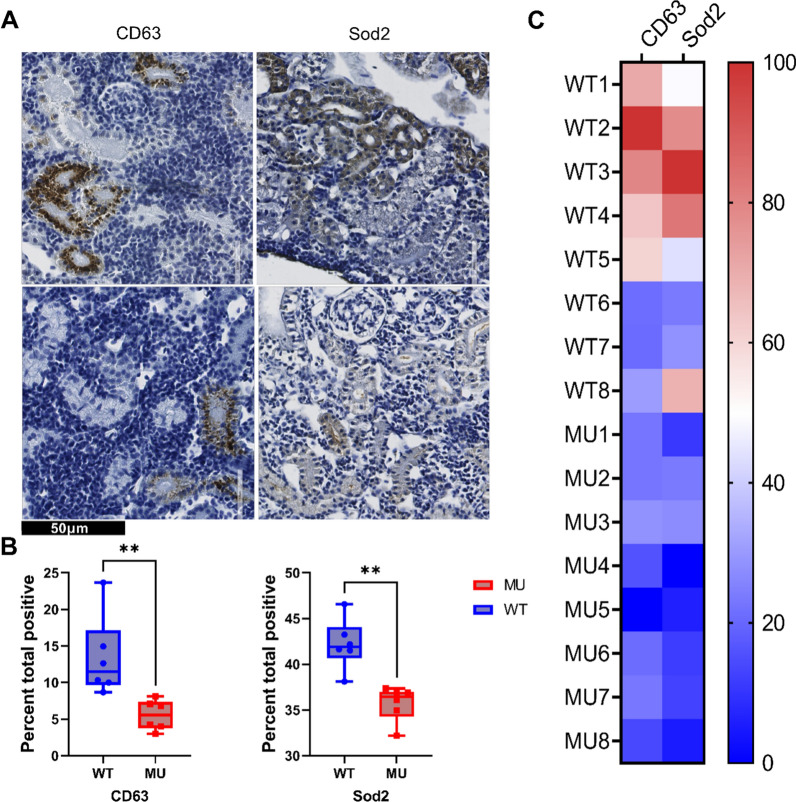
Methods: To investigate these mechanisms, we utilized a zebrafish (ZF) gla-/- mutant (MU) model. ZF naturally lack A4GALT gene and, therefore, cannot synthesize Gb3. We obtained kidney samples from both wild-type (WT) (n = 8) and MU (n = 8) ZF and conducted proteome profiling using untargeted mass spectrometry. Additionally, we examined mitochondria morphology and cristae morphology using electron microscopy. To assess oxidative stress, we measured total antioxidant activity. Finally, immunohistochemistry was conducted on kidney samples to validate specific proteins.

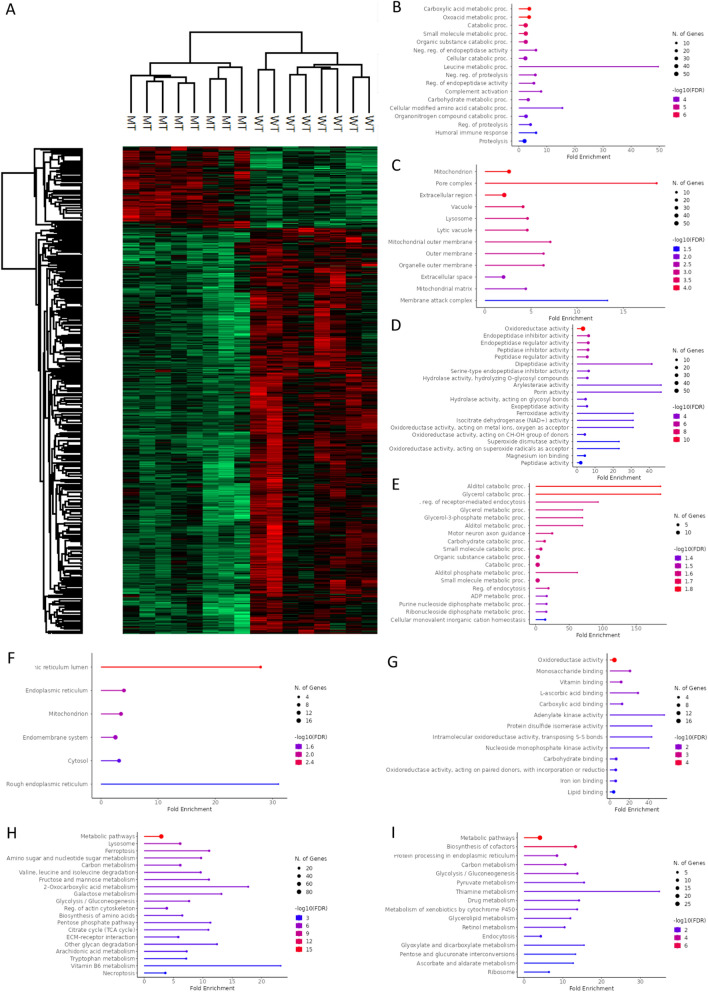
Results: Our proteomics analysis of renal tissues from zebrafish revealed downregulation of lysosome and mitochondrial-related proteins in gla-/- MU renal tissues, while energy-related pathways including carbon, glycolysis, and galactose metabolisms were disturbed. Moreover, we observed abnormal mitochondrial shape, disrupted cristae morphology, altered mitochondrial volume and lower antioxidant activity in gla-/- MU ZF.

Conclusions: These results suggest that the alterations observed at the proteome and mitochondrial level closely resemble well-known GLA mutation-related alterations in humans. Importantly, they also unveil novel Gb3-independent pathogenic mechanisms in Fabry disease. Understanding these mechanisms could potentially lead to the development of innovative drug screening approaches. Furthermore, the findings pave the way for identifying new clinical targets, offering new avenues for therapeutic interventions in Fabry disease. The zebrafish gla-/- mutant model proves valuable in elucidating these mechanisms and may contribute significantly to advancing our knowledge of this disorder.

Keywords: Fabry disease; Lysosome; Mitochondria; Stress.


Conflict of interest statement

The authors declare that they have no conflict of interest.

Figures

Fig. 1
Fig. 1
Proteomic comparison of kidneys from wild-type (WT; n = 8) and mutant (MU; n = 8) zebrafish. Gene ontology (GO) enrichment analysis and KEGG analysis. A Hierarchical clustering for differentially expressed proteins between WT and MT. Downregulated proteins in MU compared to WT in B GO Biological Process analysis; C GO Cellular component analysis; D GO Molecular function analysis. Upregulated proteins in MU compared with WT in E GO Biological Process analysis; F GO Cellular component analysis; G GO Molecular function analysis. H KEGG pathways related to downregulated proteins in MU compared to WT. I KEGG terms associated with upregulated proteins in MU vs. WT. Enrichments are reported as false discovery rates (FDR) ≤ 0.05. The twenty most enriched pathways are represented
Fig. 2
Fig. 2
Analysis of morphological parameters in wild-type and GLA-mutant mitochondria in cells from proximal and distal renal tubules. A Electron microscopy showing representative micrographs of mitochondria (red arrows) in cells from wild-type and mutant proximal and distal tubules; B Mitochondrial form factor and aspect ratio plotted against each other in proximal tubule; C Statistical comparison using mean with 95% confidence intervals (CI) for form factor and aspect ratios in mitochondria from proximal tubule cells; D Mitochondrial form factor and aspect ratio plotted against each other in distal tubule; E Statistical comparison using mean and 95% confidence intervals (CI) for form factor and aspect ratios in mitochondria from distal tubule cells; F, G Mitochondrial morphological parameters comparison in proximal tubules and distal tubules; H, I Mitochondrial volume and density determination in proximal and distal tubules. Values are represented as mean with upper 95% CI. Data were analyzed using Mann–Whitney test. *p-value ≤ 0.05; ****p-value ≤ 0.00001; ns = non-significant
Fig. 3
Fig. 3
Mitochondrial cristae morphology and area determination in proximal and distal tubules performed using TEM images and total antioxidant determination (TAC) in wild-type and GLA-mutant Zebrafish. A, B Individual score grades across the whole mitochondrial population analyzed in cells from renal proximal and distal tubules; C, D Total cristae area in cells from proximal and distal tubules; E, F Cristae volume in proximal and distal renal tubules; G, H Cumulative cristae mean scores for proximal and distal renal tubules, I TAC levels in adult (9-months-old) zebrafish kidney tissue lysates. For mitochondria cristae morphology quantification data represented as mean with upper 95% confidence interval. For TAC values are represented as violin plot representing the median and IQ ranges. Data were analyzed using Mann–Whitney test; ****p-value ≤ 0.00001; **p-value ≤ 0.001
Fig. 4
Fig. 4
Immunohistochemical analysis of the expression of selected proteins in wild-type and mutant zebrafish renal tissues. A Representative image of IHC analysis targeting mitochondrial marker Sod2 and lysosomal marker Cd63 in kidneys from wild-type and mutant ZF renal tissues; B Quantification of immunohistochemical staining of sections from wild-type and mutant ZF kidneys. Signal intensity is significantly higher in wild-type than in mutant specimens for CD63 and Sod2; C Heatmap showing protein expression of CD63) and Sod2 in mutant and wild-type kidney tissues, normalized as percent of positive pixels. Data analysis using Mann–Whitney test; **p-value ≤ 0.001

References

    1. Mapes CA, Sweeley CC. Galactosyl (alpha 1–4)galactosylceramide: galactosyl hydrolase activity in normal and Fabry plasma. Biochem Biophys Res Commun. 1973;53(4):1317–1324. - PubMed
    1. Desnick RJ, Ioannou YA, Eng CM. α-Galactosidase A Deficiency: Fabry Disease. In: Valle DL, Antonarakis S, Ballabio A, Beaudet AL, Mitchell GA, editors. The Online Metabolic and Molecular Bases of Inherited Disease. New York, NY: McGraw-Hill Education; 2019.
    1. Levstek T, Vujkovac B, Trebusak Podkrajsek K. Biomarkers of Fabry nephropathy: review and future perspective. Genes (Basel). 2020;11(9):1091. - PMC - PubMed
    1. Domm JM, Wootton SK, Medin JA, West ML. Gene therapy for Fabry disease: progress, challenges, and outlooks on gene-editing. Mol Genet Metab. 2021;134(1–2):117–131. - PubMed
    1. Khan A, Barber DL, Huang J, Rupar CA, Rip JW, Auray-Blais C, et al. Lentivirus-mediated gene therapy for Fabry disease. Nat Commun. 2021;12(1):1178. - PMC - PubMed

Publication types