

Standardized mortality ratios for regionalized acute cardiovascular care
- PMID: 37670336
- PMCID: PMC10481617
- DOI: 10.1186/s12913-023-09883-w
Standardized mortality ratios for regionalized acute cardiovascular care
Abstract
Background: Standardized Mortality Ratios (SMRs) are case-mix adjusted mortality rates per hospital and are used to evaluate quality of care. However, acute care is increasingly organized on a regional level, with more severe patients admitted to specialized hospitals. We hypothesize that the current case-mix adjustment insufficiently captures differences in case-mix between non-specialized and specialized hospitals. We aim to improve the SMR by adding proxies of disease severity to the model and by calculating a regional SMR (RSMR) for acute cerebrovascular disease (CVD) and myocardial infarction (MI).
Methods: We used data from the Dutch National Basic Registration of Hospital Care. We selected all admissions from 2016 to 2018. SMRs and RSMRs were calculated by dividing the observed in-hospital mortality by the expected in-hospital mortality. The expected in-hospital mortality was calculated using logistic regression with adjustment for age, sex, socioeconomic status, severity of main diagnosis, urgency of admission, Charlson comorbidity index, place of residence before admission, month/year of admission, and in-hospital mortality as outcome.
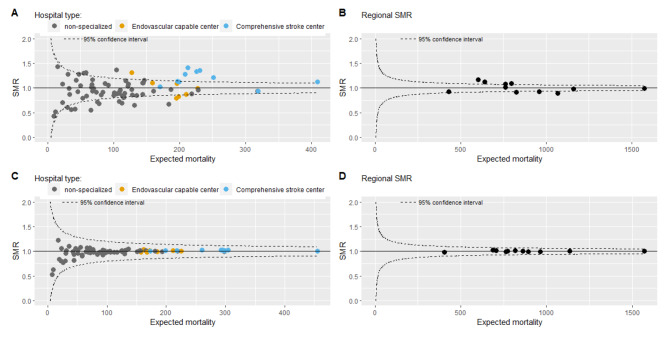
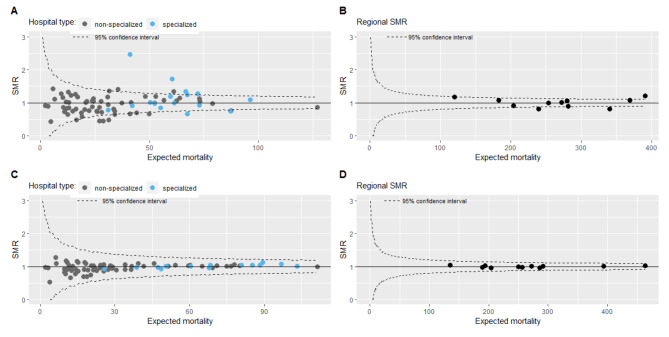
Results: The IQR of hospital SMRs of CVD was 0.85-1.10, median 0.94, with higher SMRs for specialized hospitals (median 1.12, IQR 1.00-1.28, 71%-SMR > 1) than for non-specialized hospitals (median 0.92, IQR 0.82-1.07, 32%-SMR > 1). The IQR of RSMRs was 0.92-1.09, median 1.00. The IQR of hospital SMRs of MI was 0.76-1.14, median 0.98, with higher SMRs for specialized hospitals (median 1.00, IQR 0.89-1.25, 50%-SMR > 1 versus median 0.94, IQR 0.74-1.11, 44%-SMR > 1). The IQR of RSMRs was 0.90-1.08, median 1.00. Adjustment for proxies of disease severity mostly led to lower SMRs of specialized hospitals.
Conclusion: SMRs of acute regionally organized diseases do not only measure differences in quality of care between hospitals, but merely measure differences in case-mix between hospitals. Although the addition of proxies of disease severity improves the model to calculate SMRs, real disease severity scores would be preferred. However, such scores are not available in administrative data. As a consequence, the usefulness of the current SMR as quality indicator is very limited. RSMRs are potentially more useful, since they fit regional organization and might be a more valid representation of quality of care.
Keywords: Cardiovascular care; Quality indicators; Quality of care.
© 2023. BioMed Central Ltd., part of Springer Nature.
Conflict of interest statement
The authors declare that they have no competing interests.
Figures
References
MeSH terms
LinkOut - more resources
Full Text Sources
Medical
Research Materials
