

LogD7.4 prediction enhanced by transferring knowledge from chromatographic retention time, microscopic pKa and logP
- PMID: 37670374
- PMCID: PMC10478446
- DOI: 10.1186/s13321-023-00754-4
LogD7.4 prediction enhanced by transferring knowledge from chromatographic retention time, microscopic pKa and logP
Abstract
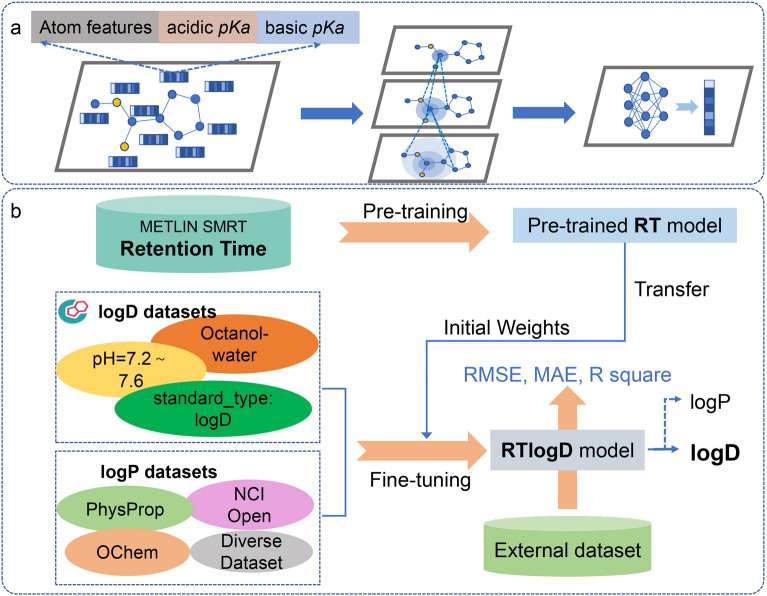
Lipophilicity is a fundamental physical property that significantly affects various aspects of drug behavior, including solubility, permeability, metabolism, distribution, protein binding, and toxicity. Accurate prediction of lipophilicity, measured by the logD7.4 value (the distribution coefficient between n-octanol and buffer at physiological pH 7.4), is crucial for successful drug discovery and design. However, the limited availability of data for logD modeling poses a significant challenge to achieving satisfactory generalization capability. To address this challenge, we have developed a novel logD7.4 prediction model called RTlogD, which leverages knowledge from multiple sources. RTlogD combines pre-training on a chromatographic retention time (RT) dataset since the RT is influenced by lipophilicity. Additionally, microscopic pKa values are incorporated as atomic features, providing valuable insights into ionizable sites and ionization capacity. Furthermore, logP is integrated as an auxiliary task within a multitask learning framework. We conducted ablation studies and presented a detailed analysis, showcasing the effectiveness and interpretability of RT, pKa, and logP in the RTlogD model. Notably, our RTlogD model demonstrated superior performance compared to commonly used algorithms and prediction tools. These results underscore the potential of the RTlogD model to improve the accuracy and generalization of logD prediction in drug discovery and design. In summary, the RTlogD model addresses the challenge of limited data availability in logD modeling by leveraging knowledge from RT, microscopic pKa, and logP. Incorporating these factors enhances the predictive capabilities of our model, and it holds promise for real-world applications in drug discovery and design scenarios.
Keywords: Graph neural network; Lipid solubility; Molecular property prediction; logD7.4.
© 2023. Springer Nature Switzerland AG.
Conflict of interest statement
The authors declare no competing interests.
Figures

References
-
- Waring MJ. Lipophilicity in drug discovery. Expert Opin Drug Discov. 2010;5:235–248. - PubMed
-
- Rutkowska E, Pajak K, Jozwiak K. Lipophilicity–methods of determination and its role in medicinal chemistry. Acta Pol Pharm. 2013;70:3–18. - PubMed
-
- Hughes JD, Blagg J, Price DA, Bailey S, Decrescenzo GA, Devraj RV, Ellsworth E, Fobian YM, Gibbs ME, Gilles RW, et al. Physiochemical drug properties associated with in vivo toxicological outcomes. Bioorg Med Chem Lett. 2008;18:4872–4875. - PubMed
-
- Challener C. Oral delivery of biologic APIs: the challenge continues. PharmTech Home. 2017;41:24–28.
Grants and funding
LinkOut - more resources
Full Text Sources
