. 2023 Jul 31;26(9):107499.
doi: 10.1016/j.isci.2023.107499. eCollection 2023 Sep 15.

A spatially structured mathematical model of the gut microbiome reveals factors that increase community stability

Affiliations

A spatially structured mathematical model of the gut microbiome reveals factors that increase community stability

Shota Shibasaki et al. iScience. .

Abstract

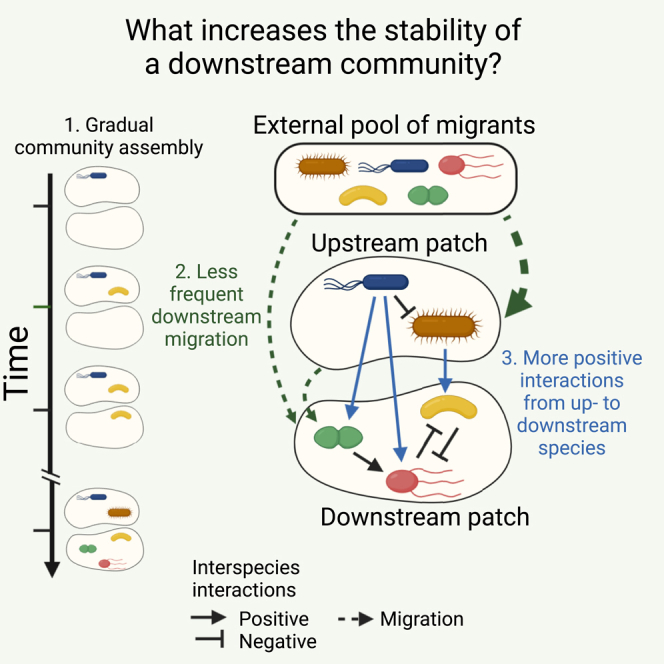
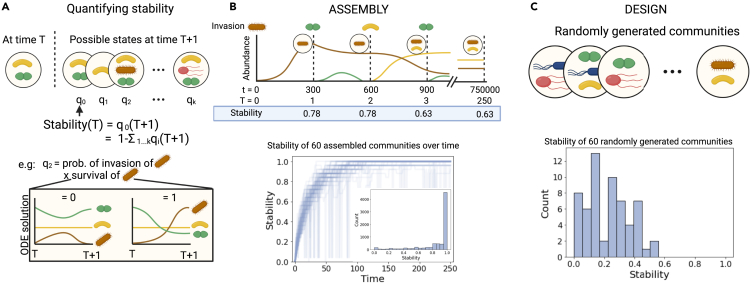
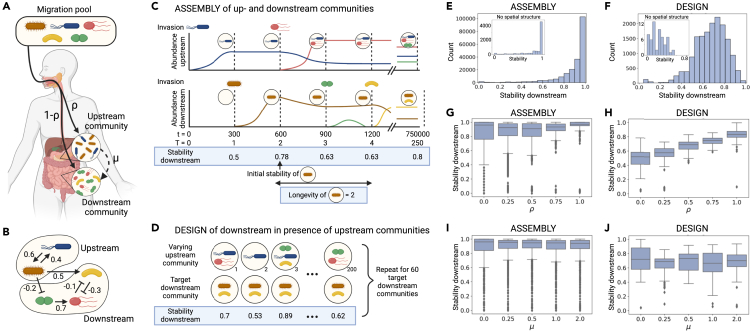
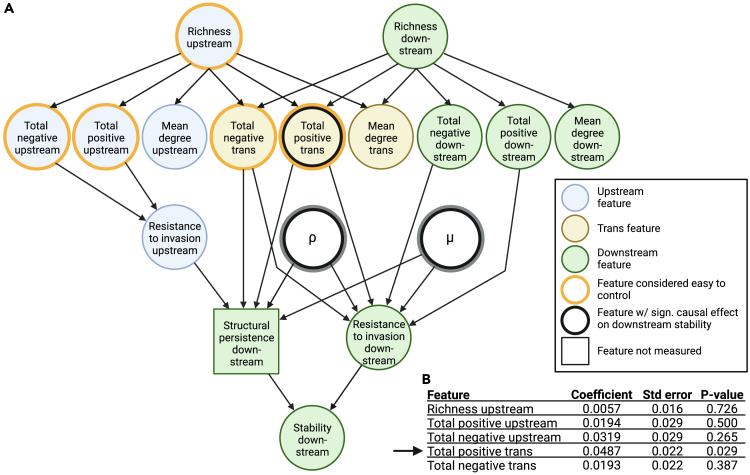
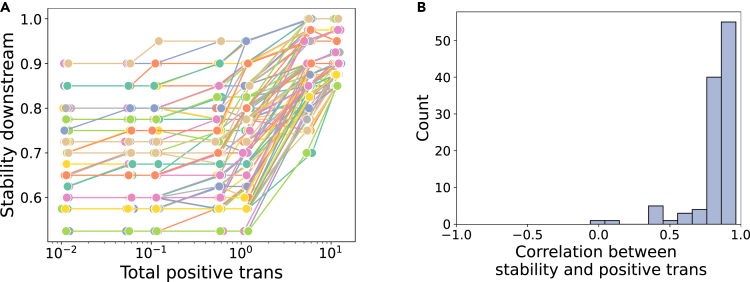
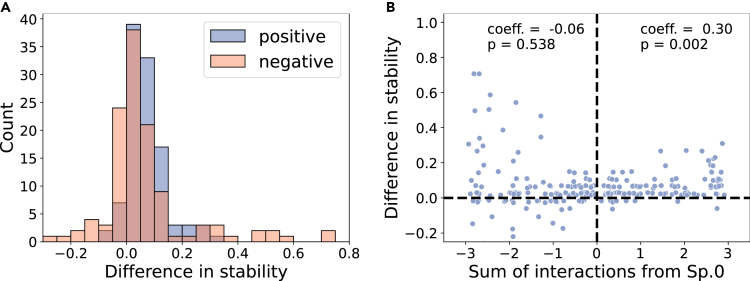
Given the importance of gut microbial communities for human health, we may want to ensure their stability in terms of species composition and function. Here, we built a mathematical model of a simplified gut composed of two connected patches where species and metabolites can flow from an upstream patch, allowing upstream species to affect downstream species' growth. First, we found that communities in our model are more stable if they assemble through species invasion over time compared to combining a set of species from the start. Second, downstream communities are more stable when species invade the downstream patch less frequently than the upstream patch. Finally, upstream species that have positive effects on downstream species can further increase downstream community stability. Despite it being quite abstract, our model may inform future research on designing more stable microbial communities or increasing the stability of existing ones.

Keywords: Experimental models in systems biology; Mathematical biosciences; Microbiome.


Conflict of interest statement

The authors declare no competing interests.

Figures

None
Graphical abstract
Figure 1
Figure 1
Stability with no spatial structure (A) We define the stability of a community at time step T as the probability q0(T+1) that the identical species composition is observed at time step T+1 (i.e., after invasion of one species and the stabilization of the dynamics). Species composition can change if an invader establishes and/or one or more resident species go extinct. For example, the probability that a new species establishes (q2(T+1)) is decomposed into the probability that a given species invades the community (uniform for all species in the migration pool) and establishes (0 or 1, given by solving the deterministic Equation 1b). See Section Method details for more details. (B) We simulated 60 communities that assembled as in nature through 250 sequential invasion events, where stability is measured at each time cycle T. Between time cycles T, community dynamics play out over 300 timesteps t. The plot shows the changes in stability in the 60 communities over time. The inset shows the histogram of stability over time. We removed data where invasion does not change species composition so that stable communities are not over-sampled. Most of the sampled stability was close to one. (C) In the design scenario, we generated locally stable communities with randomly chosen species composition. Measuring stability in these communities is comparable to measuring at one time point T in the assembly scenario. The plot shows the distribution of the stability of 60 such randomly generated communities. Created with BioRender.com.
Figure 2
Figure 2
Adding hierarchical spatial structure under two scenarios (A) In our hierarchical spatial structure, we consider the meta-community dynamics with two patches: upstream and downstream. Species can either migrate from the migration pool to (i) the upstream patch, (ii) or the downstream patch with likelihood ρ or 1ρ, respectively, or (iii) from the upstream patch to the downstream patch with likelihood scaled by μ. (B) An example of upstream and downstream communities and their features (see also Table 1). Here, species richness is two upstream and three downstream, respectively. The upstream community has only positive interspecific interactions and thus their total and mean strength are 1.0 and 0.5, respectively. The downstream community has one positive interspecific interaction and two negative ones. The total and mean strength of positive interactions there are 0.7, while the total and mean strength of negative interactions are 0.4 and 0.2, respectively. In addition, there are a positive and a negative interaction between the two communities: total (and mean) strength of positive interactions from the upstream to the downstream community is 0.5 and that of negative interactions is 0.2. The mean (in-)degrees within the upstream community and the downstream one are 1.0 (upstream: (1+1)/2=1, downstream: (1+2+0)/3=1). The mean degree from the upstream to the downstream is 0.667(=(1+1+0)/3). (C) The assembly scenario is as in Figure 1, but with an upstream community that can affect the downstream community (because of interactions as show in panel B). At each time step, one species migrates into either the up- or downstream community according to parameters ρ and μ. Stability is calculated for the downstream community only, and can change if the composition of the upstream community changes. Community longevity is calculated for a given community composition by counting the number of time steps T in which it persisted: see also Figure S10. We assembled 60 such communities for each parameter set (ρ,μ). (D) In the design scenario, 60 target downstream communities were generated for each parameter set (ρ,μ), and for each target, we generated 200 upstream communities and analyzed the stability of the downstream community using logistic regression. (E–J) The stability of the downstream communities sampled from the assembly (E, G, and I) and design (F, H, and J) scenarios. The top panels (E and F) represent the stability distribution under hierarchical spatial structure (with insets showing the distribution with no spatial structure), while the middle (G and H) and bottom panels (I and J) show the distributions given migration parameters ρ (migration from the migration pool to the upstream patch versus to the downstream) and μ (migration from the upstream patch to the downstream patch), respectively. Created with BioRender.com.
Figure 3
Figure 3
A full model of the causal diagram and resulting estimates (A) The assumed causal diagram is represented by a directed acyclic graph. Circles filled in blue, yellow and green are features related to the upstream community, the transition between the two communities and the downstream community, respectively. The features with a thick orange border are the five features we expect to be able to control externally. Features with a thick black border were found to have significant causal effects on downstream stability. The unobserved factor in this study, resistance to invasion in the upstream community, is written in a box. The main text outlines the rationale behind this model, and features are explained in Table 1. (B) Summary statistics of estimated causation on stability via logistic regression analysis. Only “total positive trans” had a significant causal effect on stability and is therefore highlighted with a black arrow and with a thick black border in panel (A). The effects of ρ and μ are shown in Figure 2 and statistics in the causal inference model in Table S9.
Figure 4
Figure 4
Manipulating positive interactions from upstream to downstream We manipulated only the total strength of positive interactions from the upstream to the downstream communities while keeping other community features constant. (A) Each line represents a different meta-community (n=110). (B) We calculated Spearman's correlation coefficient between stability and the total strength of positive interactions from the upstream to the downstream community in each meta-community. Except for one meta-community, downstream stability positively correlates with the total strength of positive interactions and the correlation coefficients are large (>0.8) in many cases.
Figure 5
Figure 5
Changes in stability in the pseudo-structured model In this analysis, we removed the spatial structure but assumed species 0 whose growth is not affected by the remaining species. We manipulated species 0’s interactions with three resident species in 240 simulation runs, and measured the stability of the resident communities with and without species 0. We removed some communities where the presence/absence of species 0 affects the coexistence of the resident species. (A) Histograms of difference in stability (stability of the residents with species 0 - without species 0). When species 0 has either positive or negative effects on the three resident species, stability increases (one-sided Wilcoxon signed-rank test: positive interactions: N=108, T=5687.0, and p<103, negative interactions: N=119, T=5646.0, and p<103). This may be because species richness increases stability without spatial structure (Table S1). (B) Testing for correlations between the total strength of interactions from species 0 to the three resident species and the difference in stability in its presence/absence (as in panel A). We find no significant correlation with negative interactions (Spearman correlation test, N=119, the correlation coefficient is ρ=0.06, p=0.538), but the sum of positive interactions from species 0 correlates positively with the increase in stability in its presence (Spearman correlation test, N=108, ρ=0.3, p=0.002).

Similar articles

Cited by

References

    1. Leibold M.A., Holyoak M., Mouquet N., Amarasekare P., Chase J.M., Hoopes M.F., Holt R.D., Shurin J.B., Law R., Tilman D., et al. The metacommunity concept: a framework for multi-scale community ecology. Ecol. Lett. 2004 6;7:601–613. doi: 10.1111/j.1461-0248.2004.00608.x. - DOI
    1. Economo E.P., Keitt T.H. Species diversity in neutral metacommunities: a network approach. Ecol. Lett. 2008;11:52–62. doi: 10.1111/j.1461-0248.2007.01126.x. - DOI - PubMed
    1. Chisholm C., Lindo Z., Gonzalez A. Metacommunity diversity depends on connectivity and patch arrangement in heterogeneous habitat networks. Ecography. 2011;34:415–424. doi: 10.1111/j.1600-0587.2010.06588.x. - DOI
    1. Seymour M., Fronhofer E.A., Altermatt F. Dendritic network structure and dispersal affect temporal dynamics of diversity and species persistence. Oikos. 2015;124:908–916.
    1. Holenstein K., Harvey E., Altermatt F. Patch size distribution affects species invasion dynamics in dendritic networks. Oikos. 2022;2022:1–11. doi: 10.1111/oik.08679. - DOI

LinkOut - more resources