. 2023 Oct;13(10):331.
doi: 10.1007/s13205-023-03741-6. Epub 2023 Sep 3.

Sitosterol-rich Digera muricata against 7-ketocholesterol and lipopolysaccharide-mediated atherogenic responses by modulating NF-ΚB/iNOS signalling pathway in macrophages

Affiliations

Sitosterol-rich Digera muricata against 7-ketocholesterol and lipopolysaccharide-mediated atherogenic responses by modulating NF-ΚB/iNOS signalling pathway in macrophages

Sangeetha Ravi et al. 3 Biotech. 2023 Oct.

Abstract

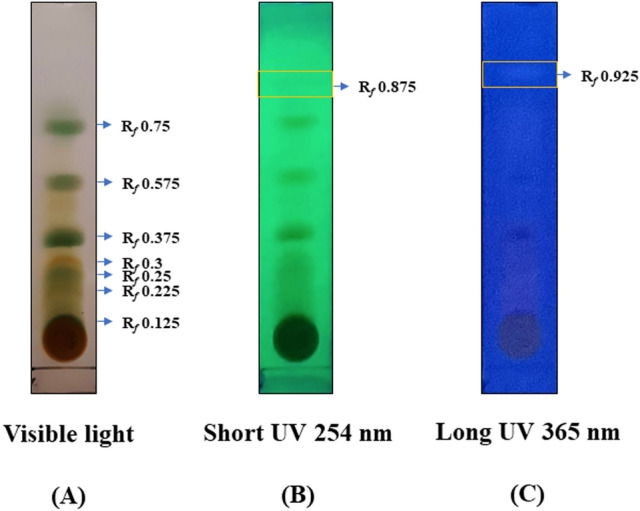
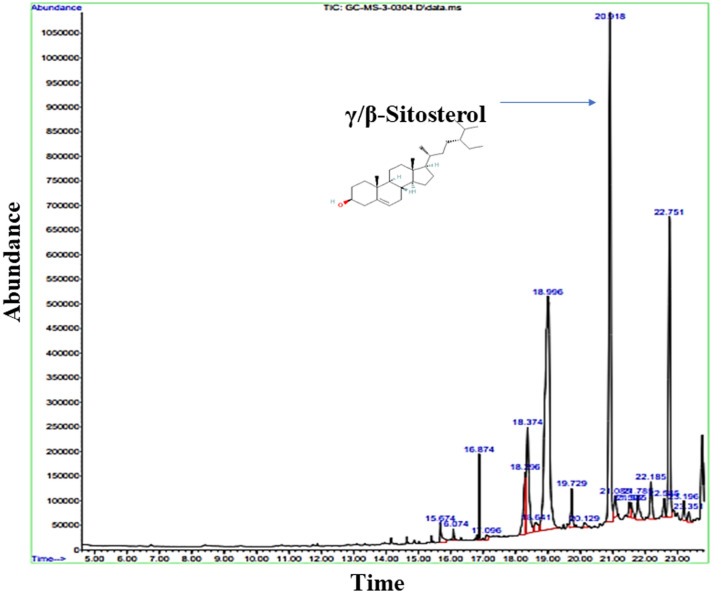
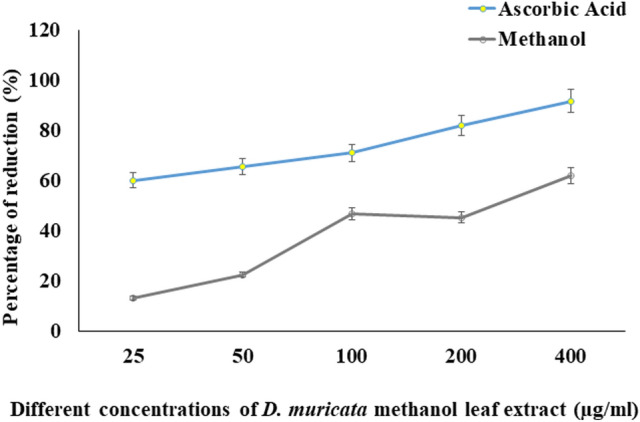
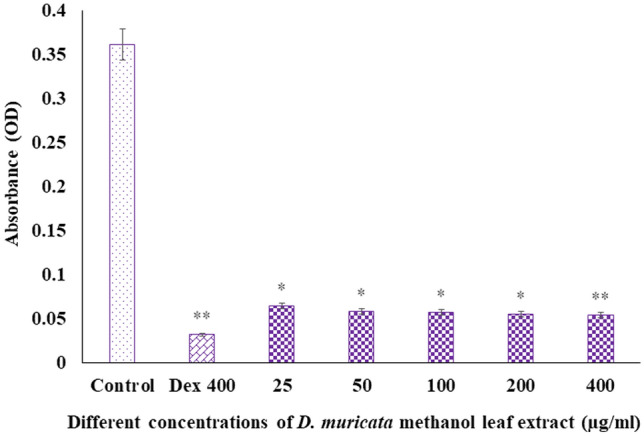
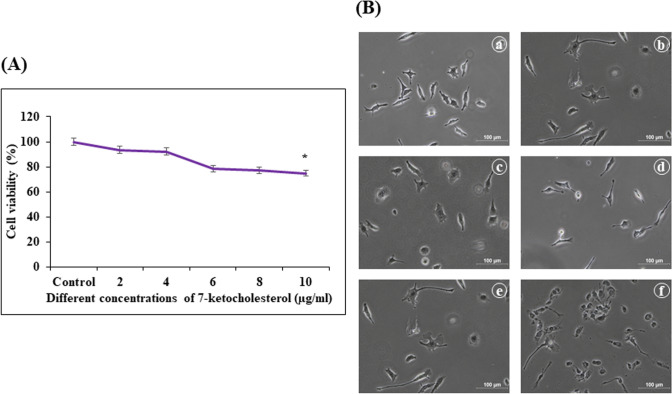
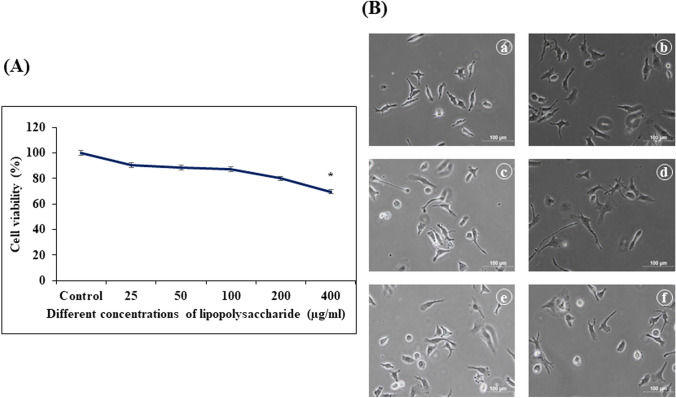
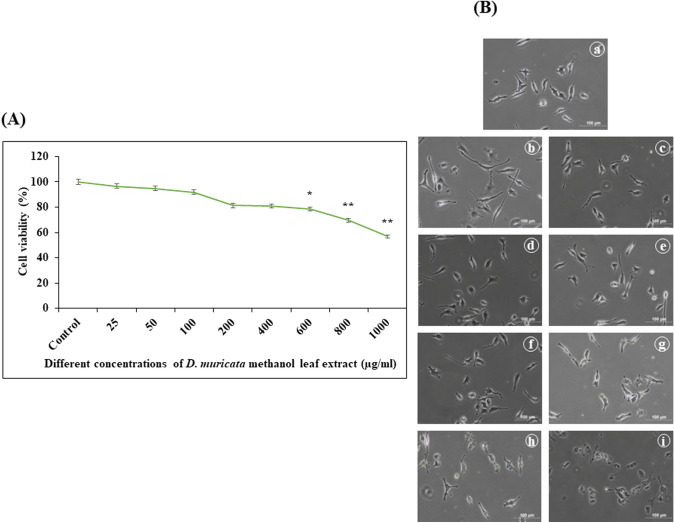
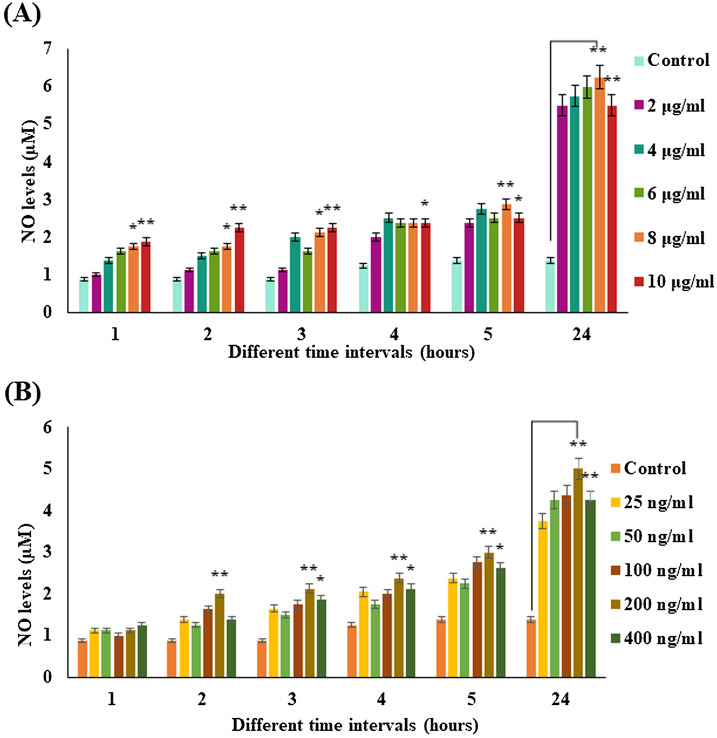
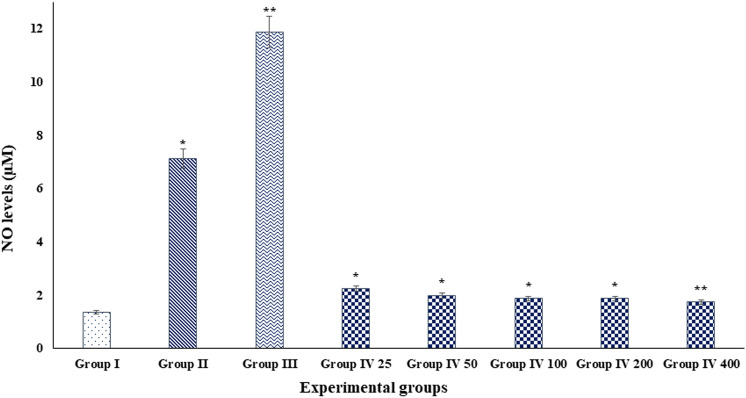
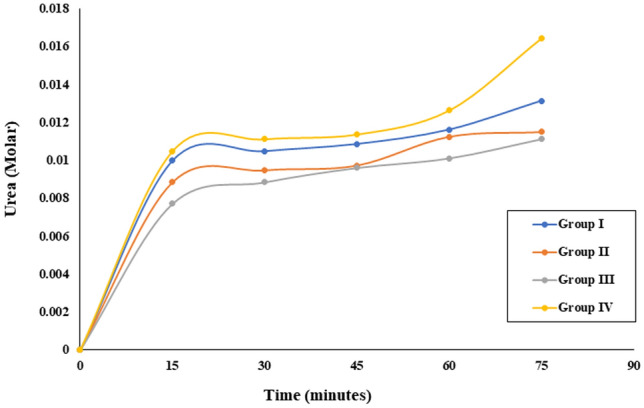
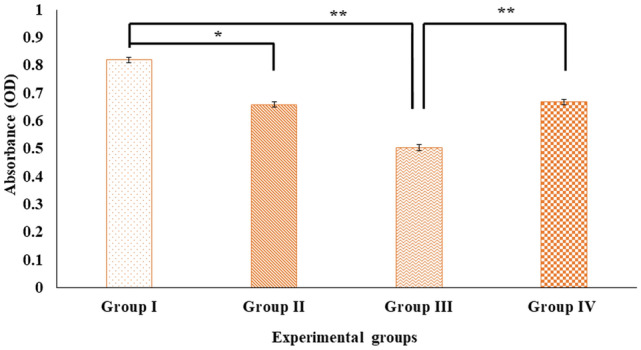
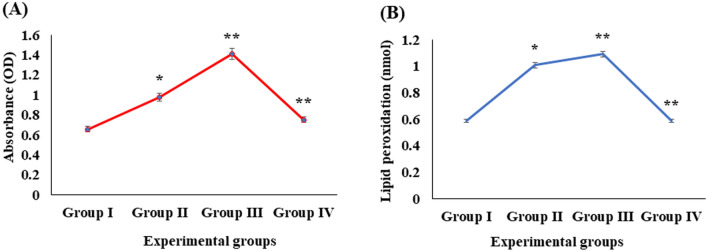
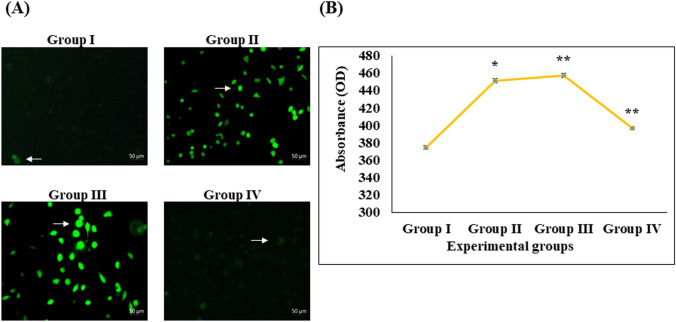
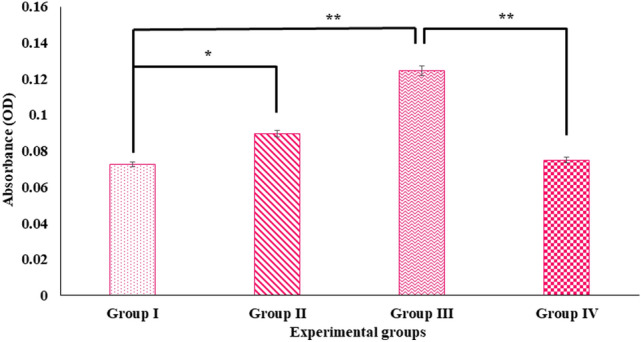
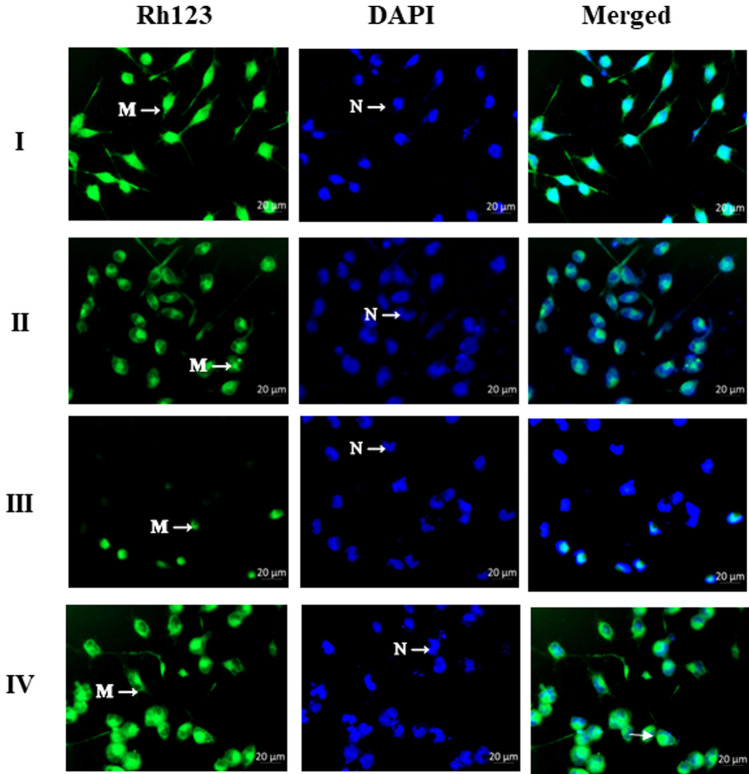
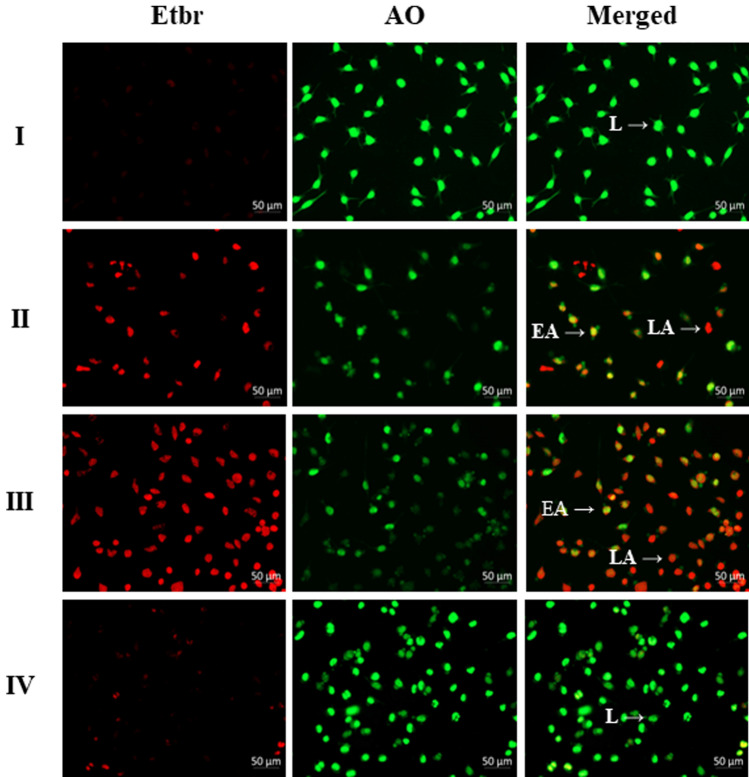
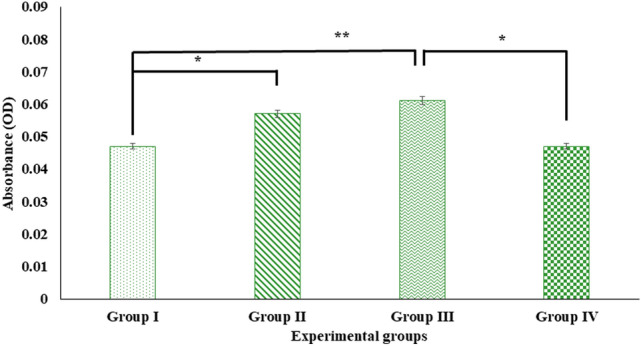
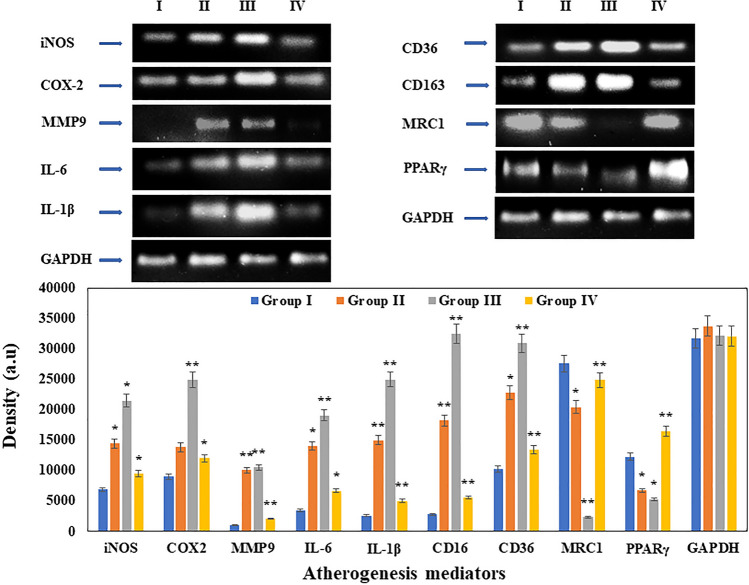
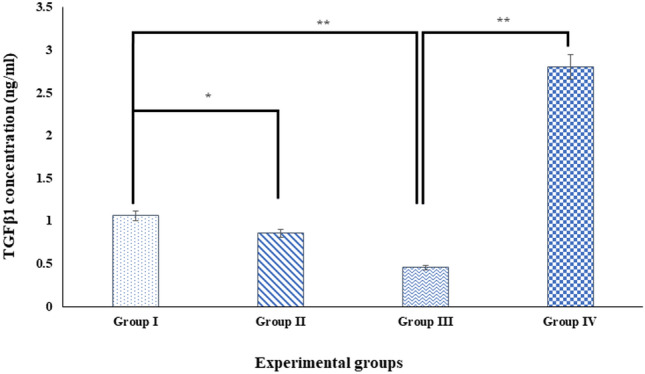
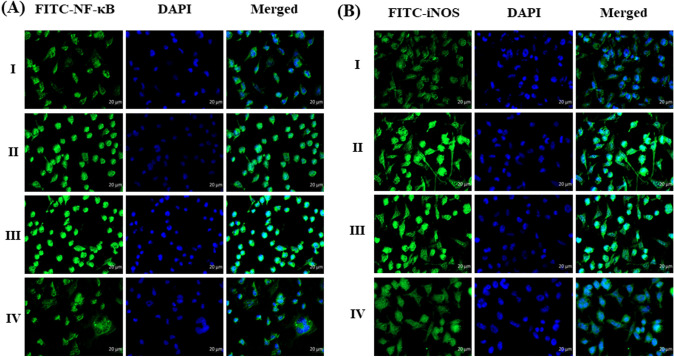
Digera muricata L., commonly known as Tartara, is an edible herb used as traditional medicine in many countries of Africa and Asia. This study aimed to elucidate the effect of a phytosterol-rich extract of D. muricata on 7-ketocholesterol-mediated atherosclerosis in macrophages. The extract was examined by phytochemical analyses, GC-MS, TLC, DPPH scavenging and hRBC membrane stabilization assays. Macrophage polarization was studied with experimental groups framed based on alamar blue cell viability and griess assays. Regulations of arginase enzyme activity, ROS generation, mitochondrial membrane potential, cell membrane integrity, pinocytosis, lipid uptake and peroxidation, as well as, intracellular calcium deposition were determined. In addition, expressions of atherogenic mediators were analysed using PCR, ELISA and immunocytochemistry techniques. Diverse phytochemicals with higher free radical scavenging activity and anti-inflammatory potential have been detected in the D. muricata. Co-treatment with D. muricata markedly reduced the atherogenic responses induced by 7KCh in the presence of LPS such as ROS, especially, NO and O2- along with lipid peroxidation. Furthermore, D. muricata significantly normalized mitochondrial membrane potential, cell membrane integrity, pinocytic activity, intracellular lipid accumulation and calcium deposition. These results provided us with the potentiality of D. muricata in ameliorating atherogenesis. Additionally, it decreased the expression of pro-atherogenic mediators (iNOS, COX-2, MMP9, IL-6, IL-1β, CD36, CD163 and TGFβ1) and increased anti-atherogenic mediators (MRC1 and PPARγ) with high cellular expressions of NF-κB and iNOS. Results showed the potential of sitosterol-rich D. muricata as a versatile biomedical therapeutic agent against abnormal macrophage polarization and its associated pathologies.

Keywords: 7-ketocholesterol; Atherosclerosis; Cytokines; Macrophages; Phytosterol.


Conflict of interest statement

Conflict of interestThe authors declare that they have no conflict of interest in the publication.

Figures

Fig. 1
Fig. 1
Thin layer chromatogram profile of Digera muricata leaf extract visualized under different light sources. A Visible light; B Short UV at 254 nm and C long UV at 365 nm
Fig. 2
Fig. 2
Gas chromatography–mass spectrometry chromatogram analysis of Digera muricata leaf extract
Fig. 3
Fig. 3
Free radical scavenging activity of Digera muricata leaf extract determined using DPPH assay with ascorbic acid as a standard reference at different concentrations (µg/ml). Each data represent the mean ± SD of three determinants
Fig. 4
Fig. 4
Anti-inflammatory activity of D. muricata leaf extract determined by its RBC membrane stabilization potential at different concentrations with dexamethasone (400 µg/ml) as a standard reference drug. Each data represent the mean ± SD of three determinants. The differences in the RBC membrane stabilization between control and treated cells were significant at *p < 0.05 and **p < 0.01
Fig. 5
Fig. 5
Effects of 7-ketocholesterol on viability and cytomorphology of M2 phenotypic IC-21 macrophages. A Percentage of cell viability of macrophages treated with different concentrations of 7-ketocholesterol (7KCh) for 24 h assessed by Alamar blue reagent. Each data represent the mean ± SD of three determinants. The differences in the cellular viability between control and treated cells were significant at *p < 0.05. B Cytomorphology of macrophages under control condition (a) and treatment with different concentrations of 7KCh (b 2 µg/ml; c 4 µg/ml; d 6 µg/ml; e 8 µg/ml and f 10 µg/ml)
Fig. 6
Fig. 6
Effects of lipopolysaccharide on viability and cytomorphology of M2 phenotypic IC-21 macrophages. A Percentage of cell viability of macrophages treated with different concentrations of lipopolysaccharide (LPS) for 24 h assessed by alamar blue reagent. Each data represents the mean ± SD of three determinants. The differences in the cellular viability between control and treated cells were significant at *p < 0.05. B Cytomorphology of macrophages under control condition (a) and treatment with different concentrations of LPS (b 25 ng/ml; c 50 ng/ml; d 100 ng/ml; e 200 ng/ml and f 400 ng/ml)
Fig. 7
Fig. 7
Effect of Digera muricata leaf extract on viability and cytomorphology of M2 phenotypic IC-21 macrophages. A Percentage of cell viability of macrophages treated with different D. muricata leaf extract concentrations for 24 h assessed by alamar blue reagent. Each data represents the mean ± SD of three determinants. The differences in the cellular viability between control and treated cells were significant at *p < 0.05 and **p < 0.01. B Cytomorphology of macrophages under control condition (a) and treatment with different concentrations of D. muricata leaf extract (b 25 µg/ml; c 50 µg/ml; d 100 µg/ml; e 200 µg/ml; f 400 µg/ml; g 600 µg/ml; h 800 µg/ml and i 1000 µg/ml)
Fig. 8
Fig. 8
Quantification of nitric oxide (NO) generation upon 7KCh and LPS stimulation of IC-21 macrophages following griess assay upon treatment with A 7-ketocholesterol and B lipopolysaccharide at various concentrations and time intervals. Each data represents the mean ± SD of three determinants. The difference in the nitric oxide production between control and treated cells was significant at *p < 0.05 and **p < 0.01
Fig. 9
Fig. 9
Quantification of nitric oxide (NO) generation by IC-21 macrophages following Griess assay upon treatment with different experimental groups (Group I—control cells; Group II—cells treated with 8 µg/ml of 7KCh; Group III—cells treated with 8 µg/ml of 7KCh and 200 ng/ml of LPS; Group IV 25–400—cells treated with 8 µg/ml of 7KCh, 200 ng/ml of LPS and co-treated with different concentrations of D. muricata leaf extract) at 24-h time period. The effect of D. muricata leaf extract at different concentrations was estimated and compared with group III (7KCh + LPS) for significance in reduction. Each data represents the mean ± SD of three determinants. The difference in the nitric oxide production between groups I and II–III and groups III and IV were significant at *p < 0.05 and **p < 0.01
Fig. 10
Fig. 10
Effect of D. muricata leaf extract on arginase enzyme activity of M2 phenotypic IC-21 macrophages. Each data represents the mean ± SD of three determinants
Fig. 11
Fig. 11
Pinocytic activity of IC-21 macrophages was determined by neutral red dye uptake upon treatment with different experimental groups (Group I—control cells; Group II—cells treated with 8 µg/ml of 7KCh; Group III—cells treated with 8 µg/ml of 7KCh and 200 ng/ml of LPS; Group IV 25–400—cells treated with 8 µg/ml of 7KCh, 200 ng/ml of LPS and co-treated with 400 µg/ml of D. muricata leaf extract). Significant differences in the amount of neutral red uptake following 24 h of treatment suggest a potential difference in the pinocytic capacity of macrophages. Each data represents the mean ± SD of three determinants. The difference in the pinocytic activity between groups I and II–III and groups III and IV were significant at *p < 0.05 and **p < 0.01
Fig. 12
Fig. 12
A 7-ketocholesterol uptake by IC-21 macrophages was quantified using lipid accumulation assay with oil red O staining in experimental groups (Group I—control cells; Group II—cells treated with 8 µg/ml of 7KCh; Group III—cells treated with 8 µg/ml of 7KCh and 200 ng/ml of LPS; Group IV 25–400—cells treated with 8 µg/ml of 7KCh, 200 ng/ml of LPS and co-treated with 400 µg/ml of D. muricata leaf extract) after 24 h. Each data represents the mean ± SD of three determinants. The difference in the lipid accumulation levels between groups I and II–III and groups III and IV were significant at *p < 0.05 and **p < 0.01. B Total lipid peroxidation level measurement of thiobarbituric acid reactive substances (TBARS) in IC-21 macrophages following treatment with different experimental groups (Group I—control cells; Group II—cells treated with 8 µg/ml of 7KCh; Group III—cells treated with 8 µg/ml of 7KCh and 200 ng/ml of LPS; Group IV 25–400—cells treated with 8 µg/ml of 7KCh, 200 ng/ml of LPS and co-treated with 400 µg/ml of D. muricata leaf extract). Each data represents the mean ± SD of three determinants. The difference in the lipid peroxidation levels between groups I and II–III and groups III and IV were significant at *p < 0.05 and **p < 0.01
Fig. 13
Fig. 13
Quantitative and qualitative detection of ROS generation by DCFH-DA in M2 phenotypic IC-21 macrophages. A ROS level observed under a fluorescent microscope (→ in the figures denote the level of ROS generated inside the macrophages). B Estimation of ROS level produced by different experimental groups (Group I—control cells; Group II—cells treated with 8 µg/ml of 7KCh; Group III—cells treated with 8 µg/ml of 7KCh and 200 ng/ml of LPS; Group IV 25–400—cells treated with 8 µg/ml of 7KCh, 200 ng/ml of LPS and co-treated with 400 µg/ml of D. muricata leaf extract) after treatment for 24 h. The fluorescent absorbance (OD) was measured with a spectrofluorometer at an excitation of 485 nm and an emission of 530 nm. Each data represents the mean ± SD of three determinants. The difference in the ROS levels between groups I and II–III and groups III and IV were significant at *p < 0.05 and **p < 0.01
Fig. 14
Fig. 14
Level of superoxide generation estimated using NBT quantification assay in M2 phenotypic IC-21 macrophages (Group I—control cells; Group II—cells treated with 8 µg/ml of 7KCh; Group III—cells treated with 8 µg/ml of 7KCh and 200 ng/ml of LPS; Group IV 25–400—cells treated with 8 µg/ml of 7KCh, 200 ng/ml of LPS and co-treated with 400 µg/ml of D. muricata leaf extract) after experimentation for 24 h. The levels are expressed as absorbance (OD). Each data represents the mean ± SD of three determinants. The difference in the superoxide anion generation between groups I and II–III and groups III and IV was significant at *p < 0.05 and **p < 0.01
Fig. 15
Fig. 15
Fluorescent imaging for mitochondrial membrane potential analysis of experimented IC-21 macrophages using rhodamine 123 (Rh123) and 4′,6-diamidino-2-phenylindole (DAPI). Images expose the level of active mitochondria in live cells upon treatment with different experimental groups after 24 h (Group I—control cells; Group II—cells treated with 8 µg/ml of 7KCh; Group III—cells treated with 8 µg/ml of 7KCh and 200 ng/ml of LPS; Group IV 25–400—cells treated with 8 µg/ml of 7KCh, 200 ng/ml of LPS and co-treated with 400 µg/ml of D. muricata leaf extract). DAPI was used as a counter stain for the nucleus. Macrophages were observed under a confocal fluorescent microscope and the indications in the images are as follows: M → active mitochondria and N → nucleus
Fig. 16
Fig. 16
Membrane integrity analysis of experimented IC-21 macrophages visualized under a confocal fluorescent microscope using acridine orange (AO) and ethidium bromide (EB) nuclear stains. Images expose the level of membrane integrity in cells upon treatment with different experimental groups after 24 h (Group I—control cells; Group II—cells treated with 8 µg/ml of 7KCh; Group III—cells treated with 8 µg/ml of 7KCh and 200 ng/ml of LPS; Group IV 25–400—cells treated with 8 µg/ml of 7KCh, 200 ng/ml of LPS and co-treated with 400 µg/ml of D. muricata leaf extract). Macrophages were observed and the indications in the images are as follows: L → live cells; EA → early apoptotic cells and LA → late apoptotic cells
Fig. 17
Fig. 17
Quantitative analysis of intracellular calcium deposition in cultured M2 phenotypic IC-21 macrophages using alizarin red S staining. Data represents the level of calcium deposits in each of the experimental groups after 24 h of treatment (Group I—control cells; Group II—cells treated with 8 µg/ml of 7KCh; Group III—cells treated with 8 µg/ml of 7KCh and 200 ng/ml of LPS; Group IV 25–400—cells treated with 8 µg/ml of 7KCh, 200 ng/ml of LPS and co-treated with 400 µg/ml of D. muricata leaf extract). Each data represents the mean ± SD of three determinants. The difference in the calcium deposition between groups I and II–III and groups III and IV were significant at *p < 0.05 and **p < 0.01
Fig. 18
Fig. 18
Gene expression of pro-atherogenic enzymes (iNOS, COX-2 and MMP-9), interleukins (IL-6 and IL-1β), pro-atherogenic scavenging receptors (CD163 and CD36) and anti-atherogenic surface receptors (MRC1 and PPARγ) which are specific for M1 and M2 phenotypic macrophages were analysed. Pro-atherogenic mediators were found to be upregulated, whereas anti-atherogenic mediators were downregulated in the 7KCh along and 7KCh + LPS treated cells (Groups II and III) compared to the control condition (Group I). From the gel electrophoresis results, co-treatment with D. muricata leaf extract (Group IV) has evidently modulated the expression of macrophage mediators. Densitometric values of the obtained bands were platted in graphs for comparison. Each data represents the mean ± SD of three determinants. The difference in the gene expression levels between groups I and II–III and groups III and IV were significant at *p < 0.05 and **p < 0.01
Fig. 19
Fig. 19
Effect of D. muricata leaf extract on the TGFβ1 cytokine expression in M2 phenotypic IC-21 macrophages. Each data represents the mean ± SD of three determinants. The difference in the TGFβ1 cytokine level between groups I and II–III and groups III and IV were significant at *p < 0.05 and **p < 0.01
Fig. 20
Fig. 20
Effect of D. muricata leaf extract on protein expression of A nuclear transcription factor NF-κB and B pro-inflammatory mediator iNOS in M2 phenotypic IC-21 macrophages when induced with 7KCh and LPS

Similar articles

Cited by

References

    1. Adegbola PI, Adetutu A, et al. Antioxidant activity of Amaranthus species from the Amaranthaceae family—a review. S Afr J Bot. 2020;1(133):111–117. doi: 10.1016/j.sajb.2020.07.003. - DOI
    1. Afrin S, Gasparrini M, et al. Protective effects of Manuka honey on LPS-treated RAW 264.7 macrophages. Part 1: enhancement of cellular viability, regulation of cellular apoptosis and improvement of mitochondrial functionality. Food Chem Toxicol. 2018;1(121):203–213. doi: 10.1016/j.fct.2018.09.001. - DOI - PubMed
    1. Al Obaydi MF, Hamed WM, et al. Terfezia boudieri: a desert truffle with anticancer and immunomodulatory activities. Front Nutr. 2020;8(7):38. doi: 10.3389/fnut.2020.00038. - DOI - PMC - PubMed
    1. Anderson A, Campo A, et al. 7-Ketocholesterol in disease and aging. Redox Biol. 2020;1(29):101380. doi: 10.1016/j.redox.2019.101380. - DOI - PMC - PubMed
    1. Arulmathi R, Sudarmani DN, et al. Screening and evaluation of invasive weeds against Pseudomonas aeruginosa (Mtcc 3541) for quorum sensing interference and its free radical scavenging. Res J Pharm Technol. 2017;10(2):525–528. doi: 10.5958/0974-360X.2017.00104.4. - DOI

LinkOut - more resources