. 2023 Aug 21:14:1068191.
doi: 10.3389/fpls.2023.1068191. eCollection 2023.

Unravelling the diversity in water usage among wild banana species in response to vapour pressure deficit

Affiliations

Unravelling the diversity in water usage among wild banana species in response to vapour pressure deficit

David Eyland et al. Front Plant Sci. .

Abstract

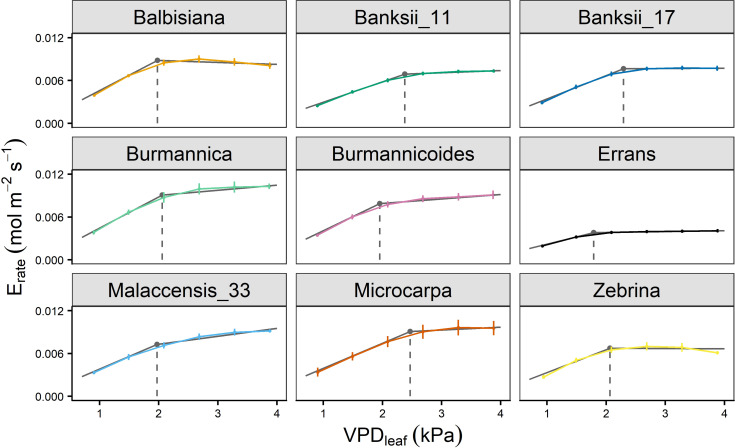
The rise in global temperature is not only affecting plant functioning directly, but is also increasing air vapour pressure deficit (VPD). The yield of banana is heavily affected by water deficit but so far breeding programs have never addressed the issue of water deficit caused by high VPD. A reduction in transpiration at high VPD has been suggested as a key drought tolerance breeding trait to avoid excessive water loss, hydraulic failure and to increase water use efficiency. In this study, stomatal and transpiration responses under increasing VPD at the leaf and whole-plant level of 8 wild banana (sub)species were evaluated, displaying significant differences in stomatal reactivity. Three different phenotypic groups were identified under increasing VPD. While (sub)species of group III maintained high transpiration rates under increasing VPD, M. acuminata ssp. errans (group I), M. acuminata ssp. zebrina (group II) and M. balbisiana (group II) showed the highest transpiration rate limitations to increasing VPD. In contrast to group I, group II only showed strong reductions at high VPD levels, limiting the cost of reduced photosynthesis and strongly increasing their water use efficiency. M. acuminata ssp. zebrina and M. balbisiana thus show the most favourable responses. This study provides a basis for the identification of potential parent material in gene banks for breeding future-proof bananas that cope better with lack of water.

Keywords: breeding; drought tolerance; stomatal conductance; transpiration; vapour pressure deficit; water use efficiency; wild banana species.


Conflict of interest statement

The authors declare that the research was conducted in the absence of any commercial or financial relationships that could be construed as a potential conflict of interest.

Figures

Figure 1
Figure 1
Quantification of the transpiration reduction (ϕE) according to Franks et al (1999). and Ryan et al. (2016). A linear regression was fitted through the transpiration rate at the first two air-to-leaf vapour pressure deficit (VPDleaf) levels. This linear regression was extrapolated (dashed line) to estimate the transpiration rate (Epred) at VPDleaf of 2.69, 3.28 and 3.87 kPa. Epred was then compared to the measured transpiration rate (Emeas) to calculate ϕE (Eq. 1).
Figure 2
Figure 2
Three phenotypic groups (I, II, III) were defined by k-means clustering based on the stomatal reduction, transpiration reduction and photosynthetic limitation under increasing VPD (see variables in Table 2 ). Both variables measured by leaf gas exchange and whole-plant transpiration were included. Lines and regions represent the three phenotypic groups from k-means clustering plotted along the first two principal components ( Table 2 ). The first principal component was mainly determined by the limitation of photosynthetic rate at high VPDs and the transpiration reduction at leaf and whole-plant level. Important variables in the second principal component were the slope before the breakpoint in transpiration rate with increasing VPD and the stomatal reduction.
Figure 3
Figure 3
Gas exchange response to step-increases in leaf-to-air vapour pressure deficit (VPDleaf) for 9 wild banana accessions. Steady-state response of (A) stomatal conductance (gs), (B) transpiration rate (Erate), (C) photosynthetic rate (A), (D) intrinsic water use efficiency (iWUE) to increasing VPDleaf. Data represent mean ± se values after 60 min at a specific VPDleaf level (n=3-7). Significance is shown in Table A.1 .
Figure 4
Figure 4
Transpiration rate response of 9 wild banana accessions to step-increases in leaf-to-air vapour pressure deficit (VPDleaf). A significant breakpoint in transpiration rate was identified for all accessions (P-value Davies Test < 0.05). Solid grey lines represent slopes of the modelled segmented response. Grey point and dashed grey line represent the breakpoint in transpiration rate and the VPDleaf of the breakpoint. Data represent mean ± se values after 60 min at a specific VPDleaf level (n=3-7).
Figure 5
Figure 5
Slopes and breakpoints of the segmented transpiration rate response to step-increases in leaf-to-air vapour pressure deficit (VPDleaf). (A) Relation between the breakpoint in transpiration rate and the slope before the breakpoint. (B) Relation between the breakpoint in transpiration rate and the slope after the breakpoint. Three groups (I, II, III) were defined by k-means clustering and are represented by black lines connecting the included accessions. All segmented responses were significant (P < 0.05). Data represent the optimal estimated value ± se. (n=3-7).
Figure 6
Figure 6
Transpiration reduction (ϕE) and limitation of photosynthetic rate (A) with increasing leaf-to-air vapour pressure deficit (VPDleaf). (A) ϕE in response to increasing VPDleaf. ϕE was determined as shown in Eq. 1. (B) Limitation of A in response to increasing VPDleaf. The limitation of A was determined as shown in Eq. 2. Data represent mean ± se. (n=3-7). Significance is shown in Tables A.2 , A.3 .
Figure 7
Figure 7
Stomatal reduction (ϕstom) in relation to the maximum observed stomatal conductance (max gs). The ϕstom and max gs were significantly correlated (R² = 0.88, P < 0.001). Data represent mean ± se (n=3-7). Significance is shown in Table A.4 .
Figure 8
Figure 8
Whole-plant transpiration rate (Erate) response to step-increases in air vapour pressure deficit (VPD) for 9 wild banana accessions. Note that VPD values slightly differed between accessions depending on the maximal drying capacity of the growth chamber. Data represent mean ± se values after 60 min at a specific VPD level (n=4-8). Significance is shown in Table A.5 .
Figure 9
Figure 9
Whole-plant transpiration rate (Erate) response of 9 wild banana accessions to step-increases in air vapour pressure deficit (VPD). A significant breakpoint in transpiration rate was identified for all accessions (P-value Davies Test < 0.05). Solid grey lines represent slopes of the modelled segmented response. Grey point and dashed grey line represent the breakpoint in transpiration rate and the VPD of the breakpoint. Data represent mean ± se (n=4-8).
Figure 10
Figure 10
Slopes and breakpoints of the segmented whole-plant transpiration rate (Erate) response to step-increases in air vapour pressure deficit (VPD). (A) Relation between the breakpoint in whole-plant transpiration rate and the slope before the breakpoint. (B) Relation between the breakpoint in whole-plant transpiration rate and the slope after the breakpoint. Three groups (I, II, III) were defined by k-means clustering and are represented by black lines connecting the included accessions. All segmented responses were significant (P < 0.05). Data represent the optimal estimated value ± se (n = 4-8).
Figure 11
Figure 11
Transpiration reduction measured at whole-plant level (ϕE, whole-plant) at VPD 2.64 kPa in relation to the transpiration reduction measured at leaf level (ϕE, leaf level) at VPDleaf 2.69 kPa. The ϕE at leaf and whole-plant level were significantly correlated (R² = 0.52, P < 0.05). Data represent mean ± se (n=4-8). Significant differences between accessions or groups are indicated in Tables A.2 , A.6 .

Similar articles

References

    1. Aubert B., Catsky J. (1970). The onset of photosynthetic CO2 influx in banana leaf segments as related to stomatal diffusion resistance at different air humidities. Photosynthetica 4 (3), 254–256.
    1. Bauer H., Ache P., Lautner S., Fromm J., Hartung W., Al-Rasheid K. A. S., et al. . (2013). The stomatal response to reduced relative humidity requires guard cell-autonomous ABA synthesis. Curr. Biol. 23 (1), 53–57. doi: 10.1016/j.cub.2012.11.022 - DOI - PubMed
    1. Baurens F. C., Martin G., Hervouet C., Salmon F., Yohomé D., Ricci S., et al. . (2019). Recombination and large structural variations shape interspecific edible bananas genomes. Mol. Biol. Evol. 36 (1), 97–111. doi: 10.1093/molbev/msy199 - DOI - PMC - PubMed
    1. Breshears D. D., Adams H. D., Eamus D., Mcdowell N. G., Law D. J., Will R. E., et al. . (2013). The critical amplifying role of increasing atmospheric moisture demand on tree mortality and associated regional die-off. Front. Plant Sci. 4 (266). doi: 10.3389/fpls.2013.00266 - DOI - PMC - PubMed
    1. Brodribb T. J., Jordan G. J. (2008). Internal coordination between hydraulics and stomatal control in leaves. Plant Cell Environ. 31 (11), 1557–1564. doi: 10.1111/j.1365-3040.2008.01865.x - DOI - PubMed

LinkOut - more resources