. 2023 Aug 9;3(8):100548.
doi: 10.1016/j.crmeth.2023.100548. eCollection 2023 Aug 28.

Single-cell sequencing of individual retinal organoids reveals determinants of cell-fate heterogeneity

Affiliations

Single-cell sequencing of individual retinal organoids reveals determinants of cell-fate heterogeneity

Amy Tresenrider et al. Cell Rep Methods. .

Abstract

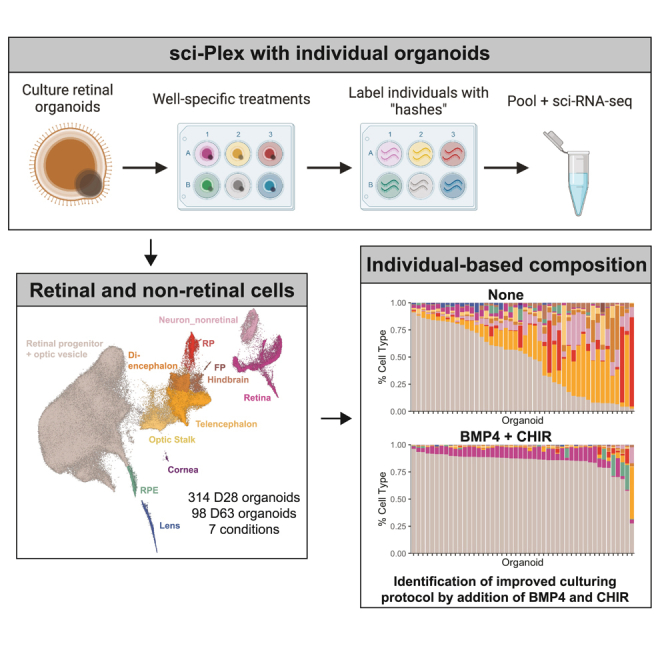
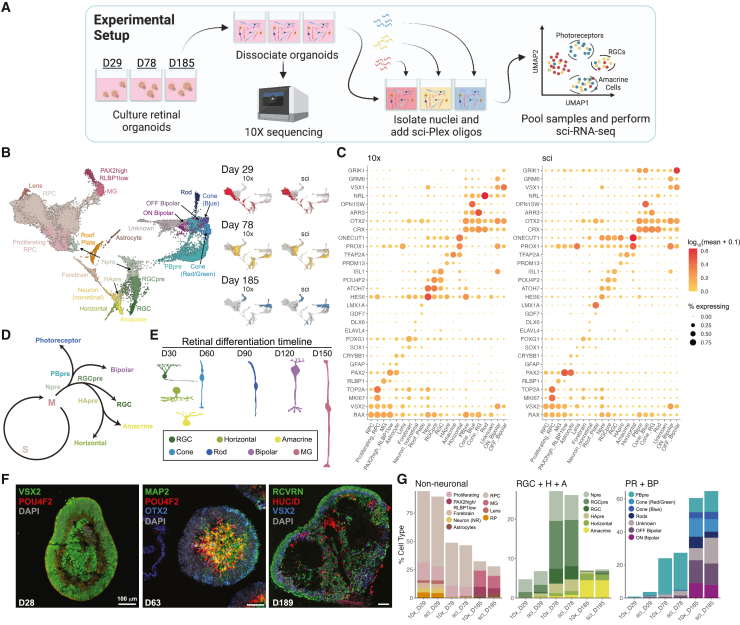
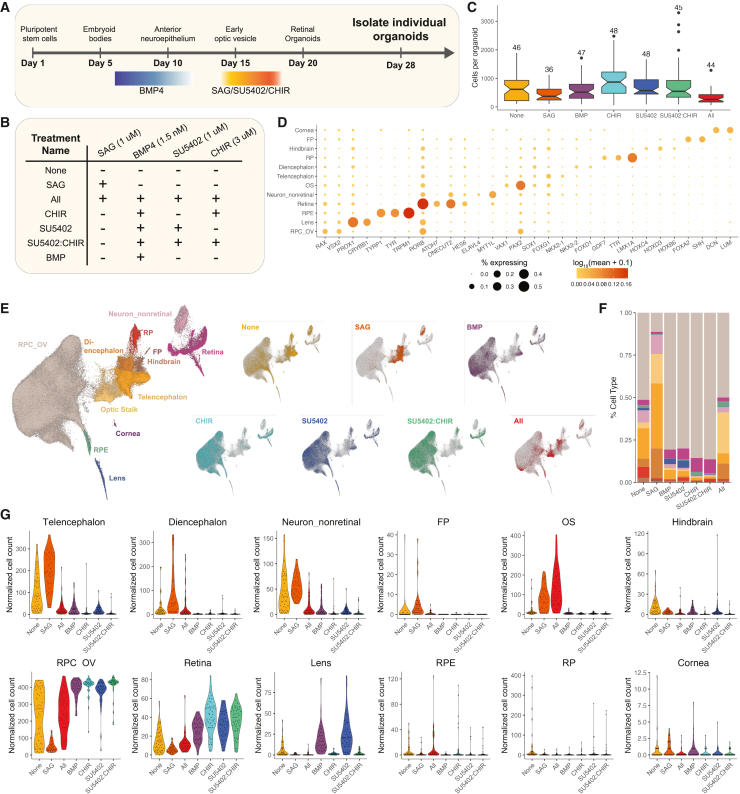
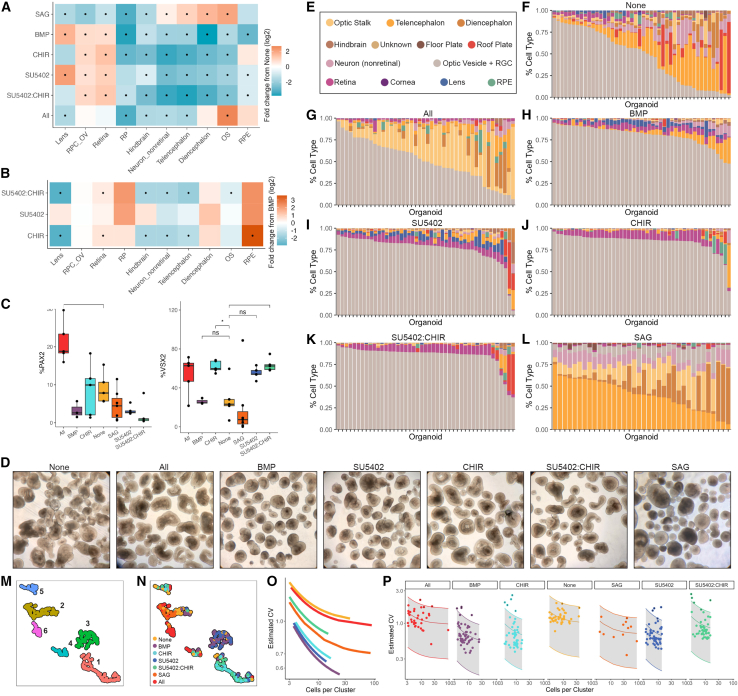
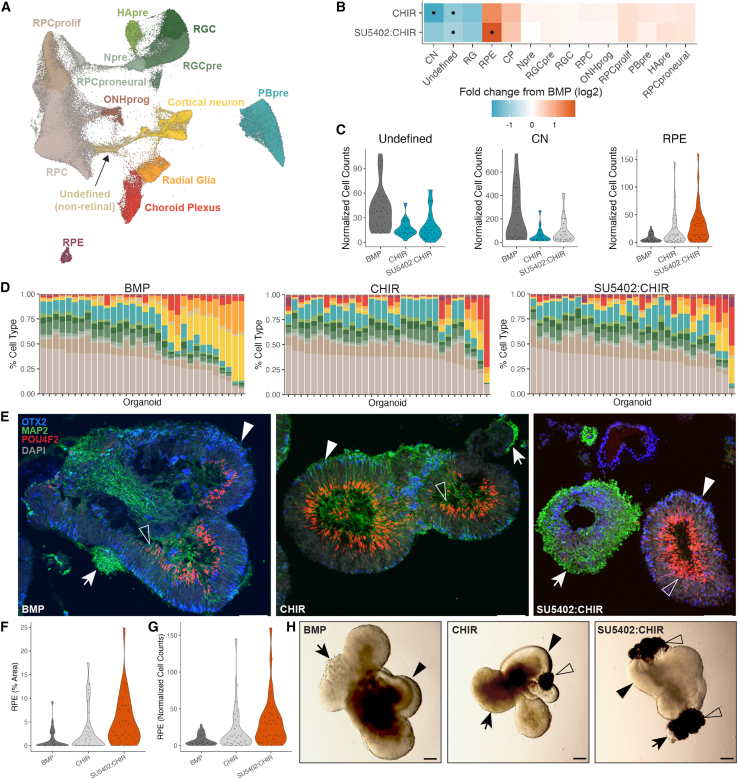
With a critical need for more complete in vitro models of human development and disease, organoids hold immense potential. Their complex cellular composition makes single-cell sequencing of great utility; however, the limitation of current technologies to a handful of treatment conditions restricts their use in screens or studies of organoid heterogeneity. Here, we apply sci-Plex, a single-cell combinatorial indexing (sci)-based RNA sequencing (RNA-seq) multiplexing method to retinal organoids. We demonstrate that sci-Plex and 10× methods produce highly concordant cell-class compositions and then expand sci-Plex to analyze the cell-class composition of 410 organoids upon modulation of critical developmental pathways. Leveraging individual organoid data, we develop a method to measure organoid heterogeneity, and we identify that activation of Wnt signaling early in retinal organoid cultures increases retinal cell classes up to 6 weeks later. Our data show sci-Plex's potential to dramatically scale up the analysis of treatment conditions on relevant human models.

Keywords: cell signaling; neuron; organoids; retina; single-cell sequencing.


Conflict of interest statement

C.T. is a SAB member, consultant, and/or co-founder of Algen Biotechnologies, Altius Therapeutics, and Scale Biosciences. One or more embodiments of one or more patents and patent applications filed by the University of Washington may encompass methods, reagents, and the data disclosed in this manuscript. Some work in this study is related to technology described in patent applications.

Figures

None
Graphical abstract
Figure 1
Figure 1
Comparison between sci-Plex and 10× (A) Retinal organoids were cultured for 29, 78, or 185 days. The cells were split and either processed by a 10× RNA-seq pipeline or prepared by sci-Plex. (B) Integrated UMAP of sci-Plex and 10× datasets. Left: cells colored by cell type. RPC, retinal progenitor cell; MG, Müller glia; Npre, retinal neuronal precursor; RGC, retinal ganglion cell; RGCpre, RGC precursor; HApre, horizontal/amacrine precursor; PBpre, photoreceptor/bipolar precursor. Right: cells are faceted by organoid age and technology. Cells are colored by age. (C) Dot plot of genes used to define cell types in (B). Dot size indicates the percentage of cells that express the gene of interest. Color indicates the log10 mean UMIs per cell. (D) Representation of retinal neuron developmental trajectories. (E) Timeline of retinal cell differentiation in human organoids. (F) Immunostaining of day 28, 63, and 189 organoids for progenitor (VSX2-day 28), RGC (POU4F2), photoreceptor/bipolar (OTX2), neuronal (MAP2), amacrine/horizontal/RGC (HuC/D), bipolar cell (VSX2-day 189), and photoreceptor (RCVRN) markers. Scale bar represents 100 μm. (G) Using the cell-type assignments from (B), cells were counted, and the percentage of cell type was determined for each technology and organoid age.
Figure 2
Figure 2
sci-Plex applied to individual organoids after signaling pathway modulation (A) Overview of the retinal organoid differentiation protocol. (B) A summary of the seven treatments performed. (C) Boxplot of the number of cells recovered per organoid for each treatment. Number above the boxplot indicates the number of individual organoids in which >50 cells were recovered for that treatment. The notch of the boxplots represents the median cells per organoid. The colored region indicates the values from the lower 25th to the upper 75th quartile of cell counts. The whiskers span the range of the cell counts within 1.5× the distance between the 25th–75th percentiles. Points outside of that range are displayed as outliers. (D) Dot plot of the genes used to define cell types for day 28 organoids. Dot size indicates the percentage of cells expressing the gene of interest. Color indicates the log10 mean UMIs per cell. (E) Left: UMAP of the recovered cells with cell-type annotations. Right: for each UMAP, cells from the specified treatment are colored. RPC_OV, retinal progenitor cell/optic vesicle; RPE, retinal pigmented epithelium; OS, optic stalk; RP, roof plate; FP, floor plate. (F) Stacked bar plot with mean cell-type composition of day 28 organoids displayed for each treatment. (G) Violin plots of size-factor-normalized cell counts for each cell type from day 28 organoids. Colored by treatment.
Figure 3
Figure 3
sci-Plex allows the detection of significant changes in cell-type abundance and heterogeneity (A) Heatmap of fold change in cell-type abundance compared to “None” for day 28 organoids. The data was modeled using a beta-binomial distribution and significance was determined by a Wald test. An asterisk (∗) in the center of the box indicates a q value of less than 0.05 after Benjamini-Hochberg correction. (B) Heatmap of fold change in cell-type abundance compared with BMP for day 28 organoids. Statistical analysis was performed as in (A). (C) Quantification of day 27 immunostained organoids. Significance was determined by performing t tests between the treatment of interest and None. Benjamini-Hochberg correction was performed to adjust the p value. p < 0.05. The line of the boxplots represents the median cells per organoid. The colored region indicates the values from the lower 25th to the upper 75th quartile of cell counts. The whiskers span the range of the cell counts within 1.5× the distance between the 25th–75th percentiles. (D) Bright-phase images of organoids the day before sci-Plex (day 27). Scale bars represent 200 μM. (E) Cell-type legend for (F)–(L). (F) Stacked bar plot, each bar represents an individual day 28 organoid exposed to the None treatment. Bars colored by cell-class composition. (G–L) Same as (F) but for (G) All, (H) BMP, (I) SU5402, (J) CHIR, (K) SU5402:CHIR, and (L) SAG. (M) UMAP generated using the size-factor-normalized cell type by organoid matrix generated from day 28 individual organoids. Colored by cluster. (N) UMAP from (M) with the organoids colored by treatment. (O) The mean and coefficient of variation (CV) were modeled for each cluster and each treatment. Displayed are the modeled relationships colored by treatment. (P) Model from (O) faceted by treatment. The shaded area marks the range within 2 standard deviations from the mean. Points represent the individual cluster values.
Figure 4
Figure 4
Day 63 organoids demonstrate continued perturbation by signaling modulation (A) UMAP with cell-type annotations from individually hashed D63 organoids exposed to BMP, CHIR, and SU5402:CHIR treatments. RPCprolif, proliferating RPC; RPCproneural, proneural RPC; ONHprog, optic nerve head progenitor; CN, cortical neuron; RG, radial glia; CP, choroid plexus. (B)Heatmap of fold change in cell-type abundance compared with BMP. The data was modeled using a beta-binomial distribution and significance was determined by a Wald test. An asterisk (∗) in the center of the box indicates a q value of less than 0.05 after Benjamini-Hochberg correction. (C) Violin plots of size-factor-normalized cell counts for day 63 organoids. Dark gray, control treatment in (B); light gray, no significant change; teal, significant decrease in abundance (p < 0.05); orange, significant increase in abundance (p < 0.05). Significance was determined as in (B). (D) Stacked bar plots, each bar represents an individual organoid. Bars are colored by the cell-type composition. Right: cell-type color legend. (E) Immunostaining of cryosectioned day 63 organoids with OTX2 (photoreceptors/RPE/CP, blue), MAP2 (retinal and cortical neurons, green), POU4F2 (RGC, red), and DAPI (gray). Arrow, non-retinal neurons; filled arrowhead, Otx2+ retinal tissue; empty arrowhead, Pou4f2+ retinal tissue. Scale bar represents 100 μm. (F) Violin plots of percentage of area measurements for RPE as calculated from bright-phase microscopy images of day 62 organoids. Paired t tests followed by Bonferroni correction were used to determine significance (p < 0.05). Plots colored as in (C). (G) Violin plots of size-factor-normalized RPE cell counts for day 63 organoids. Paired t tests followed by Bonferroni correction were used to determine significance (p < 0.05). Plots colored as in (C). (H) Representative bright-field images of day 62 organoids from each group quantified in (F) and (G). Arrow, non-retinal tissue; filled arrowhead, retinal tissue; empty arrowhead, RPE. Scale bar represents 200 μm.

Update of

References

    1. Eiraku M., Takata N., Ishibashi H., Kawada M., Sakakura E., Okuda S., Sekiguchi K., Adachi T., Sasai Y. Self-organizing optic-cup morphogenesis in three-dimensional culture. Nature. 2011;472:51–56. - PubMed
    1. Nakano T., Ando S., Takata N., Kawada M., Muguruma K., Sekiguchi K., Saito K., Yonemura S., Eiraku M., Sasai Y. Self-formation of optic cups and storable stratified neural retina from human ESCs. Cell Stem Cell. 2012;10:771–785. - PubMed
    1. Kadoshima T., Sakaguchi H., Nakano T., Soen M., Ando S., Eiraku M., Sasai Y. Self-organization of axial polarity, inside-out layer pattern, and species-specific progenitor dynamics in human ES cell-derived neocortex. Proc. Natl. Acad. Sci. USA. 2013;110:20284–20289. - PMC - PubMed
    1. Lancaster M.A., Renner M., Martin C.-A., Wenzel D., Bicknell L.S., Hurles M.E., Homfray T., Penninger J.M., Jackson A.P., Knoblich J.A. Cerebral organoids model human brain development and microcephaly. Nature. 2013;501:373–379. - PMC - PubMed
    1. Xia Y., Nivet E., Sancho-Martinez I., Gallegos T., Suzuki K., Okamura D., Wu M.-Z., Dubova I., Esteban C.R., Montserrat N., et al. Directed differentiation of human pluripotent cells to ureteric bud kidney progenitor-like cells. Nat. Cell Biol. 2013;15:1507–1515. - PubMed

Publication types