. 2023 Jul 19;3(8):100534.
doi: 10.1016/j.crmeth.2023.100534. eCollection 2023 Aug 28.

Synthetic whole-slide image tile generation with gene expression profile-infused deep generative models

Affiliations

Synthetic whole-slide image tile generation with gene expression profile-infused deep generative models

Francisco Carrillo-Perez et al. Cell Rep Methods. .

Abstract

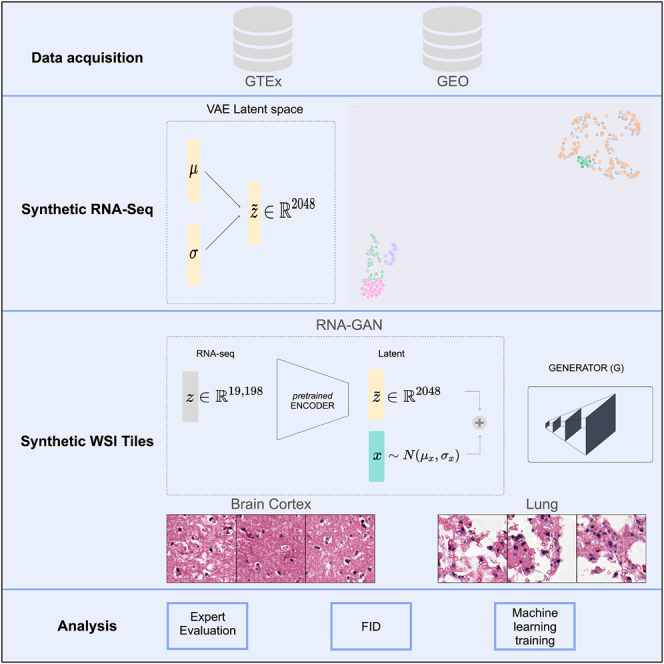
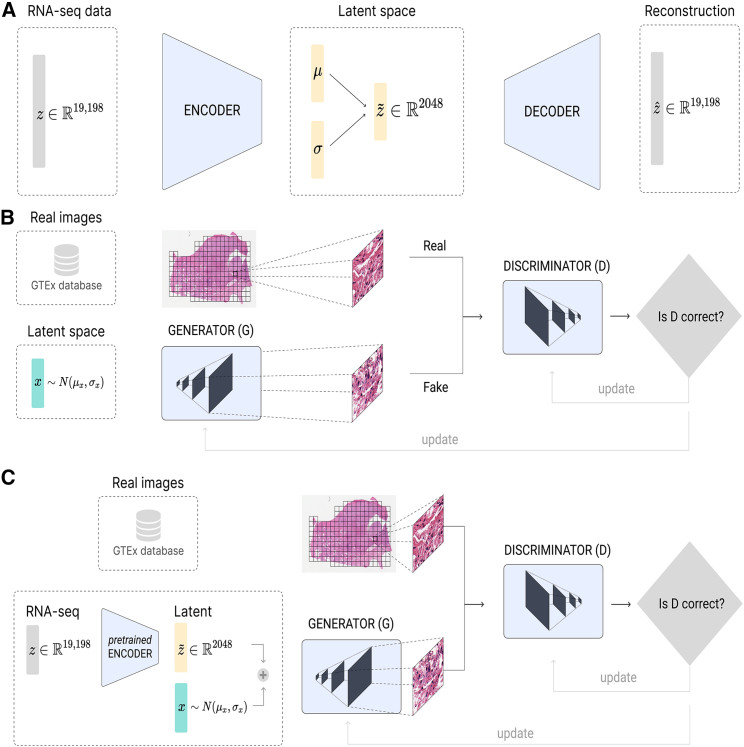
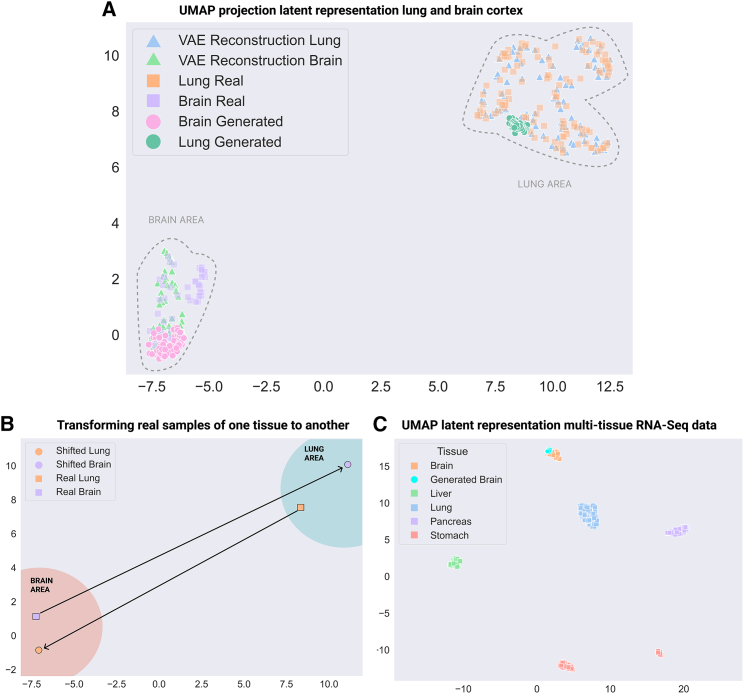
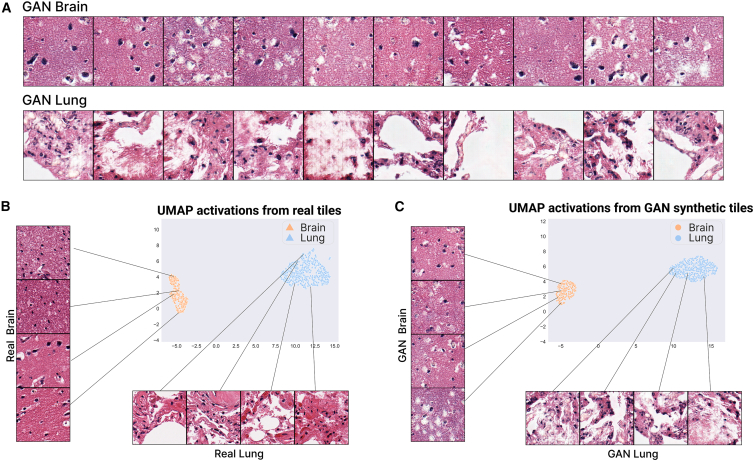
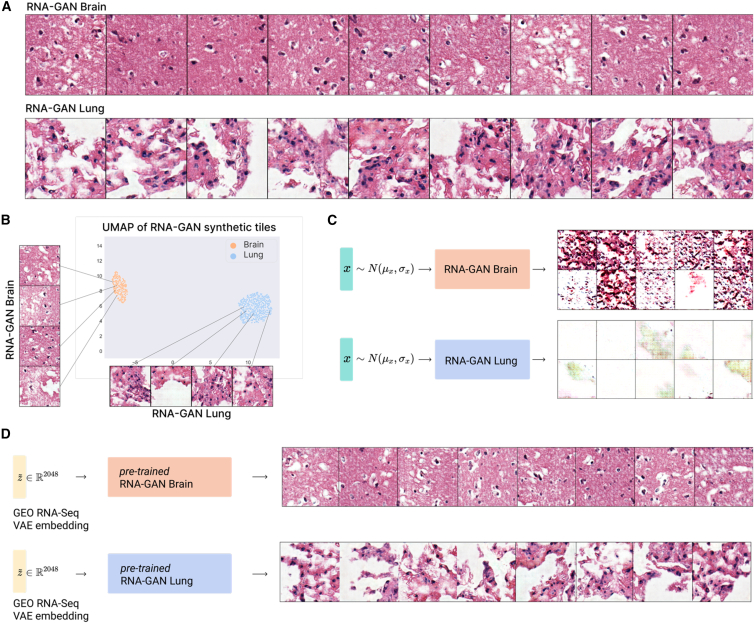
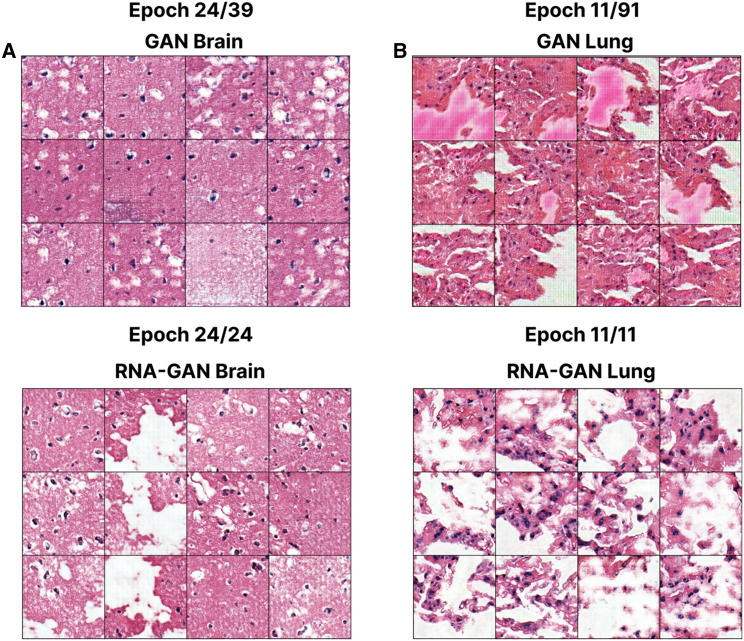
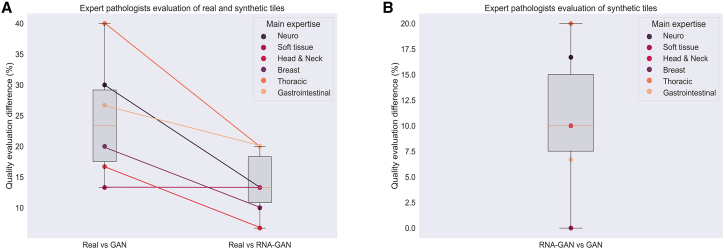
In this work, we propose an approach to generate whole-slide image (WSI) tiles by using deep generative models infused with matched gene expression profiles. First, we train a variational autoencoder (VAE) that learns a latent, lower-dimensional representation of multi-tissue gene expression profiles. Then, we use this representation to infuse generative adversarial networks (GANs) that generate lung and brain cortex tissue tiles, resulting in a new model that we call RNA-GAN. Tiles generated by RNA-GAN were preferred by expert pathologists compared with tiles generated using traditional GANs, and in addition, RNA-GAN needs fewer training epochs to generate high-quality tiles. Finally, RNA-GAN was able to generalize to gene expression profiles outside of the training set, showing imputation capabilities. A web-based quiz is available for users to play a game distinguishing real and synthetic tiles: https://rna-gan.stanford.edu/, and the code for RNA-GAN is available here: https://github.com/gevaertlab/RNA-GAN.

Keywords: artificial intelligence; deep learning; generative adversarial network; generative model; synthetic biomedical data; variational autoencoder.


Conflict of interest statement

The authors declare no competing interests.

Figures

None
Graphical abstract
Figure 1
Figure 1
Model architecture for gene expression, WSIs, and combined data using VAE and GANs (A) β-VAE architecture for the generation of synthetic gene expression data. The model uses as input the expression of 19,198 genes. Both the encoder and the decoder are formed by two linear layers of 6,000 and 4,096, respectively. The latent μ and σ vectors have a feature size of 2,048. (B) GAN architecture for generating tiles by sampling from a random normal distribution. The architecture chosen was a deep convolutional GAN (DCGAN), using as input a feature vector of size 2,048. The final size of the tiles generated is 256 × 256, the same as the size of the real tiles. (C) RNA-GAN architecture where the latent representation of the gene expression is used for generating tiles. The gene expression profile of the patient is used in the β-VAE architecture to obtain the latent representation. Then, a feature vector is sampled from a scaled random normal distribution (values ranging between [−0.3,0.3]) and added to the latent representation. A DCGAN is trained to use this vector as input and generate a 256 × 256 sample. The discriminator receives synthetic and real samples of that size.
Figure 2
Figure 2
UMAP visualization of β-VAE embedding of multi-tissue expression profiles (A) UMAP visualization of the real and reconstructed gene expression profiles of lung and brain cortex healthy tissues. Generated gene expression profiles, by sampling from the latent space and interpolating to the respective tissue, are also plotted. (B) Shifting real gene expression profiles between the two tissues. The latent representation of all the available samples is obtained, and the difference vectors between the cluster centroids are computed. (C) UMAP visualization of real gene expression profiles of multiple tissues and generated one from brain cortex tissue.
Figure 3
Figure 3
A GAN generates realistic lung and brain cortex tiles maintaining the distribution of the real tiles (A) Tiles generated by the GAN model for brain tissue on the top and for lung tissue on the bottom. (B) UMAP representation of the real patients in the lung and brain cortex dataset. (C) UMAP representation of generated tiles using the GAN model. 600 tiles are generated per patient and then used to compute the feature vectors and the UMAP visualization.
Figure 4
Figure 4
A gene expression-infused GAN improves tile quality (A) Tiles generated using the RNA-GAN model for lung and brain cortex healthy tissues. (B) UMAP visualization of the patients by generating tiles using their gene expression. The model preserves the distribution differences between the two tissues. (C) Generated tiles of model trained using only random Gaussian data on a small range ([−0.3,0.3]) does not generate high-quality tiles, showing that the gene expression distribution is essential for synthetic tile generation. (D) Brain cortex and lung tissue tiles generated using an external dataset (GEO: GSE120795), showing the generalization capabilities of the model.
Figure 5
Figure 5
A gene expression profile-infused GAN converges faster: Brain cortex and lung tissue tiles generated at the same epoch during training for the model with and without gene expression profiles The visualized epoch is the last epoch of training for the models using RNA-seq data. (A) Brain cortex generation at training epoch 24 for GAN and RNA-GAN models, with similar performance and quality between the generated tiles; however, less diversity is obtained when not using gene expression profiles. (B) Lung tissue generation at training epoch 11 for both the GAN and RNA-GAN models. A comparison of both models shows noticeable differences in the quality of the generated tiles. The model using gene expression profiles outputs better morphological features and less artifacts and has a higher overall quality.
Figure 6
Figure 6
Expert evaluation of synthetic slides (A) Difference in morphological structure quality of synthetic (generated by GAN and RNA-GAN) and real tissues based on the pathologists’ evaluations. The difference between real tiles and generated tiles was bigger for GAN than for RNA-GAN. (B) Difference in morphological structure quality between the synthetic generated tiles by the GAN and RNA-GAN based on the pathologists’ evaluations. Pathologists evaluated the tiles generated using RNA-GAN better compared with only GAN.

Similar articles

Cited by

References

    1. Hodson R. Precision medicine. Nature. 2016;537:49. doi: 10.1038/537S49a. - DOI - PubMed
    1. König I.R., Fuchs O., Hansen G., von Mutius E., Kopp M.V. What is precision medicine? Eur. Respir. J. 2017;50 doi: 10.1183/13993003.00391-2017. - DOI - PubMed
    1. Hadjadj D., Deshmukh S., Jabado N. Entering the era of precision medicine in pediatric oncology. Nat. Med. 2020;26:1684–1685. doi: 10.1038/s41591-020-1119-6. - DOI - PubMed
    1. Nakagawa H., Fujita M. Whole genome sequencing analysis for cancer genomics and precision medicine. Cancer Sci. 2018;109:513–522. doi: 10.1111/cas.13505. - DOI - PMC - PubMed
    1. Coudray N., Ocampo P.S., Sakellaropoulos T., Narula N., Snuderl M., Fenyö D., Moreira A.L., Razavian N., Tsirigos A. Classification and mutation prediction from non–small cell lung cancer histopathology images using deep learning. Nat. Med. 2018;24:1559–1567. doi: 10.1038/s41591-018-0177-5. - DOI - PMC - PubMed

Publication types

LinkOut - more resources