Cardiomyocyte orientation recovery at micrometer scale reveals long-axis fiber continuum in heart walls
- PMID: 37671467
- PMCID: PMC10548172
- DOI: 10.15252/embj.2022113288
Cardiomyocyte orientation recovery at micrometer scale reveals long-axis fiber continuum in heart walls
Abstract
Coordinated cardiomyocyte contraction drives the mammalian heart to beat and circulate blood. No consensus model of cardiomyocyte geometrical arrangement exists, due to the limited spatial resolution of whole heart imaging methods and the piecemeal nature of studies based on histological sections. By combining microscopy and computer vision, we produced the first-ever three-dimensional cardiomyocyte orientation reconstruction across mouse ventricular walls at the micrometer scale, representing a gain of three orders of magnitude in spatial resolution. We recovered a cardiomyocyte arrangement aligned to the long-axis direction of the outer ventricular walls. This cellular network lies in a thin shell and forms a continuum with longitudinally arranged cardiomyocytes in the inner walls, with a complex geometry at the apex. Our reconstruction methods can be applied at fine spatial scales to further understanding of heart wall electrical function and mechanics, and set the stage for the study of micron-scale fiber remodeling in heart disease.
Keywords: 3D reconstruction; cardiomyocyte geometry; computer vision; fluorescent microscopy; heart wall structure.
© 2023 The Authors. Published under the terms of the CC BY 4.0 license.
Conflict of interest statement
DD, TAS, PSD, KS, and MS declare no competing interests. TFWS is the sole proprietor of Quorumetrix Studio and provided custom scientific data processing and 3D visualization services used in this study.
Figures


- A
A schematic illustration of the CLARITY method. The harvested heart tissues are incubated in a hydrogel/PFA mixture at 4°C for approximately 9 days. Following hydrogel incubation, the solution mixture with the heart tissues is polymerized at 37°C. The heart tissues are then excised from the polymerized hydrogel and shaken at 37°C with a clearing solution until they attain a desirable level of transparency (see Materials and Methods for details).
- B
The clarified heart is sectioned along its short‐ or long‐axis. For the short‐axis, a midventricular region that approximates the PSAX‐PML (parasternal short‐axis—papillary muscle level) plane was chosen. For the long‐axis, a transversal plane that represents the A4C (apical four chambers) plane was used.
- C–E
A comparison of uncleared and cleared heart tissue sections stained with WGA and the alpha‐actinin antibody.
- F
A comparison of 20× (2‐μm isotropic resolution) and 60× (0.663 * 0.663 * 0.79 μm3 x, y, and z resolution, respectively) cleared heart tissue sections stained with WGA. The raw and skeletonized images are shown for each magnification. The visible cell boundaries that are not of cardiomyocytes are marked with arrow heads (red) in the 60× images. The scale bar is 1,000 and 50 μm for the full view and zoomed in regions, respectively, in the WGA uncleared and cleared tissue images. The scale bar for the alpha‐actinin images is 10 μm.
- A
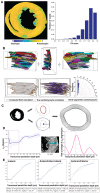
Fractional anisotropy scores are shown using a parula colormap (left) with a value in the range 0–1. The histogram (right) shows the fraction of pixels in each respective FA bin. The majority of the pixels have a high FA score, indicating the presence of dominant local orientations in the tissue stack. The color bar for the FA score is as indicated.
- B
Representative 3D views of hand‐segmented cardiomyocytes with randomly assigned colors to each cell (top panel). A representative 3D view of ground truth orientation (purple) based on the second moment matrix for hand‐segmented myocytes (gray) on the left, with the estimated field orientation from the WGA image (golden yellow) using a structure tensor approach (Materials and Methods) in the middle (bottom panel). The magnitude of the difference between the ground truth and the estimated orientation in degrees is illustrated with a graph on the right. The mean difference between two ground truth and estimated orientations is 5.98° ± 2.3°.
- C
Helix angle calculation: Masking (left) followed by centroid estimation (middle, top); Masking the short‐axis section and estimating the tangent plane and normal for the penetration axis (middle, bottom). The set of penetration directions is shown on the right, from outer to inner wall.
- D
αH plot (left), region of LV wall analyzed (middle) and rate of change of αH calculated over a neighborhood of 15 voxels. The region marked by a dashed box represents the outer wall longitudinal cells, where the rate of change of αH is initially small and then increases sharply as one approaches the middle wall region, after which it plateaus and then increases again.
- E
Line fits for αH plots were calculated for the lateral, antero/infero lateral, and anterior/inferior regions, with the extent of the outer wall longitudinal cells shown by length of the first line in each plot.
- A
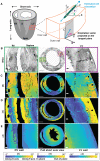
An illustration of the angles measured to represent the cell orientations across the ventricular walls. The red box represents a magnified view of the ventricle wall, with the global axes and labels as indicated: C‐Circumferential L‐Longitudinal R‐Radial. The green cylinder and the blue bidirectional arrow represent the cardiomyocyte and its long‐axis, that is, the estimated cell orientation. Φ is the angle between the projection of the estimated cell orientation onto the XY plane and the estimated cell orientation. θ is the angle between the projection of the estimated cell orientation onto the XY plane and the X‐axis direction. αH, the helix angle is the angle between the projection of the cell orientation onto the plane perpendicular to the transmural penetration direction and the circumferential direction.
- B–E
A magnified view of the right (green rectangle) and the left (magenta rectangle) ventricular regions for a full view of the WGA stain (middle). The |θ|, |Φ|, and αH angles for the mouse SA sections are shown using a parula colormap. The yellow tones for the |θ| angle represent cell orientation along the global Y‐Axis while the blue tones represent cell orientation along the X‐axis. For |Φ|, the blue and yellow tones represent cells with orientations aligned with the short‐axis section, and orthogonal to it, respectively. The colormaps scale with the angles, as indicated. The scale bar for the full view images is 1,000 μm and for the magnified views is 100 μm.

- A
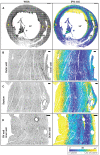
A maximum intensity Z‐projection of the WGA‐stained short‐axis section from different mouse hearts as indicated, shown in grayscale, with the |Φ| and |θ| angles for cell orientations shown using parula colormaps, with the color bars as indicated. The scale bar is 1,000 μm.
- B
A comparison of αH estimates from raw (red line) and denoised short‐axis section image stacks (black line) are shown for comparison. The region of the LV wall analyzed is shown in the bottom left panel, with a zoom in on the first 200 μm on the bottom right. The transmural penetration direction is from the outer to the inner LV wall. The raw data agree with denoised αH estimates in most of the places; however, we observed that estimation was much more consistent and robust to nonuniform illumination changes with denoised data. The intensity between two fields of view (~ 350 μm in transmural penetration depth) and the αH estimates begin to deviate marking the edges.
- A
A short‐axis view of the ventricular chambers of a rat heart, sectioned at PSAX‐PML (parasternal short‐axis—papillary muscle level). A maximum intensity projection of the WGA stain is shown in grayscale, with the |Φ| angle shown using a parula colormap. The scale bar is 1,000 μm.
- B–D
Zoomed in regions from the left ventricle, septum and right ventricle, with the WGA stain shown in grayscale and the |Φ| angle shown using a parula colormap. The scale bars are 1,000 μm 100 μm for (A) and (B–D), respectively. The color bar is as indicated.


- A
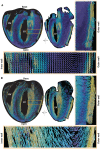
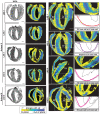
WGA stain.
- B
Colormaps for the magnitude of the angle with the longitudinal axis (L).
- C
Estimated orientations as glyphs.
- D
Estimated orientations as streamlines.
- A, B
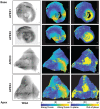
Estimated myofiber orientations are shown as glyphs and streamlines for the mouse LA sections as indicated. In each panel, a 3D visualization of the orientations is shown using either glyphs or streamlines, with a view obtained by rotation in a clockwise direction shown on the right (Materials and Methods). The colors follow a parula colormap, where the blue and yellow tones indicate cell orientations that are in and out of the short‐axis plane, respectively. These visualizations reveal the continuity of cell orientations across the entire long‐axis section, from base to apex.

References
-
- Agger P, Omann C, Laustsen C, Stephenson RS, Anderson RH (2020) Anatomically correct assessment of the orientation of the cardiomyocytes using diffusion tensor imaging. NMR Biomed 33: e4205 - PubMed
-
- Anderson RH, Smerup M, Sanchez‐Quintana D, Loukas M, Lunkenheimer PP (2009) The three‐dimensional arrangement of the myocytes in the ventricular walls. Clin Anat 22: 64–76 - PubMed
Publication types
MeSH terms
Grants and funding
LinkOut - more resources
Full Text Sources
Miscellaneous

