. 2023 Sep 15;136(18):jcs261225.
doi: 10.1242/jcs.261225. Epub 2023 Sep 28.

Live-imaging studies reveal how microclots and the associated inflammatory response enhance cancer cell extravasation

Affiliations

Live-imaging studies reveal how microclots and the associated inflammatory response enhance cancer cell extravasation

Juma Ward et al. J Cell Sci. .

Abstract

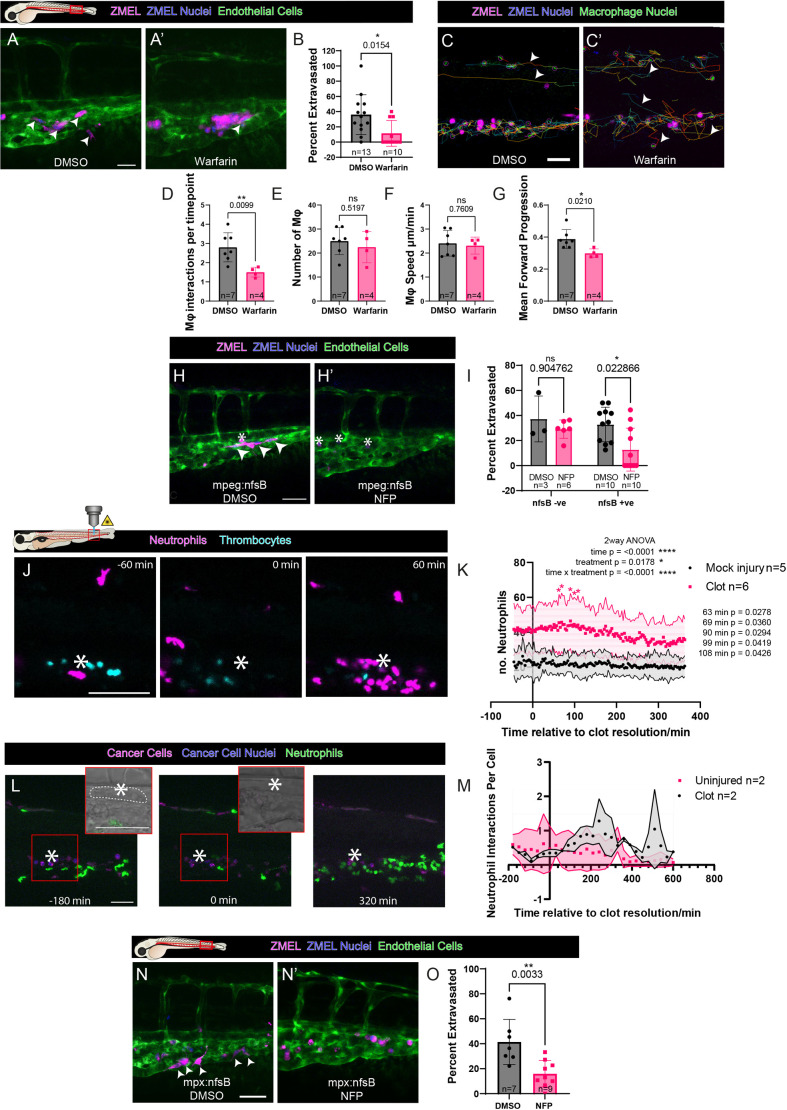
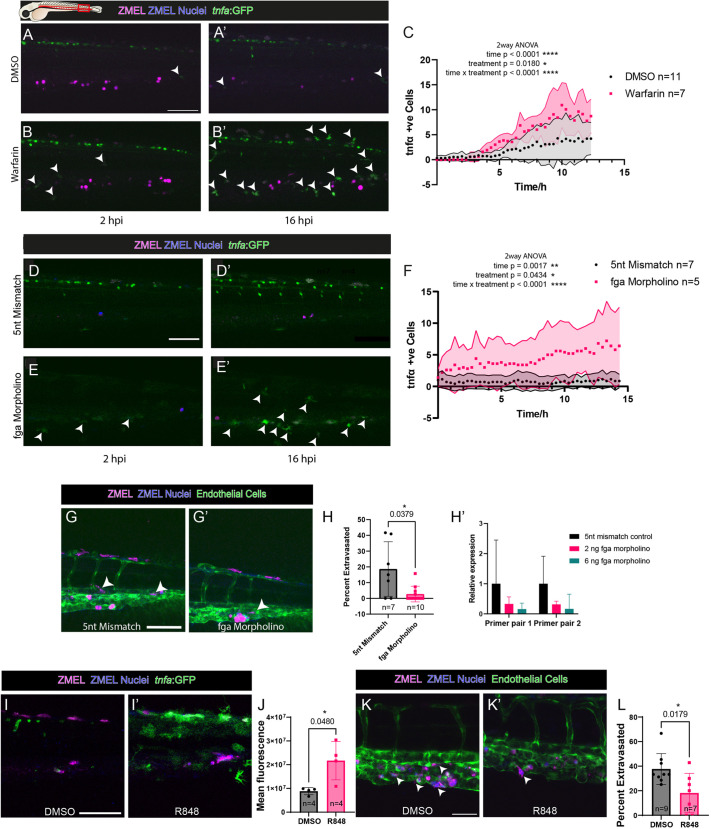
Previous clinical studies and work in mouse models have indicated that platelets and microclots might enable the recruitment of immune cells to the pre-metastatic cancer niche, leading to efficacious extravasation of cancer cells through the vessel wall. Here, we investigated the interaction between platelets, endothelial cells, inflammatory cells, and engrafted human and zebrafish cancer cells by live-imaging studies in translucent zebrafish larvae, and show how clotting (and clot resolution) act as foci and as triggers for extravasation. Fluorescent tagging in each lineage revealed their dynamic behaviour and potential roles in these events, and we tested function by genetic and drug knockdown of the contributing players. Morpholino knockdown of fibrinogen subunit α (fga) and warfarin treatment to inhibit clotting both abrogated extravasation of cancer cells. The inflammatory phenotype appeared fundamental, and we show that forcing a pro-inflammatory, tnfa-positive phenotype is inhibitory to extravasation of cancer cells.

Keywords: Cancer; Coagulation; Inflammation; Zebrafish.


Conflict of interest statement

Competing interests The authors declare no competing or financial interests.

Figures

Fig. 1.
Fig. 1.
Microclot formation at the pre-metastatic niche is essential for cancer cell extravasation. (A) Schematic representation of our zebrafish larval extravasation model. Macrophages and neutrophils interact with grafted cancer cells arrested at the site of a microclot. (B) Still image from a live confocal movie (Movie 1) as a human prostate cancer cell extravasated from an intersegmental vessel of a 2 dpf zebrafish larva. The box indicates the area magnified from the movie shown in C. (C–C″) Time-lapse images of extravasation. White arrowheads indicate invadopodial extensions outside of the vessel and yellow arrowheads indicate pinch points as the cell squeezes through the vessel wall. Dotted lines represent the boundaries of the cell. (D) 3D Imaris rendering of the same cancer cell just after extravasation. (E) Confocal image of zebrafish melanoma (ZMEL) cells within a vessel of a 2 dpf larva. The box indicates the area magnified from Movie 2 shown in F,F′. (F,F′) The same cells as in E at later timepoints. Neutrophils (white asterisks) interact directly with a cancer cell as it extravasates (Movie 2). The nucleus of the extravasating cell is marked with a yellow asterisk. (G,G′) Imaris-rendered projections of the same ZMEL cell just after exiting the vessel (yellow) (Movie 3). (H) Flank of a 2 dpf larvae, injected with FITC-labelled human fibrinogen prior to the grafting of ZMEL cancer cells. Fibres of fibrin(ogen) (arrowheads) form at the surface of cancer cells. (I) Imaris rendering of fibres (arrowheads) on the surface of cancer cells. (J,J′) Formation of a laser-induced clot (dashed line) within the dorsal aorta of a 3 dpf zebrafish larva. Arrowheads indicate mature thrombocytes. (K) Human cancer cells interacting with activated thrombocytes of a microclot. (L) Imaris rendering of the boxed area in K to reveal intimate cancer cell–thrombocyte interactions. Arrowheads in K,L indicate activated thrombocytes. (M) At a microclot (dashed line), macrophages (arrowheads) interact with ZMEL cancer cells (asterisks). (N) Quantification of macrophage (Mϕ) interactions with cancer cells in the presence or absence of a microclot (two-tailed unpaired Student's t-test, two independent repeats). Data show the mean±s.d. Images are representative of ≥3 independent experiments. Scale bars: 50 µm.
Fig. 2.
Fig. 2.
CLEM views of cancer cells interacting closely with host innate immune cells and vasculature of the pre-metastatic niche. (A) View of human prostate cancer cells (magenta) post injection into the vasculature (green) of a 3 dpf larval zebrafish. The box indicates the higher-magnification image shown in B. (B) Overlay of light microscopy and transmission electron microscopy (TEM) images of this region. The red box in B indicates the higher-magnification image shown in C. (C,C′) Direct interactions between a macrophage (Mϕ, cyan) and a cancer cell (PC3, magenta), including interdigitation (arrowheads, C′) between the membranes of these cells. RBC, red blood cell. (D) TEM image of a human cancer cell (PC3, magenta) interacting closely with a zebrafish thrombocyte (T, green). (D′) Higher-magnification image of the same cancer cell shown in D, 5 µm deeper. The inset shows close membrane contacts with possible membrane exchange (arrowheads). (E,E′) Schematic of cancer cell integration into the larval vasculature. (F,F′) Fluorescence (F) and brightfield (F′) still images from a time-lapse movie of a human cancer cell (magenta) integrating into a vessel (green) (Movie 4). The dashed line indicates the cancer lumen. (G–G″) Multi- and split-channel still images from the same time-lapse. (H) Imaris rendering of the same cancer cell undergoing vascular integration. Arrowheads in G,G′,H indicate cancer cell extensions into the vasculature. White asterisks in F–H indicate vessel-associated macrophages, whereas yellow asterisks indicate blood cells within the lumen. Images are representative of ≥3 independent experiments (A–D′), and a single experiment (F–H). Scale bars: 500 µm (A); 10 µm (C,C′); 2.5 µm (C′ inset); 5 µm (D,D′); 50 µm (F–H).
Fig. 3.
Fig. 3.
Microclot association with cancer cells leads to innate immune cell recruitment and aids extravasation. (A,A′) Confocal microscopy flank view of control versus warfarin-treated 3 dpf larvae injected with ZMEL cancer cells. Arrowheads indicate cancer cells that have exited vessels. (B) Quantification of the percentage of cancer cells that have extravasated tail vessels in control versus warfarin-treated larvae (Mann–Whitney U-test). (C,C′) Tracks of macrophage movements in zebrafish larvae injected with ZMEL cancer cells over a 14 h period. Arrowheads indicate macrophage tracks that are not local to cancer cells. (D–G) Quantification of macrophage interactions with individual cancer cells (D), total macrophages detected (E), macrophage speed (F) and macrophage directionality (G) in control versus warfarin-treated larvae (two-tailed unpaired t-tests). (H,H′) Confocal images of macrophages expressing NfsB in control versus nifurpirinol (NFP)-treated larvae after intravascular injection of ZMEL cancer cells. Extravasated cancer cells are marked with arrowheads; intravascular cells are marked with asterisks. (I) Percentage of cancer cells extravasated in the tail regions of NfsB+ or NfsB larvae after treatment with NFP (multiple Mann–Whitney U-tests with Holm–Šídák corrections). (J) Still images from a time-lapse movie of neutrophil recruitment to the site of a laser-induced clot, extending until after the clot has resolved (Movie 5). Asterisks indicate the location of the laser injury. (K) The number of neutrophils at various timepoints and two-way ANOVA analysis. The timepoint 0 is standardised to the time of clot resolution. Asterisks indicate significance using post hoc Šídák's multiple comparisons test between treatment groups. (L) Time-course imaging of neutrophils recruited to ZMEL cancer cells captured at the site of a laser-induced microclot (white dashed line). Insets show brightfield images of the boxed regions. Asterisks indicate the location of the laser injury. (M) Quantification of number of neutrophils interacting with cancer cells captured within a microclot over time (representative of a single experiment). Shaded areas in K,M represent s.d. (N,N′) Representative images of NFP-treated larvae with NfsB-expressing neutrophils after injection of ZMEL cancer cells (magenta with blue nuclei). Arrowheads indicate extravasated cancer cells. (O) Percentage of cancer cells extravasated after neutrophil ablation (two-tailed unpaired t-test). Data show the mean±s.d. and are representative of ≥3 independent repeats, unless otherwise stated. Scale bars: 50 µm. ns, not significant.
Fig. 4.
Fig. 4.
Loss of fibrin drives a switch to a pro-inflammatory macrophage phenotype, which inhibits extravasation. (A–B′) Confocal imaging of the larval flank to show recruitment of tnfa-positive macrophages (green, arrowheads) after intravascular injection of ZMEL cancer cells treated with either warfarin or DMSO. (C) Change in numbers of tnfa-positive cells over time (two-way ANOVA). (D–E′) Confocal imaging to reveal tnfa-positive macrophages (green, arrowheads) within the tails of fga morpholino-treated 2 dpf larvae injected with ZMEL cancer cells. (F) Change in numbers of tnfa-positive cells over time (two-way ANOVA). Shaded areas in C,F represent s.d. (G,G′) Confocal images of control (G) and active morpholino-treated (G′) larvae after injection of cancer cells. Arrowheads indicate extravasated cancer cells. (H) Quantification of the percentage of cancer cells extravasated after morpholino treatment (Mann–Whitney U-test). (H′) qPCR quantification showing loss of the fga transcript with morpholino treatment, representative of three technical repeats from a single experiment. (I,I′) Representative images of tnfa-positive cells (green) in ZMEL cancer cells injected in resiquimod (R848)-treated larvae. (J) Quantification of tnfa expression levels in control versus R848-treated larvae (two-tailed unpaired t-test), representative of two independent repeats. (K,K′) Representative images of ZMEL cancer cells within (arrowheads, K) and extravasated from (arrowhead, K′) the vasculature of 3 dpf larvae 24 hpi after R848 treatment. (L) Percentage of extravasated cancer cells seen in the tails of R848-treated larvae (Mann–Whitney U-test). Data show the mean±s.d. and are representative of ≥3 independent repeats, unless otherwise stated. Scale bars: 100 µm (A,D,G,I); 50 µm (K).

Similar articles

Cited by

References

    1. Anfray, C., Mainini, F., Digifico, E., Maeda, A., Sironi, M., Erreni, M., Anselmo, A., Ummarino, A., Gandoy, S., Expósito, F.et al. (2021). Intratumoral combination therapy with poly(I:C) and resiquimod synergistically triggers tumor-associated macrophages for effective systemic antitumoral immunity. J. Immunother. Cancer 9, e002408. 10.1136/jitc-2021-002408 - DOI - PMC - PubMed
    1. Anvari, S., Osei, E. and Maftoon, N. (2021). Interactions of platelets with circulating tumor cells contribute to cancer metastasis. Sci. Rep. 11, 15477. 10.1038/s41598-021-94735-y - DOI - PMC - PubMed
    1. Bernut, A., Dupont, C., Ogryzko, N. V., Neyret, A., Herrmann, J.-L., Floto, R. A., Renshaw, S. A. and Kremer, L. (2019). CFTR protects against Mycobacterium abscessus infection by fine-tuning host oxidative defenses. Cell Rep. 26, 1828-1840.e1824. 10.1016/j.celrep.2019.01.071 - DOI - PubMed
    1. Best, M. G., Sol, N., In ‘t Veld, S. G. J. G., Vancura, A., Muller, M., Niemeijer, A.-L. N., Fejes, A. V., Tjon Kon Fat, L.-A., Huis In ‘t Veld, A. E., Leurs, C.et al. (2017). Swarm intelligence-enhanced detection of non-small-cell lung cancer using tumor-educated platelets. Cancer Cell 32, 238-252.e239. 10.1016/j.ccell.2017.07.004 - DOI - PMC - PubMed
    1. Borrego, I., Frobert, A., Ajalbert, G., Valentin, J., Kaltenrieder, C., Fellay, B., Stumpe, M., Cook, S., Dengjel, J. and Giraud, M.-N. (2022). Fibrin, bone marrow cells and macrophages interactively modulate cardiomyoblast fate. Biomedicines 10, 527. 10.3390/biomedicines10030527 - DOI - PMC - PubMed

Publication types