. 2023 Oct;14(5):2335-2349.
doi: 10.1002/jcsm.13320. Epub 2023 Sep 6.

Radiation induces long-term muscle fibrosis and promotes a fibrotic phenotype in fibro-adipogenic progenitors

Affiliations

Radiation induces long-term muscle fibrosis and promotes a fibrotic phenotype in fibro-adipogenic progenitors

Nicolas Collao et al. J Cachexia Sarcopenia Muscle. 2023 Oct.

Abstract

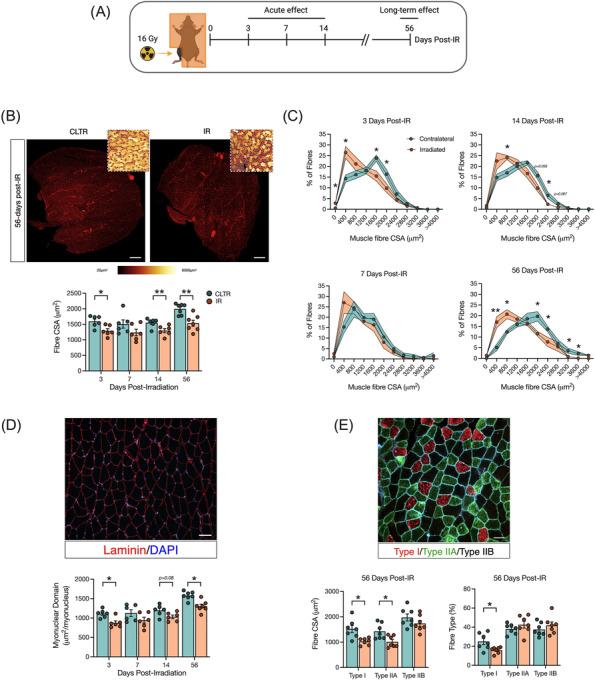
Background: Radiation-induced muscle pathology, characterized by muscle atrophy and fibrotic tissue accumulation, is the most common debilitating late effect of therapeutic radiation exposure particularly in juvenile cancer survivors. In healthy muscle, fibro/adipogenic progenitors (FAPs) are required for muscle maintenance and regeneration, while in muscle pathology FAPs are precursors for exacerbated extracellular matrix deposition. However, the role of FAPs in radiation-induced muscle pathology has not previously been explored.

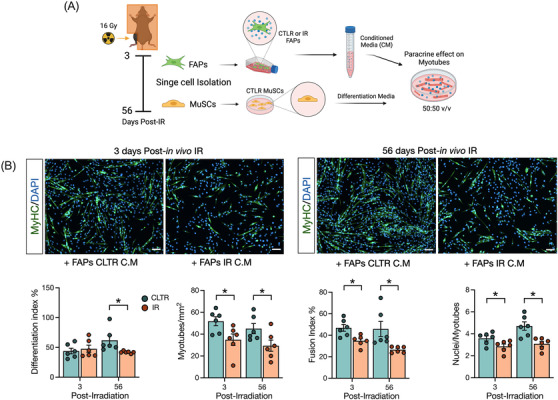
Methods: Four-week-old Male CBA or C57Bl/6J mice received a single dose (16 Gy) of irradiation (IR) to a single hindlimb with the shielded contralateral limb (CLTR) serving as a non-IR control. Mice were sacrificed 3, 7, 14 (acute IR response), and 56 days post-IR (long-term IR response). Changes in skeletal muscle morphology, myofibre composition, muscle niche cellular dynamics, DNA damage, proliferation, mitochondrial respiration, and metabolism and changes in progenitor cell fate where assessed.

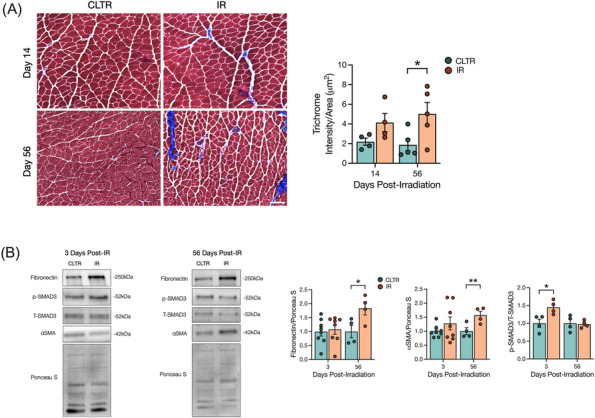
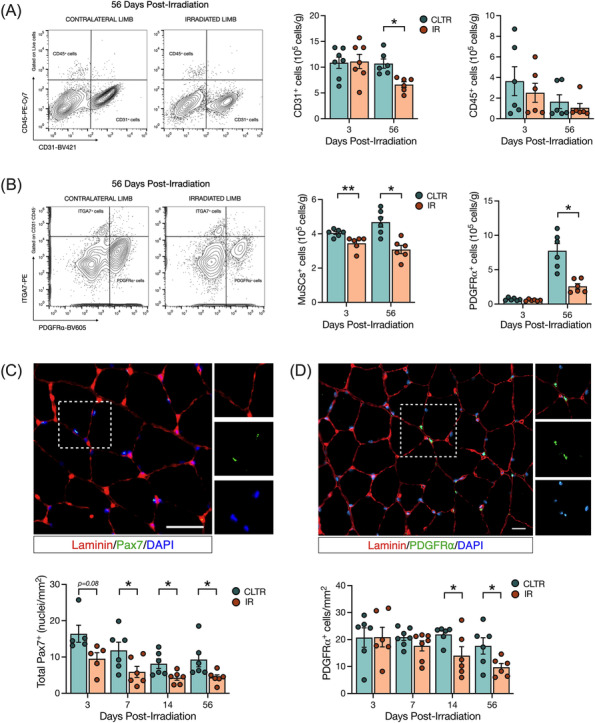
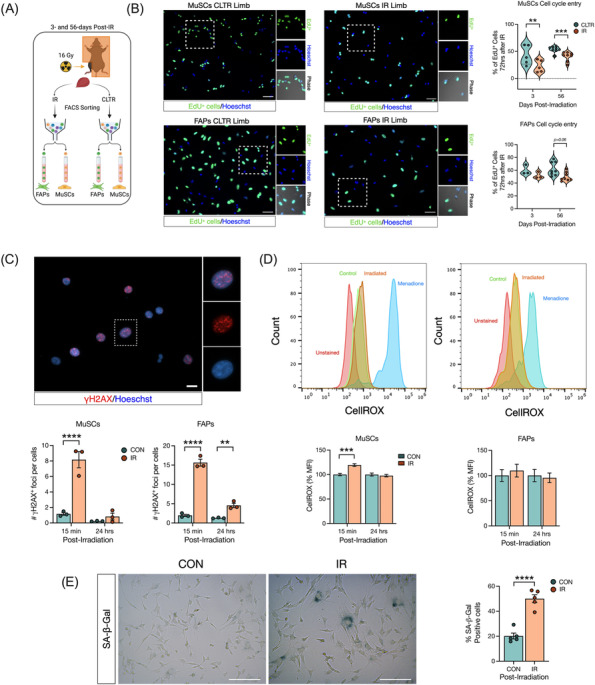
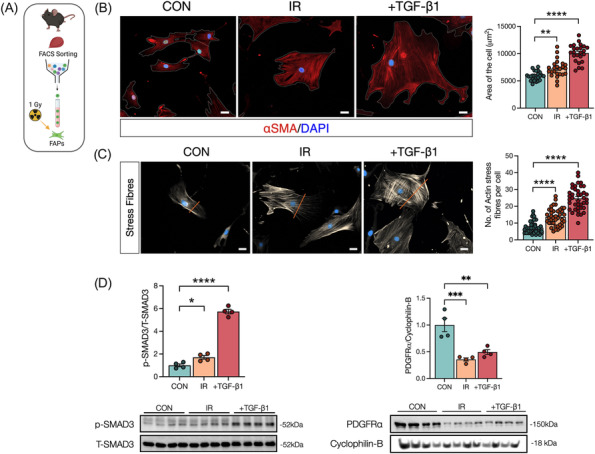
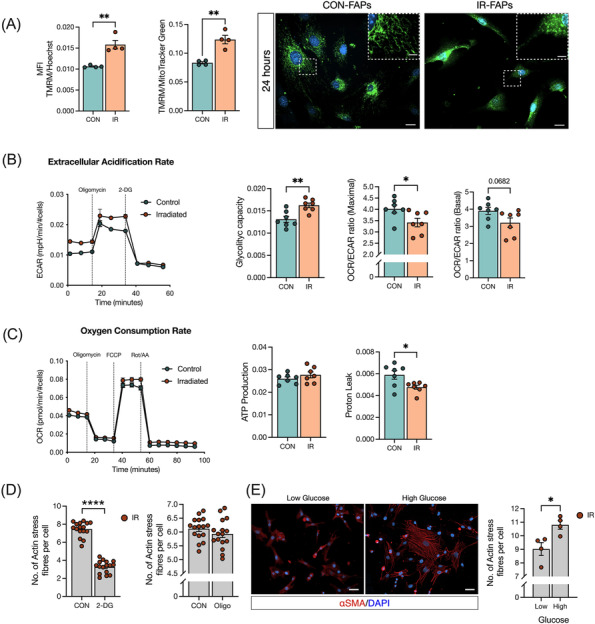
Results: Juvenile radiation exposure resulted in smaller myofibre cross-sectional area, particularly in type I and IIA myofibres (P < 0.05) and reduced the proportion of type I myofibres (P < 0.05). Skeletal muscle fibrosis (P < 0.05) was evident at 56 days post-IR. The IR-limb had fewer endothelial cells (P < 0.05) and fibro-adipogenic progenitors (FAPs) (P < 0.05) at 56 days post-IR. Fewer muscle satellite (stem) cells were detected at 3 and 56 days in the IR-limb (P < 0.05). IR induced FAP senescence (P < 0.05), increased their fibrogenic differentiation (P < 0.01), and promoted their glycolytic metabolism. Further, IR altered the FAP secretome in a manner that impaired muscle satellite (stem) cell differentiation (P < 0.05) and fusion (P < 0.05).

Conclusions: Our study suggests that following juvenile radiation exposure, FAPs contribute to long-term skeletal muscle atrophy and fibrosis. These findings provide rationale for investigating FAP-targeted therapies to ameliorate the negative late effects of radiation exposure in skeletal muscle.

Keywords: Atrophy; Differentiation; Extracellular matrix; Mesenchymal progenitors; Metabolism; Myofibroblast; Skeletal muscle.


Conflict of interest statement

The authors declare no competing interests.

Figures

Figure 1
Figure 1
Radiation induces muscle atrophy particularly in oxidative fibres. (A) Experimental design. (B) Gas/sol muscle complex CSA at 56 days post‐IR, laminin staining (red), colour‐coded CSA to visualize changes in myofibre size (insert). Scale bar: 500 μm, and fibre CSA (μm2). (C) Muscle fibre distribution at 3, 7, 14, and 56 days post‐IR. (D) Myonuclear domain, and representative image of CSA: Laminin (red), DAPI (blue). Scale bar 100 μm. (E) Representative image of myosin heavy chain (MyHC) staining, type I fibres (red), type IIA (green), type IIB (black) at 56 days post‐IR, fibre type CSA and % of muscle fibre type at 56 days post‐IR. *P < 0.05, **P < 0.01; paired Student's t‐test between CLTR and IR at each timepoint (n = 6–7).
Figure 2
Figure 2
Radiation increases long‐term muscle fibrosis independent of sustained p‐SMAD3 signalling. (A) Representative image of Masson trichrome stain of muscle cryosections, and quantification of trichrome intensity per area of ROI. (B) Representative western blots of fibronectin, p‐SMAD3, t‐SMAD3, αSMA, and Ponceau S at 3 and 56 days post‐IR. Quantification of fibronectin, αSMA, and p‐SMAD3 protein expression. Scale bar: 200 μm (A). *P < 0.05, **P < 0.01; paired Student's t‐test between CLTR and IR at each timepoint (n = 4–8).
Figure 3
Figure 3
Radiation depletes endothelial cells, MuSCs, and FAPs long term. (A) Representative flow cytometry plots of CD31+ and CD45+ cells at 56 days post‐IR from CLTR and IR limb. CD31+ and CD45+ cells per grams of muscle. (B) Representative flow cytometry plots of ITGA7+ and PDGFRα+ cells at 56 days post‐IR from CLTR and IR limb. ITGA7+ and PDGFRα+ cells per grams of muscle. (C) Representative image of Pax7+ cells (green), laminin (red), and DAPI (blue). Scale bar: 20 μm. Total Pax7+ cells per mm2. (D) Representative image of PDGFRα+ cells (green), laminin (red) and DAPI (blue). PDGFRα cells per mm2. *P < 0.05, **P < 0.01; paired Student's t‐test between CLTR and IR at each timepoint (n = 5–8).
Figure 4
Figure 4
Radiation inhibits myoblast and FAP proliferation long‐term and induces acute DNA damage. (A) Experimental design. (B) Representative image of EdU+ MuSCs and FAPs from CLTR and IR limb from 56 days post‐in vivo‐IR. Percentage of EdU+ MuSCs and FAPs 72 h after in vivo‐IR. (C) Representative image of yH2AX+ foci per cell, and number of yH2AX+ foci in MuSCs and FAPs 15 min and 24 h post‐in vitro‐IR. (D) Representative flow cytometry histogram of CellROX fluorescence in MuSCs, and FAPs after in vitro‐IR. Quantification of CellROX mean fluorescence intensity (MFI) as a % of MuSCs, and FAPs 15 min and 24 h post‐in vitro‐IR. (E) Representative image of SA‐β‐Gal staining and %of SA‐β‐Gal+ cells. **P < 0.01, ***P < 0.001, ****P < 0.0001. Paired (B) and unpaired (C–E) Student's t‐test (n = 3–5).
Figure 5
Figure 5
Radiation promotes fibrotic differentiation in fibro‐adipogenic progenitors. (A) Experimental design. (B) Representative image of FAPs 72 h post‐in vitro‐IR. Control, irradiated and TGF‐β1 (used as a positive control). αSMA (red), DAPI (blue). Scale bar: 20 μm. Average of cell area (μm2). (C) Representative image of FAPs 72 h post‐in vitro‐IR. αSMA (grey) staining to visualize stress fibres formation. Scale bar: 20 μm. Quantification of actin stress fibres per cell. (D) Quantification and representative western blots of FAPs after 72 h post‐in vitro‐IR showing, p‐SMAD3, T‐SMAD3, PDGFRα, and cyclophilin‐B. *P < 0.05, **P < 0.01, ****P < 0.0001. Unpaired Student's t‐test (n = 4).
Figure 6
Figure 6
Radiation induces a metabolic shift in FAPs to favour glycolysis and inhibiting glycolysis prevents myofibroblast differentiation. (A) TMRM fluorescence intensity and TMRM fluorescence intensity normalized by mitochondrial mass (MitoTracker Green) from FAPs followed 24 h post‐in vitro‐IR. Representative image of MitoTracker Green staining 24 h post‐in vitro‐IR showing elongated and fractionated mitochondria. Scale bar: 20 μm; scale bar zoom in: 2 μm. (B) Extracellular acidification rate (ECAR), glycolytic capacity, OCR/ECAR ratio at maximal respiration, and OCR/ECAR ratio at basal respiration. (C) Oxygen consumption rate (OCR), ATP production, and proton leak. (D) Number of actin stress fibre from 24 h post‐in vitro‐IR on C3H/10T1/2 cells treated with 2‐DG or oligomycin. (E) Representative image of αSMA+ cells and number actin stress fibre followed low or high glucose treatment on C3H/10T1/2 cells. Scale bar: 50 μm. *P < 0.05, **P < 0.01, ****P < 0.0001. Unpaired Student's t‐test (n = 3–7).
Figure 7
Figure 7
Radiation alters FAPs secretome to inhibit myoblast differentiation and fusion. (A) Experimental design. (B) Representative image on MyHC staining. MyHC (green), and DAPI (blue). Quantification of differentiation index, myotube per mm2, fusion index and nuclei per myotubes. Scale bar: 100 μm. *P < 0.05. Unpaired Student's t‐test (n = 6).

References

    1. Canadian Cancer Society's Advisory Committee on Cancer Statistics . Canadian Cancer Statistics (2015).
    1. Miller KD, Nogueira L, Mariotto AB, Rowland JH, Yabroff KR, Alfano CM, et al. Cancer treatment and survivorship statistics, 2019. CA Cancer J Clin 2019;69:363–385. - PubMed
    1. Bachman JF, Klose A, Liu W, Paris ND, Blanc RS, Schmalz M, et al. Prepubertal skeletal muscle growth requires Pax7‐expressing satellite cell‐derived myonuclear contribution. Development 2018;145:dev167197. - PMC - PubMed
    1. Bachman JF, Blanc RS, Paris ND, Kallenbach JG, Johnston CJ, Hernady E, et al. Radiation‐induced damage to prepubertal Pax7+ skeletal muscle stem cells drives lifelong deficits in myofiber size and nuclear number. iScience 2020;23:101760. - PMC - PubMed
    1. Rosenblatt JD, Parry DJ. Gamma irradiation prevents compensatory hypertrophy of overloaded mouse extensor digitorum longus muscle. J Appl Physiol 1985;1992:2538–2543. - PubMed