. 2023 Sep 2;39(9):btad545.
doi: 10.1093/bioinformatics/btad545.

Automated machine learning for genome wide association studies

Affiliations

Automated machine learning for genome wide association studies

Kleanthi Lakiotaki et al. Bioinformatics. .

Abstract

Motivation: Genome-wide association studies (GWAS) present several computational and statistical challenges for their data analysis, including knowledge discovery, interpretability, and translation to clinical practice.

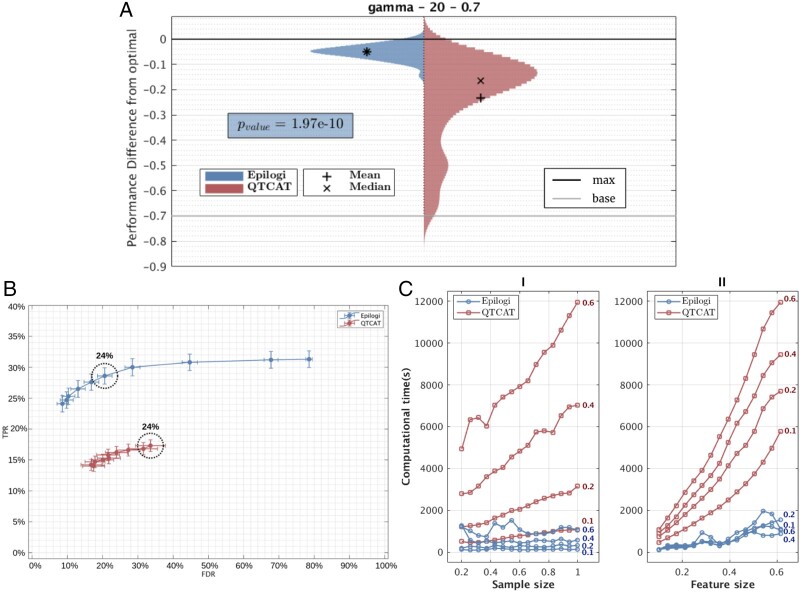
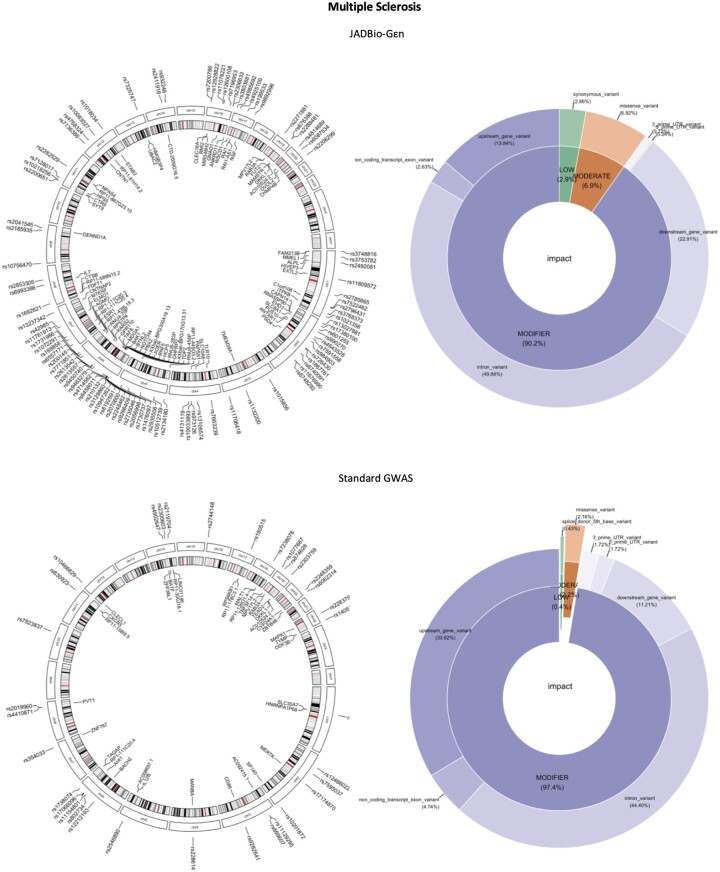
Results: We develop, apply, and comparatively evaluate an automated machine learning (AutoML) approach, customized for genomic data that delivers reliable predictive and diagnostic models, the set of genetic variants that are important for predictions (called a biosignature), and an estimate of the out-of-sample predictive power. This AutoML approach discovers variants with higher predictive performance compared to standard GWAS methods, computes an individual risk prediction score, generalizes to new, unseen data, is shown to better differentiate causal variants from other highly correlated variants, and enhances knowledge discovery and interpretability by reporting multiple equivalent biosignatures.

Availability and implementation: Code for this study is available at: https://github.com/mensxmachina/autoML-GWAS. JADBio offers a free version at: https://jadbio.com/sign-up/. SNP data can be downloaded from the EGA repository (https://ega-archive.org/). PRS data are found at: https://www.aicrowd.com/challenges/opensnp-height-prediction. Simulation data to study population structure can be found at: https://easygwas.ethz.ch/data/public/dataset/view/1/.


Conflict of interest statement

I.T., P.C., Z.P., S.F., and V.L. are or were directly or indirectly affiliated with Gnosis Data Analysis that offers the JADBio service commercially.

Figures

Figure 1.
Figure 1.
Comparison between εpilogi and GTCAT. (A) Distribution of differences of performances of the best models using signatures selected by εpilogi (left) and QTCAT (right) from the theoretical optimal model. The horizontal line base is the difference with the baseline model that always predicts the mean value of the outcome, and line max is the maximum difference from the optimal that can be achieved. The P-value of a t-test comparing the means of the distributions is shown. εpilogi discovers signatures that are statistically significantly more predictive than QTCAT. (B) Average True Positive Rate (TPR) and False Discovery Rate (FDR) of causal variants identification across 10 P-value thresholds for QTCAT and εpilogi. The threshold most frequently selected by JADBio when optimizing model performance is circled in dotted line, while the percentage of selection lies right above. εpilogi dominates QTCAT in both TPR and FDR. The threshold that most frequently optimizes performance achieves a balance between TPR and FDR, which is not true for QTCAT, while circle radius is inversely proportional to this frequency. (C) Computational time comparison between QTCAT and εpilogi. Left plot shows computational time for each feature selection method, as a function of relative sample size (100% corresponds to 1307 samples) for four different relative feature sizes (100% corresponds to 214 051 SNPs). The plot on the right shows computational time as a function of relative feature size for four different relative sample sizes. εpilogi scales better with both increasing sample size and feature size.
Figure 2.
Figure 2.
Genomic view of the variants and genes associated with multiple sclerosis (left) and their impact on protein function (right). Top left: Variants and genes discovered by JADBio- Gεn. Many variants lie in chromosome 6, the majority of which lies in the MHC which was the first susceptibility locus related to multiple sclerosis. Bottom left: Variants and genes discovered by the published study. JADBio-Gεn discovers more low or moderate impact SNPs than the original study and also a higher percentage of missense (6.9% versus 2.16%) variants (top and bottom right).
Figure 3.
Figure 3.
Chromosomal distribution and consequences of variants associated with height as detected by JADBio-Gεn. The left column shows the percentage of SNPs found to be associated with height in each chromosome. The most representative consequences of height variants include intronic variants (42%—light blue) or variants that are located in intergenic regions (32%—red), between genes.

Similar articles

Cited by

References

    1. Adamou M, Antoniou G, Greasidou E. et al. Toward automatic risk assessment to support suicide prevention. Crisis 2019;40:249–56. - PubMed
    1. Agrapetidou A, Charonyktakis P, Gogas P. et al. An AutoML application to forecasting bank failures. Appl Econ Lett 2021;28:5–9.
    1. Batsakis S, Adamou M, Tachmazidis I. et al. Data-driven decision support for autism diagnosis using machine learning. Digital 2022;2:224.
    1. Borboudakis G, Stergiannakos T, Frysali M. et al. Chemically intuited, large-scale screening of MOFs by machine learning techniques. npj Comput Mater 2017;3:40.
    1. Bowler S, Papoutsoglou G, Karanikas A. et al. A machine learning approach utilizing DNA methylation as an accurate classifier of COVID-19 disease severity. Sci Rep 2022;12:17480. - PMC - PubMed

Publication types