. 2023 Oct 23;8(11):1537-1555.
doi: 10.1039/d3nh00258f.

Neuronal maturation-dependent nano-neuro interaction and modulation

Affiliations

Neuronal maturation-dependent nano-neuro interaction and modulation

Prashant Gupta et al. Nanoscale Horiz. .

Abstract

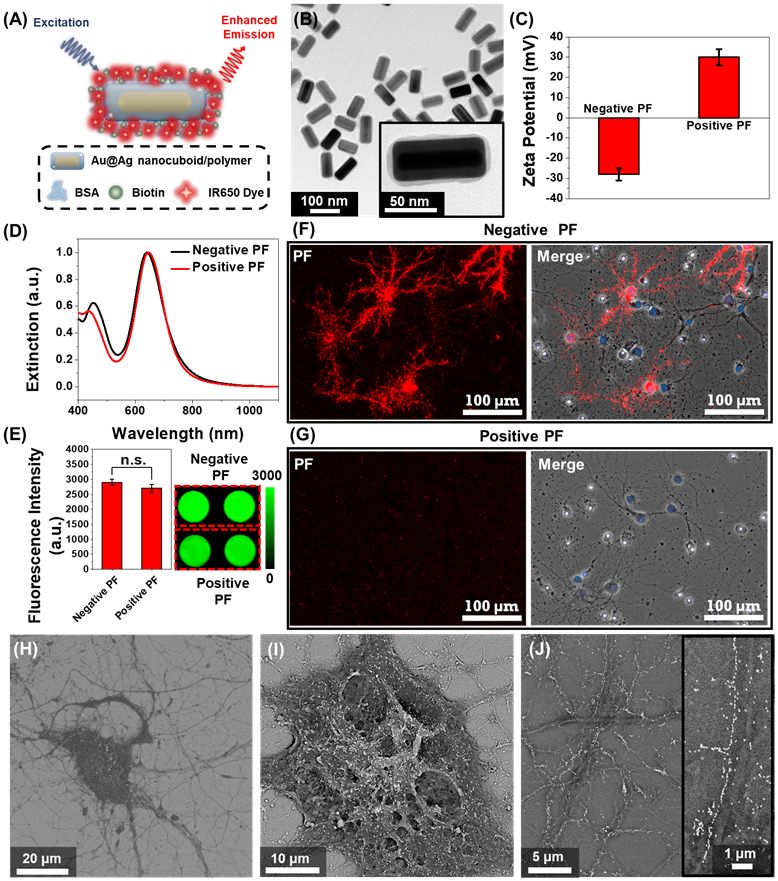
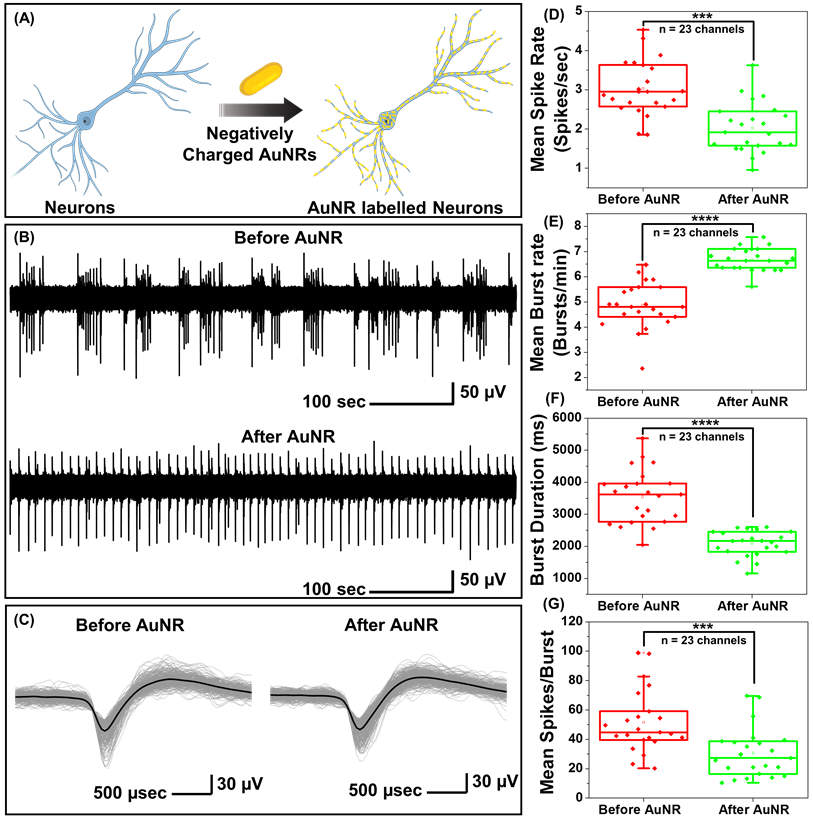
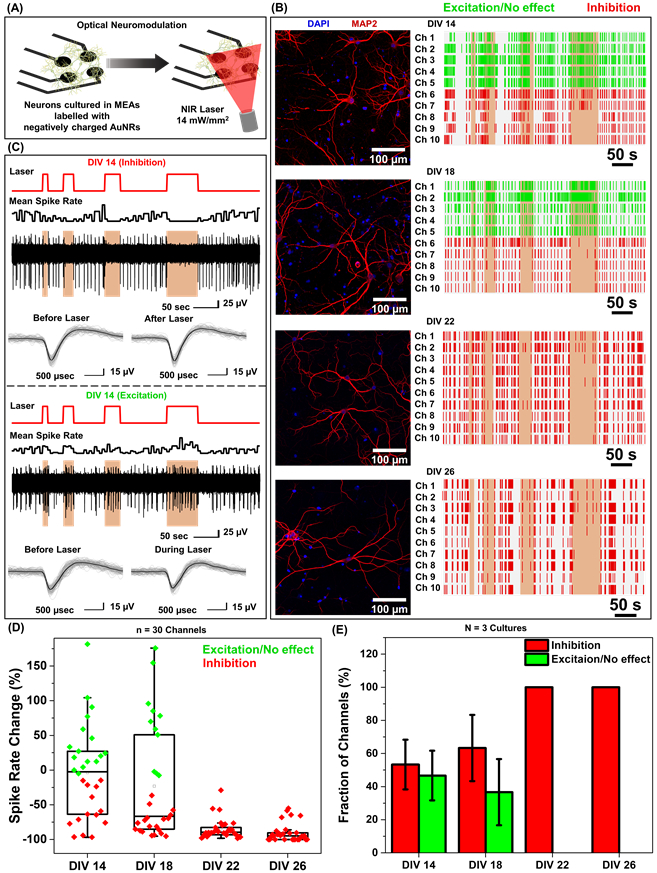
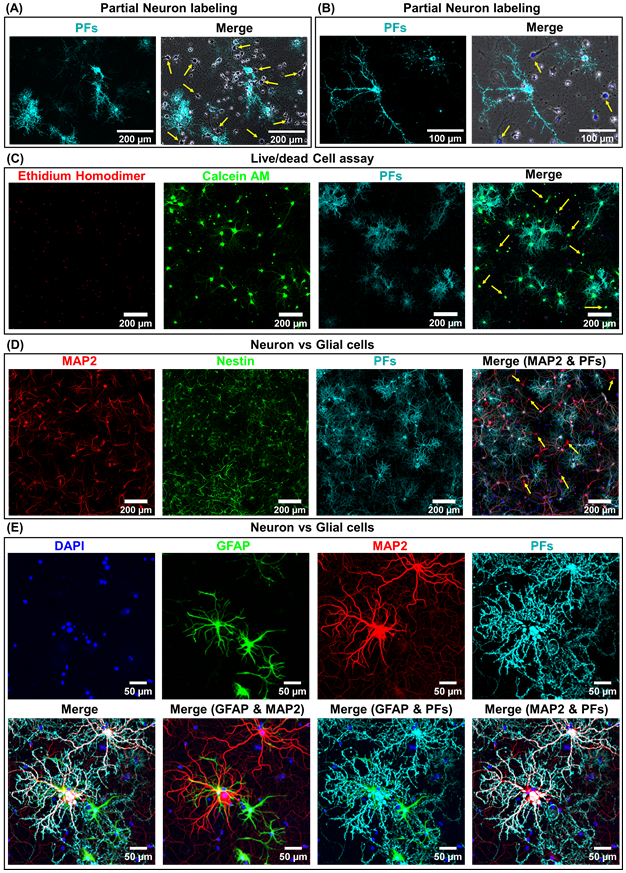
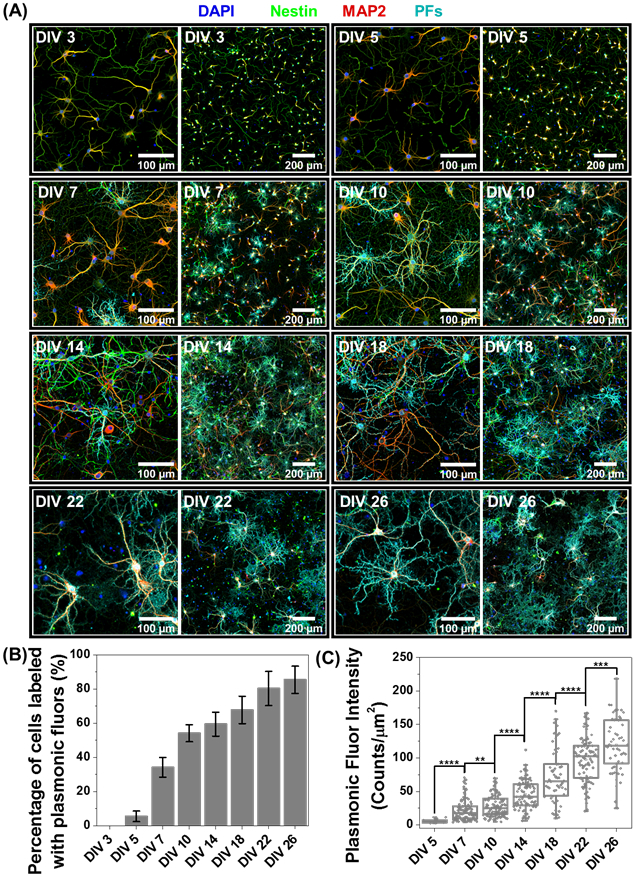
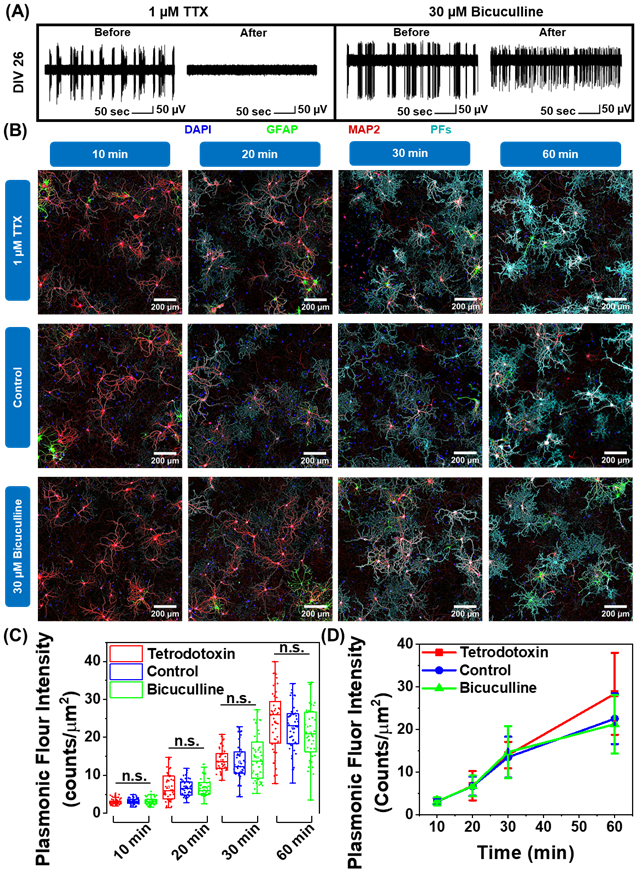
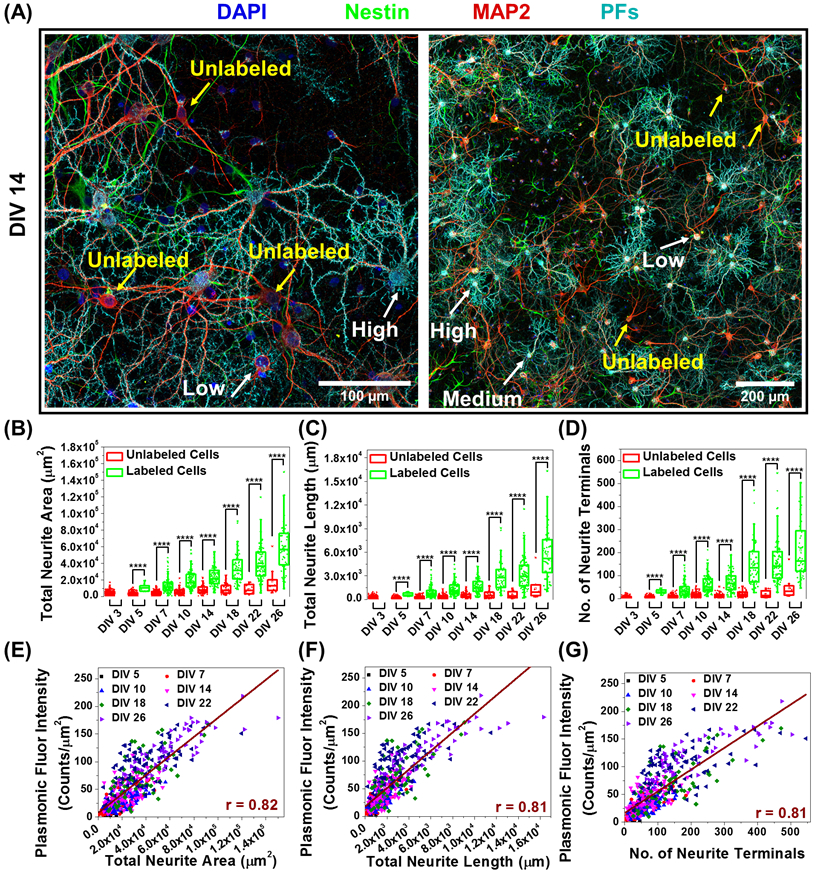
Nanotechnology-enabled neuromodulation is a promising minimally-invasive tool in neuroscience and engineering for both fundamental studies and clinical applications. However, the nano-neuro interaction at different stages of maturation of a neural network and its implications for the nano-neuromodulation remain unclear. Here, we report heterogeneous to homogeneous transformation of neuromodulation in a progressively maturing neural network. Utilizing plasmonic-fluors as ultrabright fluorescent nanolabels, we reveal that negative surface charge of nanoparticles renders selective nano-neuro interaction with a strong correlation between the maturation stage of the individual neurons in the neural network and the density of the nanoparticles bound on the neurons. In stark contrast to homogeneous neuromodulation in a mature neural network reported so far, the maturation-dependent density of the nanoparticles bound to neurons in a developing neural network resulted in a heterogeneous optical neuromodulation (i.e., simultaneous excitation and inhibition of neural network activity). This study advances our understanding of nano-neuro interactions and nano-neuromodulation with potential applications in minimally-invasive technologies for treating neuronal disorders in parts of the mammalian brain where neurogenesis persists throughout aging.


Conflict of interest statement

Competing Interests

The authors declare the following competing financial interests: S.S. is one of the inventors on a pending patent related to plasmonic fluor technology and the technology has been licensed by the Office of Technology Management at Washington University in St Louis to Auragent Bioscience LLC, which is developing plasmonic fluor products. S.S. is one of the co-founders and shareholders of Auragent Bioscience LLC. These potential conflicts of interest have been disclosed and are being managed by Washington University in St Louis.

Figures

Figure 1.
Figure 1.. Plasmonic-fluor as an ultrabright fluorescent nanoconstruct for probing nano-neuro interaction
(A) Schematic illustration of plasmonic-fluor (PF) comprised of plasmonic nanoantenna (Au@Ag nanocuboid) coated with a polymer layer as dielectric spacer (polymer), fluorophores (IR-650) and a universal biorecognition element (biotin) assembled using bovine serum albumin (BSA). (B) TEM image of PFs (Inset: Higher magnification image depicting a thin organic layer around the plasmonic core). (C) Zeta potential (Error bars, s.d., n = 3 repeated tests), (D) visible–NIR extinction spectra, and (E) Fluorescence intensity (Error bars, s.d., n = 4 independent tests) of negatively and positively-charged PF. Statistical analyses were performed via unpaired two-sample t-test; n=4, p = 0.1022. Confocal fluorescence images of cultured hippocampal neurons at DIV 14 after 1 hour incubation with (F) negative and (G) positive PFs (red). The nucleus was stained with DAPI (blue) post-fixation. This is a representative image from 1 of a total of 8 images taken from n=2 independent experiments. SEM image of (H) a single hippocampal neuron with selective localization of negative PFs and a higher magnification image showing (I) the randomly oriented PFs on soma and (J) the longitudinally aligned PFs on the neurites (Inset: zoomed in image depicting single nanoparticle-wide array of PFs along the neurites). This is a representative image from 15 images taken from n=2 independent experiments.
Figure 2.
Figure 2.. Nano-neuro interaction elicits electrophysiological alterations in in-vitro cultured hippocampal neurons
(A) Schematic illustration depicting the selective binding of negatively charged plasmonic nanostructures (gold nanorods, AuNR) to hippocampal neurons. (B) A single trace of spike recording before and after neurons were incubated with negatively charged AuNR. (C) Overlaid spike waveform of hippocampal neurons before and after AuNR labeling. Panel on the left shows the spike cutouts before the application of AuNRs and panel on the right shows the spike cutouts after the AuNR binding. Spikes from 10-minute recording with at least 700 spikes in each set. Black curve shows the mean value for each set. The traces in B and C are representative ones from a total of 23 active channels measured from primary cultured hippocampal neurons cultured on a microelectrode array (MEA). The experiment was repeated three times independently with similar results. Whisker plots demonstrating effect of AuNR localization on neuron membrane on the (D) mean spike rate, (E) mean burst rate, (F) burst duration and (G) mean spikes per burst of cultured neurons. Statistical analyses were performed via unpaired two-samples t-test; n=23, * p<0.05, ** p<0.01, *** p<0.001 and **** p<0.0001. The box bounds the interquartile range (IQR) divided by the median, and Tukey-style whiskers extend to a maximum of 1.5 × IQR beyond the box. Filled diamonds are sample data points, open square represents mean and cross represents outliers.
Figure 3.
Figure 3.. Homogenous and heterogeneous modulation of neuronal activity through photothermal stimulation
(A) Schematic illustration of the optical neuromodulation experimental setup demonstrating primary hippocampal neurons cultured in MEAs and stimulated with NIR laser (808 nm, 14 mW/mm2) after incubation with negatively charged AuNRs. (B) Raster plots (right panel) representing the spiking activity of primary hippocampal neurons labeled with negatively charged AuNRs at different days in vitro (DIV 14, 18, 22 and 26). Each row in the raster plot corresponds to one channel of a MEA. Ten representative channels out of at least 30 active channels are presented. The vertical orange color bar indicates the time when NIR laser (808 nm laser wavelength, 14 mW/mm2 power density, laser duration of 10, 20, 30 and 60 seconds) was illuminated on the MEAs with primary hippocampal neurons labelled with negatively charged AuNRs to investigate optical neuromodulation. Green represents channels exhibiting excitation or no effect and red represents channels exhibiting inhibition upon laser illumination. The experiment was repeated three times independently with similar results. Corresponding confocal fluorescence images (left panel) of primary cultured hippocampal neurons at DIV 14, 18, 22 and 26 co-stained with MAP2 (red) which is a neuronal marker and DAPI (blue) for nucleus staining. (C) Raw extracellular voltage traces showing modulation of spiking activity (top panel in each block) recorded from two different channels, one exhibiting inhibition (top panel) and the other showing excitation (bottom panel) of neural activity in response to optical stimuli measured simultaneously from the MEA with cultured hippocampal neurons at DIV 14. Overlaid spike waveform (bottom panel in each block) of hippocampal neurons before (inhibition and excitation panel), after (inhibition panel) and during (excitation panel) optical neuromodulation (the spikes waveforms are plotted for before, during and after 60 second laser illumination, with at least 90 spikes in each set and black curve shows the mean value for each set). The traces are representative ones from a total of at least 30 active channels measured from primary cultured hippocampal neurons cultured on a MEA. (D) Whisker plot demonstrating the quantification of spike rate changes in panel B (effect of neuronal network maturation on the optical neuromodulation, transformation from heterogeneous to homogeneous neuromodulation, n ≥ 30 channels). The box bounds the interquartile range (IQR) divided by the median, and Tukey-style whiskers extend to a maximum of 1.5 × IQR beyond the box. Filled diamonds are sample data points, open square represents mean and cross represents outliers. (E) Fraction of MEA channels exhibiting inhibition and excitation/no change in the spike rate of the neurons labeled with negatively charged AuNRs in response to NIR stimuli (Error bars, s.d., N = 3 independent cultures).
Figure 4.
Figure 4.. Partial labeling of neurons with negatively charged PFs
(A) Low and (B) high magnification confocal fluorescence images of cultured hippocampal neurons after 1 hour incubation with negatively charged PFs at DIV 14. The left panel shows the fluorescence image corresponding to negatively charged PFs (cyan) and right panel is the merged fluorescence image comprising of phase contrast (gray), DAPI for nucleus staining (blue) and PFs (cyan). Yellow arrows indicate untagged cells. (n=2 independent experiments) (C) Confocal fluorescence images of cultured hippocampal neurons after 1 hour incubation with negatively charged PFs (cyan) at DIV 14, co-stained with ethidium homodimer (red) for dead cell staining and calcein AM (green) for live cell staining. The yellow arrows indicate live cells that are not tagged with negatively charged PFs. (n=2 independent experiments) (D) Confocal fluorescence images of cultured hippocampal neurons after 1 hour incubation with negatively charged PFs (cyan) at DIV 14, co-stained with MAP2 (red, neuronal cell marker, specific to neuron cells), Nestin (green, progenitor cell marker, stains both neurons and glial cells) and DAPI (blue, nucleus staining). The yellow arrows indicate untagged neurons after incubation with negatively charged PFs. (n=2 independent experiments). (E) Confocal fluorescence images of cultured hippocampal neurons after 1 hour incubation with negatively charged PFs (cyan) at DIV 26, co-stained with MAP2 (red, neuronal cell marker, specific to neuron cells), GFAP (green, glial cell marker, specific to glial cells) and DAPI (blue, nucleus staining). (n=2 independent experiments)
Figure 5.
Figure 5.. Role of Neuronal network maturation in nano-neuro interaction
(A) Confocal fluorescence images of cultured hippocampal neurons after 1 hour incubation with negatively charged PFs (cyan) at DIV 3, 5, 7, 10, 14, 18, 22 and 26, co-stained with MAP2 (red, neuronal cell marker, specific to neuron cells), Nestin (green, progenitor cell marker, stains both neurons and glial cells) and DAPI (blue, nucleus staining). The left panel in each block shows the fluorescence image at 20X magnification and the left panel each block shows the 3×3 tiled image obtained from 9 images similar to the left panel. (n=2 independent experiments). (B) Percentage of neuronal cells labelled with negatively charged PFs at different DIVs (Error bars, s.d., n = 6, 3×3 tiled images from n=2 independent cultures). (C) Whisker plot representing fluorescence intensity of PF tagged neurons at various DIVs (Unpaired Two-samples t-test; n = 5, 106, 111, 94, 98, 95 and 54 labelled neuronal cells from three 3×3 tiled images from the same culture for DIVs 5, 7, 10, 14, 18, 22 and 26 respectively, * p<0.05, ** p<0.01, *** p<0.001 and **** p<0.0001). The box bounds the interquartile range (IQR) divided by the median, and Tukey-style whiskers extend to a maximum of 1.5 × IQR beyond the box. Filled diamonds are sample data points, open square represents mean and cross represents outliers.
Figure 6.
Figure 6.. Role of neural network electrophysiological activity in nano-neuro interaction
(A) A single trace of spike recording at DIV 26 before and after neurons were incubated with 1 μM tetrodotoxin and 30μM bicuculline for 15 minutes. The traces are representative ones from a total of 23 active channels measured from primary cultured hippocampal neurons cultured on a microelectrode array (MEA). The experiment was repeated two times independently with similar results. (B) Confocal fluorescence images of cultured hippocampal neurons after pharmacological manipulation of electrophysiological activity of the neural network and subsequent incubation with negatively charged PFs (cyan) at DIV 26 for various durations (10, 20, 30 and 60 min), co-stained with MAP2 (red, neuronal cell marker, specific to neuron cells), GFAP (green, glial cell marker, specific to glial cells) and DAPI (blue, nucleus staining). Each block shows the 3×3 tiled image obtained from 20X magnification images. (n=2 independent experiments). (C) Whisker plot representing fluorescence intensity of PF tagged neurons for various nanoparticle incubation durations (10, 20, 30 and 60 min) after pharmacological manipulation. Unpaired Two-samples t-test; n ≥ 50 labelled neuronal cells from three 3×3 tiled images from the same culture, * p<0.05, ** p<0.01, *** p<0.001 and **** p<0.0001. The box bounds the interquartile range (IQR) divided by the median, and Tukey-style whiskers extend to a maximum of 1.5 × IQR beyond the box. Filled diamonds are sample data points, open square represents mean and cross represents outliers. (D) Kinetics of nanoparticle binding on the neurons under various electrophysiological conditions. (Error bars, s.d., n ≥ 50).
Figure 7.
Figure 7.. Correlation between morphological maturation parameters of neurons and the nano-neuro interaction
(A) Confocal fluorescence images of cultured hippocampal neurons after 1 hour incubation with negatively charged PFs (cyan) at DIV 14, co-stained with MAP2 (red, neuronal cell marker, specific to neuron cells), Nestin (green, progenitor cell marker, stains both neurons and glial cells) and DAPI (blue, nucleus staining). The left panel shows the fluorescence image at 20× magnification and the right panel shows the 3×3 tiled image obtained from 9 images similar to left panel. (n=2 independent experiments). Yellow arrows indicate untagged cells and white arrows indicate tagged cells with graded tagging. Whisker plot representing the morphological maturation parameters: (B) total neurite area, (C) total neurite length and, (D) no. of neurite terminals of neurons with and without nanoparticles at DIV 3, 5, 7, 10, 14, 18, 22 and 26. Morphological maturation parameters were extracted from fluorescence images using MAP2 and PF channels via filament tracking analysis. Unpaired Two-samples t-test; n = 215, 190, 134, 94, 64, 42, 15 and 10 unlabeled neuronal cells and n = 0, 5, 106, 111, 94, 98, 95 and 54 labeled neuronal cells from three 3×3 tiled images from the same culture for DIV 3, 5, 7, 10, 14, 18, 22 and 26 respectively, * p<0.05, ** p<0.01, *** p<0.001 and **** p<0.0001. The box bounds the interquartile range (IQR) divided by the median, and Tukey-style whiskers extend to a maximum of 1.5 × IQR beyond the box. Filled diamonds are sample data points, open square represents mean and cross represents outliers. Correlation between morphological maturation parameters: (E) total neurite area, (F) total neurite length and, (G) no. of neurite terminals and the fluorescence intensity of PFs bound on the neuron (which is directly related to density of PFs on the neuron). The scatter plot is presented using the data from all the tagged cells and Pearson’s correlation coefficient (r) is calculated after performing linear fitting of the concatenated data.

Similar articles

Cited by

References

    1. Acarón Ledesma H, Li X, Carvalho-de-Souza JL, Wei W, Bezanilla F and Tian B, Nature Nanotechnology, 2019, 14, 645–657. - PMC - PubMed
    1. Yang C and Park S, Biomedical Engineering Letters, 2021, 11, 163–170. - PMC - PubMed
    1. Ashkan K, Rogers P, Bergman H and Ughratdar I, Nature Reviews Neurology, 2017, 13, 548–554. - PubMed
    1. Salatino JW, Ludwig KA, Kozai TDY and Purcell EK, Nature biomedical engineering, 2017, 1, 862–877. - PMC - PubMed
    1. Zhou W, Dai X and Lieber CM, Reports on Progress in Physics, 2016, 80, 016701. - PubMed

Publication types

LinkOut - more resources