. 2023 Nov 1;325(5):E500-E512.
doi: 10.1152/ajpendo.00069.2023. Epub 2023 Sep 6.

The proteasome regulates body weight and systemic nutrient metabolism during fasting

Affiliations

The proteasome regulates body weight and systemic nutrient metabolism during fasting

Henning Tim Langer et al. Am J Physiol Endocrinol Metab. .

Abstract

The ubiquitin-proteasome system (UPS) and the autophagy-lysosome pathway are the primary means of degradation in mammalian tissues. We sought to determine the individual contribution of the UPS and autophagy to tissue catabolism during fasting. Mice were overnight fasted for 15 h before regaining food access ("Fed" group, n = 6) or continuing to fast ("Fast" group, n = 7) for 3 h. In addition, to investigate the effects of autophagy on systemic metabolism and tissue degradation, one group of mice was fasted for 18 h and treated with chloroquine ("Fast + CLQ" group, n = 7) and a fourth group of mice was treated with bortezomib ("Fast + Bort" group, n = 7) to assess the contribution of the UPS. Body weight, tissue weight, circulating hormones and metabolites, intracellular signaling pathways, and protein synthesis were investigated. Fasting induced the loss of body weight, liver mass, and white adipose tissue in the Fast and the Fast + CLQ group, whereas the Fast + Bort group maintained tissue and body weight. Fasting reduced glucose and increased β hydroxybutyrate in the circulation of all mice. Both changes were most profound in the Fast + Bort group compared with the other fasting conditions. Molecular signaling indicated a successful inhibition of hepatic UPS with bortezomib and an upregulation of the PI3K/AKT/mTOR pathway. The latter was further supported by an increase in hepatic protein synthesis with bortezomib. Inhibition of the UPS through bortezomib blocks body weight loss and tissue catabolism during an acute overnight fast in mice. The effects were likely mediated through a combined effect of the drug on biomolecule degradation and synthesis.NEW & NOTEWORTHY Bortezomib treatment prevents tissue and body weight loss during fasting. The loss of proteasome activity with bortezomib exacerbates fasting-induced ketogenesis. During fasting, bortezomib increases AMPK and PI3K/AKT signaling in the liver, which promotes protein synthesis.

Keywords: autophagy; fasting; glucose; proteasome; proteolysis.


Conflict of interest statement

M.D.G. reports consulting or advisory roles with Scorpion Therapeutics; stock or other ownership interests in Faeth Therapeutics; honoraria from Novartis, Pfizer, Scorpion Therapeutics; patents, royalties, and other intellectual property with Weill Cornell Medicine. All outside of the scope of this manuscript.

Figures

None
Graphical abstract
Figure 1.
Figure 1.
Bortezomib maintains tissue and body weight during an 18 h overnight fast. Experimental setup (A) and changes in body weight from the day before the start of the intervention (B). B: liver mass at the time of collection. Liver mass (C), white adipose tissue (WAT) mass (D), and gastrocnemius mass (E). Liver glycogen (F), triglyceride (G), and protein content (H). A one-way ANOVA and a Tukey post hoc multiple comparison test were used to assess group differences. Statistically significant differences to the Fed condition are denoted as *, **, and *** (P < 0.05, 0.01, or 0.001, respectively). Significant differences to the Fast group (P < 0.05) are denoted as #. Significant differences to the Fast+CLQ group (P < 0.05) are denoted as &. Significant differences to the Fast+Bort group (P < 0.05) are denoted as $. Bort, bortezomib; CLQ, chloroquine.
Figure 2.
Figure 2.
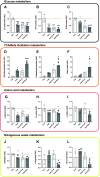
Bortezomib reduces circulating metabolites associated with glycolysis and proteolysis, while increasing the abundance of metabolites associated with fatty acid metabolism. Serum levels of metabolites associated with carbohydrate metabolism: lactic acid (A), fructose (B), and glucose (C). Serum levels of metabolites associated with oxidative metabolism: β hydroxybutyrate (D), palmitoylcarnitine (E), and citric acid (F). Serum levels of metabolites associated with amino acid metabolism: alanine (G), lysine (H), and valine (I). Serum levels of metabolites associated with the removal of nitrogenous waste: citrulline (J), arginine (K), and uric acid (L). A one-way ANOVA and a Tukey post hoc multiple comparison test were used to assess group differences. Statistically significant differences to the Fed condition are denoted as *, **, and *** (P < 0.05, 0.01, or 0.001, respectively). Significant differences to the Fast group (P < 0.05) are denoted as #. Significant differences to the Fast+CLQ group (P < 0.05) are denoted as &. Bort, bortezomib; CLQ, chloroquine.
Figure 3.
Figure 3.
Molecular signaling of hepatic glycolysis and anabolism are increased with bortezomib but not chloroquine during fasting. Liver Western blot analysis. A: phospho-AMPK (T172) relative to total AMPK protein levels. B: phospho-ACC (S79) relative to total ACC protein levels. C: phospho-AKT (S473) relative to total AKT protein levels. D: phospho-AS160 (T642) relative to total ACC protein levels. E: phospho-PRAS40 (T246) relative to total PRAS40 protein levels. F: phospho-4E-BP1 (T37/46) relative to total 4E-BP1 protein levels. G: P62 protein levels normalized to total protein per lane (Ponceau). H: LC3B II protein levels normalized to total protein per lane (Ponceau). I: total ubiquitinated proteins per lane normalized to total protein per lane (Ponceau). J: representative blots. A one-way ANOVA and a Tukey post hoc multiple comparison test were used to assess group differences. Statistically significant differences to the Fed condition are denoted as * and ** (P < 0.05 and 0.01, respectively). Significant differences to the Fast group (P < 0.05) are denoted as #. Significant differences to the Fast+CLQ group (P < 0.05) are denoted as &. Bort, bortezomib; CLQ, chloroquine.
Figure 4.
Figure 4.
Systematically inhibiting autophagy and the ubiquitin-proteasome system causes molecular signaling in skeletal muscle that is distinct from the effects on the liver. Skeletal muscle (gastrocnemius) Western blot analysis. A: phospho-AMPK (T172) relative to total AMPK protein levels. B: phospho-ACC (S79) relative to total ACC protein levels. C: phospho-AKT (S473) relative to total AKT protein levels. D: phospho-AS160 (T642) relative to total ACC protein levels. E: phospho-PRAS40 (T246) relative to total PRAS40 protein levels. F: phospho-4E-BP1 (T37/46) relative to total 4E-BP1 protein levels. G: P62 protein levels normalized to total protein per lane (Ponceau). H: LC3B II protein levels normalized to total protein per lane (Ponceau). I: total ubiquitinated proteins per lane normalized to total protein per lane (Ponceau). J: representative blots. A one-way ANOVA and a Tukey post hoc multiple comparison test were used to assess group differences. Statistically significant differences to the Fed condition are denoted as *, **, and **** (P < 0.05, 0.01, or 0.0001, respectively). Significant differences to the Fast group (P < 0.05) are denoted as #. Significant differences to the Fast+CLQ group (P < 0.05) are denoted as &. Significant differences to the Fast+Bort group (P < 0.05) are denoted as $. Bort, bortezomib; CLQ, chloroquine.
Figure 5.
Figure 5.
Global hepatic protein synthesis is reduced with overnight fasting but rescued through bortezomib treatment. Liver protein synthesis rates were assessed via the SUnSET method. Briefly, the tRNA analog puromycin was injected 30 min before tissue collection. Puromycin then was incorporated into every nascent peptide synthesized between injection and tissue collection. The presence of puromycin in the liver protein pool was then assessed via immunoblotting. Shown is the full membrane that was probed for puromycin (left) and the quantification of the total lane intensities (right). Fasting reduced hepatic protein synthesis rates compared with the Fed state, whereas Fast + CLQ remained unchanged. Bortezomib slightly increased protein synthesis rates compared with Fed and the other fasting groups. A one-way ANOVA and a Tukey post hoc multiple comparison test were used to assess group differences. Statistically significant differences to the Fed condition are denoted as * and *** (P < 0.05 or 0.001, respectively). Significant differences to the Fast group (P < 0.05) are denoted as #. Significant differences to the Fast+CLQ group (P < 0.01) are denoted as &&. CLQ, chloroquine; SUnSET, SUrface SEnsing of Translation.

Similar articles

Cited by

References

    1. White E, Mehnert JM, Chan CS. Autophagy, metabolism, and cancer. Clin Cancer Res 21: 5037–5046, 2015. doi:10.1158/1078-0432.CCR-15-0490. - DOI - PMC - PubMed
    1. Ueno T, Komatsu M. Autophagy in the liver: functions in health and disease. Nat Rev Gastroenterol Hepatol 14: 170–184, 2017. doi:10.1038/nrgastro.2016.185. - DOI - PubMed
    1. Ciechanover A. Intracellular protein degradation from a vague idea through the lysosome and the ubiquitin-proteasome system and on to human diseases and drug targeting: Nobel Lecture, December 8, 2004. Ann NY Acad Sci 1116: 1–28, 2007. doi:10.1196/annals.1402.078. - DOI - PubMed
    1. Bodine SC, Latres E, Baumhueter S, Lai VK, Nunez L, Clarke BA, Poueymirou WT, Panaro FJ, Na E, Dharmarajan K, Pan ZQ, Valenzuela DM, DeChiara TM, Stitt TN, Yancopoulos GD, Glass DJ. Identification of ubiquitin ligases required for skeletal muscle atrophy. Science 294: 1704–1708, 2001. doi:10.1126/science.1065874. - DOI - PubMed
    1. Bodine SC, Baehr LM. Skeletal muscle atrophy and the E3 ubiquitin ligases MuRF1 and MAFbx/atrogin-1. Am J Physiol Endocrinol Physiol 307: E469–E484, 2014. doi:10.1152/ajpendo.00204.2014. - DOI - PMC - PubMed

LinkOut - more resources