. 2023 Sep 8;9(36):eadf9706.
doi: 10.1126/sciadv.adf9706. Epub 2023 Sep 6.

Shigella induces epigenetic reprogramming of zebrafish neutrophils

Affiliations

Shigella induces epigenetic reprogramming of zebrafish neutrophils

Margarida C Gomes et al. Sci Adv. .

Abstract

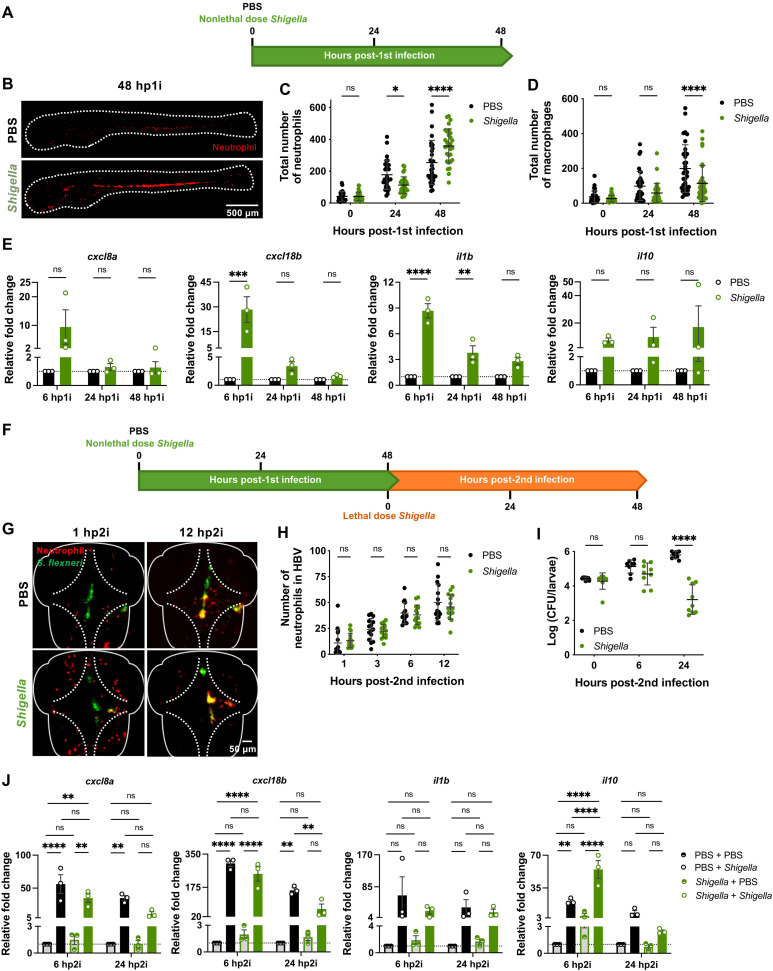
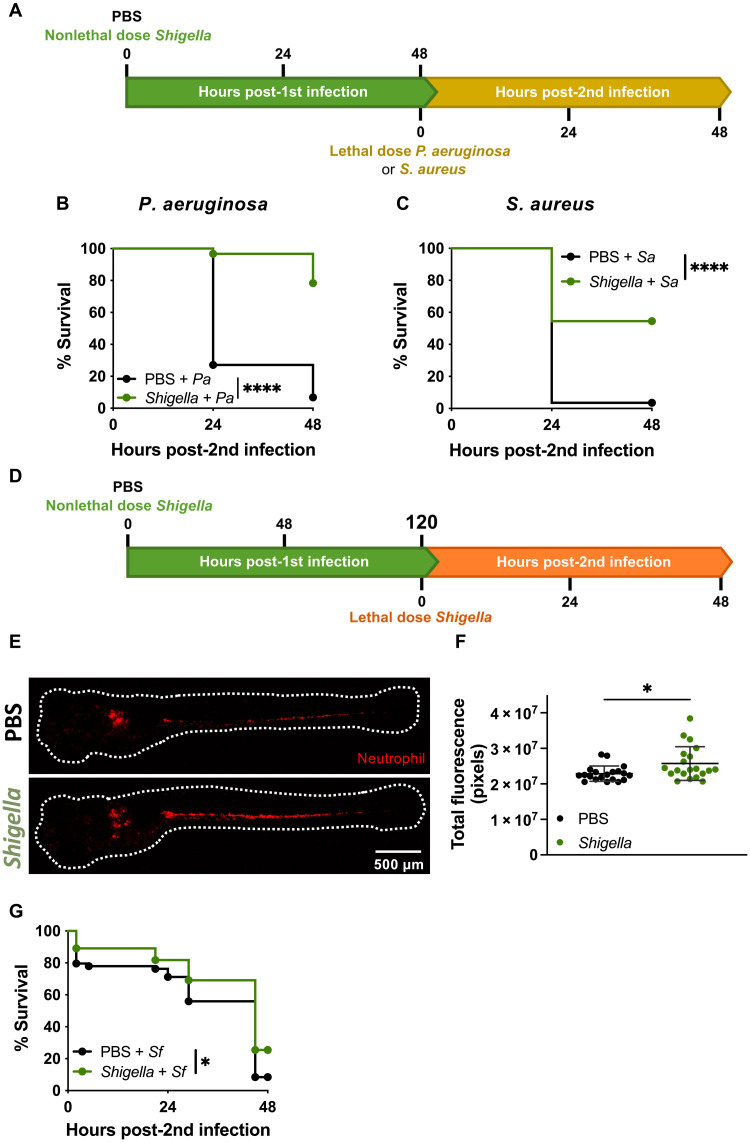
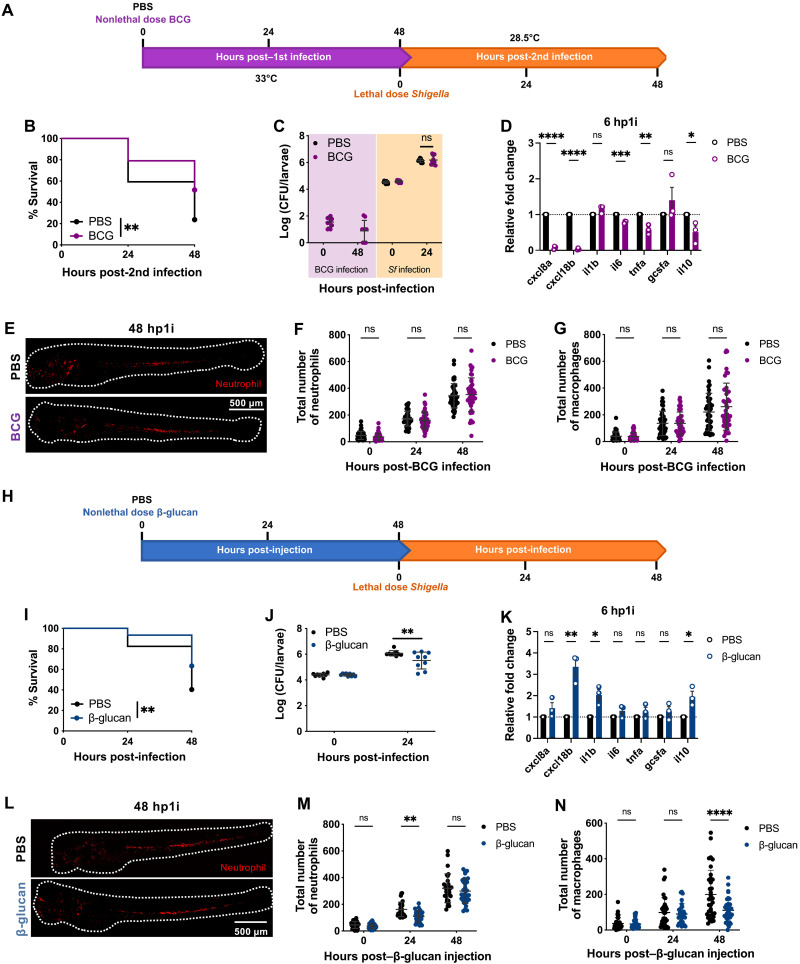
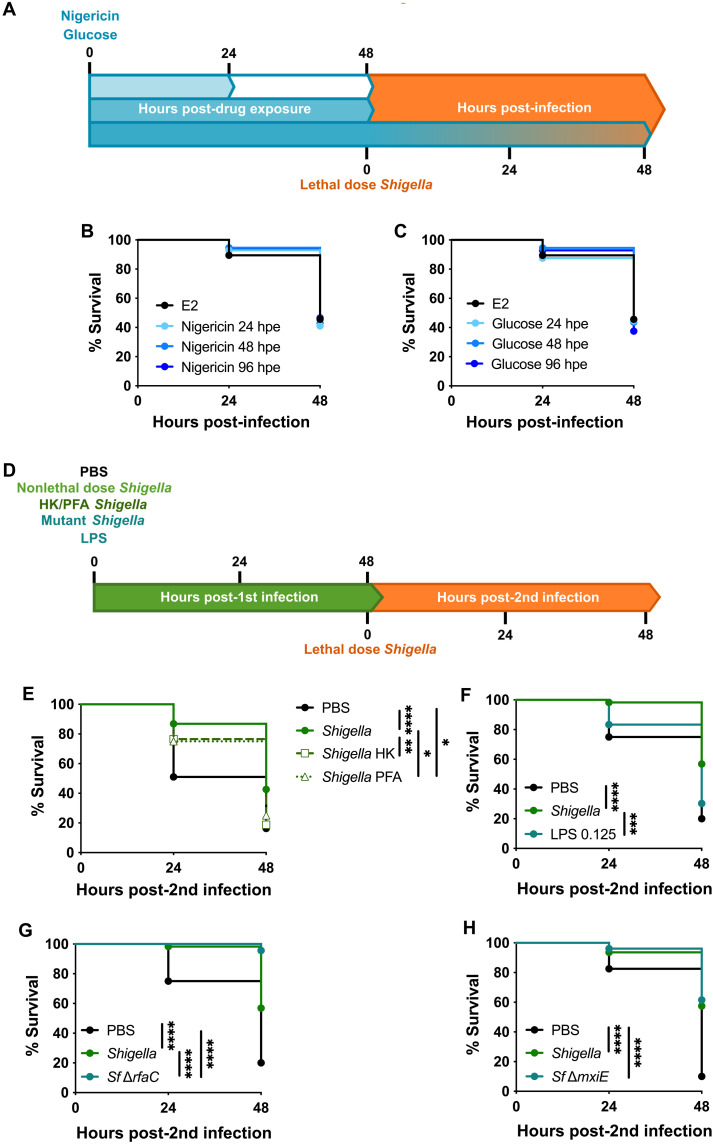
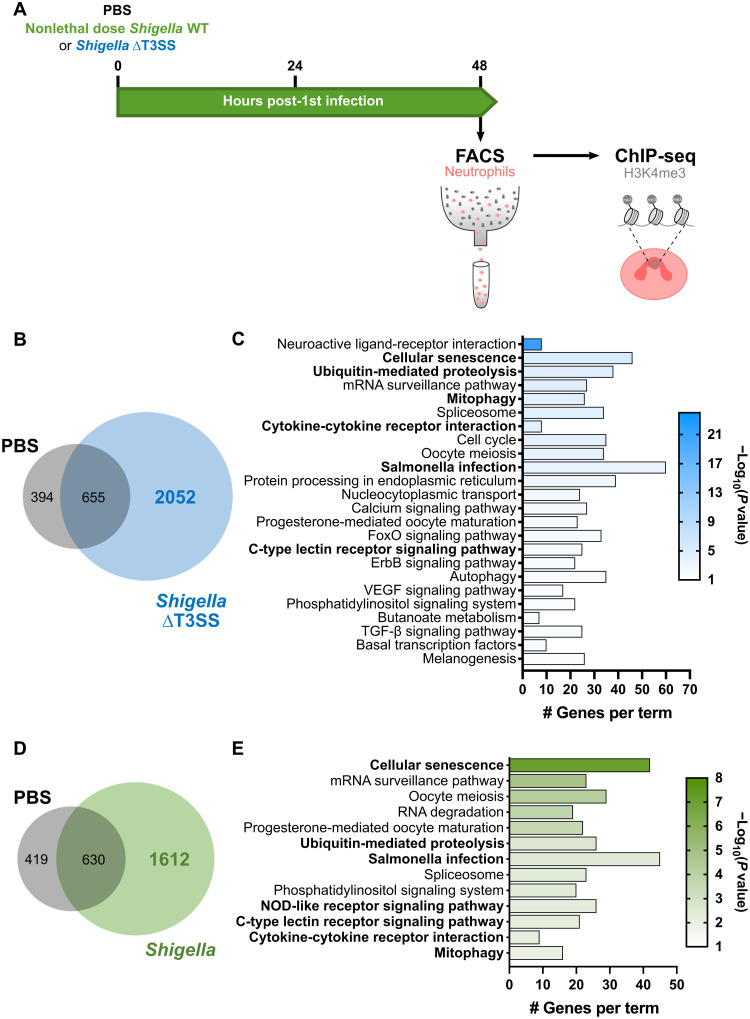
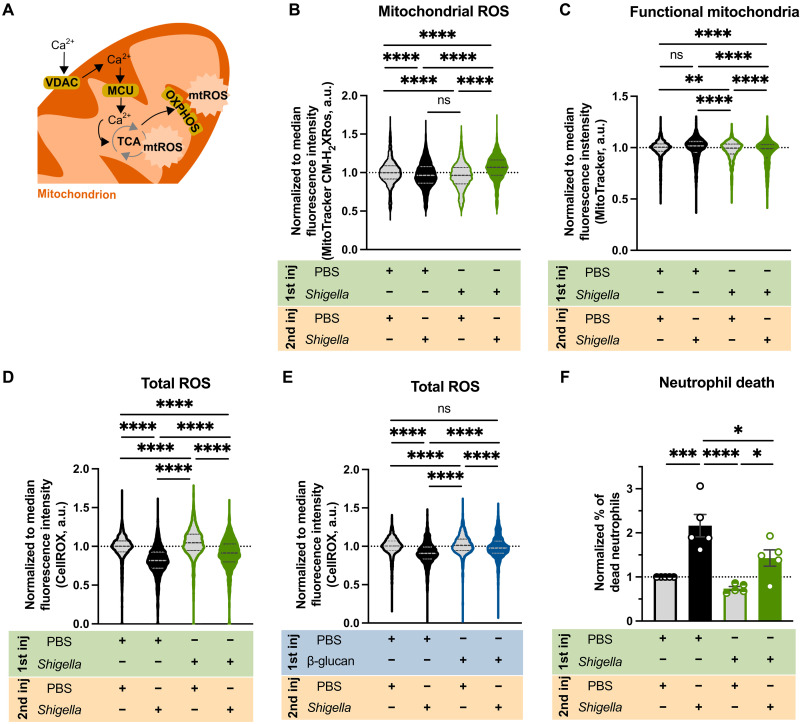
Trained immunity is a long-term memory of innate immune cells, generating an improved response upon reinfection. Shigella is an important human pathogen and inflammatory paradigm for which there is no effective vaccine. Using zebrafish larvae, we demonstrate that after Shigella training, neutrophils are more efficient at bacterial clearance. We observe that Shigella-induced protection is nonspecific and has differences with training by BCG and β-glucan. Analysis of histone ChIP-seq on trained neutrophils revealed that Shigella training deposits the active H3K4me3 mark on promoter regions of 1612 genes, dramatically changing the epigenetic landscape of neutrophils toward enhanced microbial recognition and mitochondrial ROS production. Last, we demonstrate that mitochondrial ROS plays a key role in enhanced antimicrobial activity of trained neutrophils. It is envisioned that signals and mechanisms we discover here can be used in other vertebrates, including humans, to suggest new therapeutic strategies involving neutrophils to control bacterial infection.


Figures

Fig. 1.
Fig. 1.. Zebrafish exposure to nonlethal Shigella dose induces generation of more resilient neutrophils.
(A) Training of 2 dpf zebrafish larvae. (B) Representative images of Tg(lyz::dsRed) larvae at 48 hp1i. Scale bar, 500 μm. (C) Quantification of neutrophils [Tg(lyz::dsRed)] in naïve and Shigella-trained (2 × 10³ ± 1.4 × 10³ CFUs) larvae. N = 3 with 10 larvae per time point (mean ± SD). (D) Quantification of macrophages [Tg(mpeg::mCherry)] in naïve and Shigella-injected (1.8 × 10³ ± 8.6 × 10² CFUs) larvae. N = 3 with 11 larvae per time point (mean ± SD). (E) Expression of cxcl8a, cxcl18b, il1b, and il10 in Shigella-trained larvae (1.3 × 10³ ± 5.5 × 10² CFUs) as compared to naïve larvae. N = 3 with >5 larvae per time point (mean ± SEM). (F) Reinfection of trained larvae with lethal dose injection of Shigella at 4 dpf. (G) Representative images of Tg(lyz::dsRed) naïve and Shigella-trained larvae reinfected with Shigella flexneri M90T. Scale bar, 50 μm. (H) Quantification of recruited neutrophils [Tg(lyz::dsRed)] to the HBV in naïve and Shigella-trained larvae following reinfection with Shigella (PBS, 2.6 × 10⁴ ± 9 × 10³ CFUs; Shigella, 2.7 × 10⁴ ± 1 × 10⁴ CFUs). N = 3 with 5 larvae per time point (mean ± SD). (I) Bacterial counts from naïve and Shigella-trained larvae reinfected with Shigella (PBS, 2.7 × 10⁴ ± 4.5 × 10³ CFUs; Shigella, 2.5 × 10⁴ ± 1 × 10⁴ CFUs). N = 3 with 3 larvae per time point (mean ± SD). (J) Expression of cxcl8a, cxcl18b, il1b, and il10 following reinfection with Shigella in naïve (2.5 × 10⁴ ± 1 × 10⁴ CFUs) and Shigella-trained (2.7 × 10⁴ ± 4.5 × 10³ CFUs) as compared to PBS-injected controls. N = 3 with >5 larvae per time point (mean ± SEM). *P < 0.05, **P < 0.01, ***P < 0.001, ****P < 0.0001, two-way analysis of variance (ANOVA) with Sidak’s multiple comparisons test (C, D, H, I, and J). ns, not significant.
Fig. 2.
Fig. 2.. Shigella induced protection is nonspecific.
(A) Reinfection of trained larvae with lethal dose injection of P. aeruginosa (Pa) or S. aureus (Sa) at 4 dpf. (B) Survival curves from naïve and Shigella-trained (2.2 × 10³ ± 3.8 × 10² CFUs) larvae infected with P. aeruginosa (PBS, 2.6 × 10³ ± 7.4 × 10² CFUs; Shigella, 2.3 × 10³ ± 5.5 × 10² CFUs). N = 3 with 20 larvae per experiment. (C) Survival curves from naïve and Shigella-trained (1.4 × 10³ ± 8.6 × 10² CFUs) larvae infected with S. aureus (PBS, 3.4 × 10⁴ ± 1.1 × 10⁴ CFUs; Shigella, 3.4 × 10⁴ ± 6 × 10³ CFUs). N = 3 with >20 larvae per experiment. (D) Reinfection of trained larvae with lethal dose injection of Shigella at 7 dpf (or 5 dp1i). (E) Representative images of naïve and Shigella-trained Tg(lyz::dsRed) larvae with at 5 dp1i. Scale bar, 500 μm. (F) Quantification of total fluorescence in Tg(lyz::dsRed) naïve and Shigella-trained (1.7 × 10³ ± 5.7 × 10² CFUs) larvae at 5 dp1i. N = 3 with 10 larvae per time point (mean ± SD). (G) Survival curves from naïve and Shigella-trained larvae infected with Shigella at 5 dp1i. N = 3 with >16 larvae per experiment. *P < 0.05, ****P < 0.0001, log-rank (Mantel-Cox) test (B, C, and G) and unpaired Student’s t test (F).
Fig. 3.
Fig. 3.. BCG and β-glucan induce protection in zebrafish embryos.
(A) Reinfection of BCG-trained larvae with Shigella at 4 dpf. (B) Survival curves (N = 3 with >16 larvae per experiment) and (C) bacterial counts [N = 3 with 3 larvae per time point (mean ± SD)] from naïve and BCG-trained larvae infected with Shigella. (D) Expression of cxcl8a, cxcl18b, il1b, il6, tnfa, gcsfa, and il10 in BCG-trained larvae (4.7 × 101 ± 3.2 × 101 CFUs) as compared to naïve larvae. N = 3 with 10 larvae per time point (mean ± SEM). (E) Representative images of naïve and BCG-trained Tg(lyz::dsRed) larvae at 48 hp1i. Scale bar, 500 μm. (F) Quantification of neutrophils [Tg(lyz::dsRed)] and (G) macrophages [Tg(mpeg::mCherry)] in naïve and BCG-trained larvae [(F) 5.6 × 101 ± 4.3 × 101 CFUs, (G) 6.3 × 101 ± 3.7 × 101 CFUs]. N = 3 with >12 larvae per experiment (mean ± SD). (H) Reinfection of β-glucan–trained larvae with Shigella at 4 dpf. (I) Survival curves (N = 3 with >18 larvae per experiment) and (J) bacterial counts [N = 3 with 3 larvae per time point (mean ± SD)] from naïve and β-glucan–trained (20 ng) larvae infected with Shigella. (K) Expression of cxcl8a, cxcl18b, il1b, il6, tnfa, gcsfa, and il10 in β-glucan–trained larvae (20 ng) as compared to naïve larvae. N = 3 with 10 larvae per time point (mean ± SEM). (L) Representative images of naïve and β-glucan–trained Tg(lyz::dsRed) larvae at 48 hp1i. Scale bar, 500 μm. (M) Quantification of neutrophils [Tg(lyz::dsRed)] and (N) macrophages [Tg(mpeg::mCherry)] in naïve and β-glucan–trained larvae (20 ng). N = 3 with >8 larvae per experiment (mean ± SD). *P < 0.05, **P < 0.01, ***P < 0.001, ****P < 0.0001, log-rank (Mantel-Cox) test (B and I), one-way ANOVA with Tukey’s multiple comparisons test (C and J), unpaired Student’s t test (D and K), and two-way ANOVA with Sidak’s multiple comparisons test (F, G, M, and N).
Fig. 4.
Fig. 4.. Shigella stimulates inflammatory pathways to induce training.
(A) Exposure of zebrafish larvae to nigericin and glucose followed by Shigella infection. (B) Survival curves from E2- and nigericin (0.1 μM)–treated larvae infected with Shigella (PBS, 2.7 × 10⁴ ± 8.5 × 10³ CFUs; nigericin, 2.6 × 10⁴ ± 4.1 × 10³ CFUs). N = 3 with >14 larvae per experiment. hpe, hours post-drug exposure (C) Survival curves from E2- and glucose (1%)–treated larvae infected with Shigella (PBS, 2.7 × 10⁴ ± 8.5 × 10³ CFUs; glucose, 2.7 × 10⁴ ± 1 × 10⁴ CFUs). N = 3 with >14 larvae per experiment. (D) Reinfection of larvae trained with nonlethal dose of live or killed Shigella, Shigella mutants, or LPS followed by infection with Shigella at 4 dpf. (E) Survival curves from naïve, live-Shigella–trained (1.3 × 10³ ± 6.6 × 10² CFUs), Shigella heat-killed (HK)–trained, and Shigella PFA–trained larvae infected with Shigella (PBS, 2.7 × 10⁴ ± 6.1 × 10³ CFUs; Shigella, 2.7 × 10⁴ ± 1 × 10⁴ CFUs; Shigella HK, 3.2 × 10⁴ ± 3.3 × 10⁴ CFUs; Shigella PFA, 3.2 × 10⁴ ± 1.7 × 10⁴ CFUs). N = 3 with >11 larvae per experiment. (F) Survival curves from naïve Shigella-trained (1.6 × 10³ ± 6.5 × 10² CFUs) and LPS-primed (0.125 ng) larvae infected with Shigella (PBS, 1.9 × 10⁴ ± 6.3 × 10³ CFUs; Shigella, 2.8 × 10⁴ ± 4.7 × 10³ CFUs; LPS, 1.9 × 10⁴ ± 9.1 × 10³ CFUs). N = 3 with >18 larvae per experiment. (G) Survival curves from naïve, Shigella-trained (1.6 × 10³ ± 6.5 × 10² CFUs), and Shigella ΔrfaC–trained (8.5 × 10² ± 7.5 × 10² CFUs) larvae infected with Shigella (PBS, 1.9 × 10⁴ ± 6.3 × 10³ CFUs; Shigella, 2.8 × 10⁴ ± 4.7 × 10³ CFUs; ΔrfaC, 2.4 × 10⁴ ± 8.4 × 10³ CFUs). N = 3 with >10 larvae per experiment. (H) Survival curves from naïve, Shigella-trained (7.9 × 10² ± 5.5 × 10² CFUs) and Shigella ΔmxiE–trained (8.8 × 10² ± 5.8 × 10² CFUs) larvae infected with Shigella (PBS, 1.9 × 10⁴ ± 7.5 × 10³ CFUs; Shigella, 2.5 × 10⁴ ± 4.6 × 10³ CFUs; ΔmxiE, 2.2 × 10⁴ ± 7.6 × 10³ CFUs). N = 3 with >10 larvae per experiment. *P < 0.05, **P < 0.01, ***P < 0.001, ****P < 0.0001, log-rank (Mantel-Cox) test (B, C, E, F, G, and H).
Fig. 5.
Fig. 5.. Exposure to Shigella induces epigenetic reprogramming of neutrophils.
(A) Isolation of neutrophils by FACS from naïve and Shigella-trained larvae for ChIP-seq on H3K4me3 modification. (B) Venn diagram showing the number of common and unique genes marked by H3K4me3 peaks in their promoter regions [±3 kb from transcription start site (TSS)] of PBS and Shigella ∆T3SS–trained larvae. (C) Enriched Kyoto Encyclopedia of Genes and Genomes (KEGG) pathways (P value < 0.01) associated with the 2052 unique Shigella ∆T3SS training genes marked by an H3K4me3 peak in their promoter regions (±3 kb from TSS). FoxO, Forkhead box O; ErbB, erythroblastic oncogene B; VEGF, vascular endothelial growth factor; TGF-β, transforming growth factor–β. (D) Venn diagram showing the number of common and unique genes marked by H3K4me3 peaks in their promoter regions (±3 kb from TSS) of PBS and Shigella WT trained larvae. (E) Enriched KEGG pathways (P value < 0.01) associated with the 1612 unique Shigella WT training genes marked by an H3K4me3 peak in their promoter regions (±3 kb from TSS). NOD, nucleotide binding oligomerization domain.
Fig. 6.
Fig. 6.. Trained neutrophils produce more mtROS.
(A) Increased calcium transportation via VDAC and MCU increases mtROS. (B) Normalized fluorescence of MitoTracker Red CM-H2XRos in neutrophils from naïve and Shigella-trained (1.2 × 10³ ± 5.3 × 10² CFUs) larvae [Tg(mpx::GFP)] unstimulated or infected with Shigella (PBS, 2.6 × 10⁴ ± 9.3 × 10³ CFUs; Shigella, 3 × 10⁴ ± 6.6 × 10³ CFUs) at 6 hp2i. N = 3 with >10 larvae per experiment (mean ± SD). (C) Normalized fluorescence of MitoTracker Deep Red in neutrophils from naïve and Shigella-trained (1.8 × 10³ ± 1 × 10³ CFUs) larvae [Tg(mpx::GFP)] unstimulated or infected with Shigella (PBS, 2.1 × 10⁴ ± 1.1 × 10⁴ CFUs; Shigella, 1.9 × 10⁴ ± 8.3 × 10³ CFUs) at 6 hp2i. N = 3 with 30 larvae per experiment (mean ± SD). (D) Normalized fluorescence of CellROX Deep Red in neutrophils from naïve and Shigella-trained (1.4 × 10³ ± 6.7 × 10² CFUs) larvae [Tg(mpx::GFP)] unstimulated or infected with Shigella (PBS, 2.6 × 10⁴ ± 1 × 10⁴ CFUs; Shigella, 2.6 × 10⁴ ± 1 × 10⁴ CFUs) at 6 hp2i. N = 3 with >10 larvae per experiment (mean ± SD). (E) Normalized fluorescence of CellROX Deep Red in neutrophils from naïve and β-glucan–trained larvae [Tg(mpx::GFP)] unstimulated or infected with a lethal dose of Shigella flexneri M90T (PBS, 2 × 10⁴ ± 1.3 × 10⁴ CFUs; β-glucan, 2.7 × 10⁴ ± 9.8 × 10³ CFUs) at 6 hp2i. N = 3 with >20 larvae per experiment (mean ± SD). (F) Normalized percentage of dead neutrophils (LIVE/DEAD Fixable Violet Stain) from naïve and Shigella-trained larvae [Tg(mpx::GFP)] unstimulated or infected with Shigella at 6 hp2i. N = 5 with >10 larvae per experiment (mean ± SD). *P < 0.05, ***P < 0.001, ****P < 0.0001, one-way ANOVA with Tukey’s multiple comparisons test (B, C, D, and E). a.u., arbitrary units.

References

    1. J. Domínguez-Andrés, J. C. Dos Santos, S. Bekkering, W. J. M. Mulder, J. W. M. van der Meer, N. P. Riksen, L. A. B. Joosten, M. G. Netea, Trained immunity: Adaptation within innate immune mechanisms. Physiol. Rev. 103, 313–346 (2023). - PubMed
    1. R. J. W. Arts, A. Carvalho, C. La Rocca, C. Palma, F. Rodrigues, R. Silvestre, J. Kleinnijenhuis, E. Lachmandas, L. G. Gonçalves, A. Belinha, C. Cunha, M. Oosting, L. A. B. Joosten, G. Matarese, R. van Crevel, M. G. Netea, Immunometabolic pathways in BCG-induced trained immunity. Cell Rep. 17, 2562–2571 (2016). - PMC - PubMed
    1. E. Kaufmann, J. Sanz, J. L. Dunn, N. Khan, L. E. Mendonça, A. Pacis, F. Tzelepis, E. Pernet, A. Dumaine, J. C. Grenier, F. Mailhot-Léonard, E. Ahmed, J. Belle, R. Besla, B. Mazer, I. L. King, A. Nijnik, C. S. Robbins, L. B. Barreiro, M. Divangahi, BCG educates hematopoietic stem cells to generate protective innate immunity against tuberculosis. Cell 172, 176–190.e19 (2018). - PubMed
    1. S. J. C. F. M. Moorlag, N. Khan, B. Novakovic, E. Kaufmann, T. Jansen, R. van Crevel, M. Divangahi, M. G. Netea, β-glucan induces protective trained immunity against Mycobacterium tuberculosis infection: A key role for IL-1. Cell Rep. 31, 107634 (2020). - PMC - PubMed
    1. B. de Laval, J. Maurizio, P. K. Kandalla, G. Brisou, L. Simonnet, C. Huber, G. Gimenez, O. Matcovitch-Natan, S. Reinhardt, E. David, A. Mildner, A. Leutz, B. Nadel, C. Bordi, I. Amit, S. Srrazin, M. H. Sieweke, C/EBPβ-dependent epigenetic memory induces trained immunity in hematopoietic stem cells. Cell Stem Cell 26, 657–674.e8 (2020). - PubMed