. 2023 Sep 8;9(36):eadh0140.
doi: 10.1126/sciadv.adh0140. Epub 2023 Sep 6.

Nucleoside diphosphate kinases 1 and 2 regulate a protective liver response to a high-fat diet

Affiliations

Nucleoside diphosphate kinases 1 and 2 regulate a protective liver response to a high-fat diet

Domenico Iuso et al. Sci Adv. .

Abstract

The synthesis of fatty acids from acetyl-coenzyme A (AcCoA) is deregulated in diverse pathologies, including cancer. Here, we report that fatty acid accumulation is negatively regulated by nucleoside diphosphate kinases 1 and 2 (NME1/2), housekeeping enzymes involved in nucleotide homeostasis that were recently found to bind CoA. We show that NME1 additionally binds AcCoA and that ligand recognition involves a unique binding mode dependent on the CoA/AcCoA 3' phosphate. We report that Nme2 knockout mice fed a high-fat diet (HFD) exhibit excessive triglyceride synthesis and liver steatosis. In liver cells, NME2 mediates a gene transcriptional response to HFD leading to the repression of fatty acid accumulation and activation of a protective gene expression program via targeted histone acetylation. Our findings implicate NME1/2 in the epigenetic regulation of a protective liver response to HFD and suggest a potential role in controlling AcCoA usage between the competing paths of histone acetylation and fatty acid synthesis.


Figures

Fig. 1.
Fig. 1.. NME1/2 are major CoA-binding factors in mouse spermatogenic cells.
(A) Overview of DNL. Under conditions of carbohydrate excess, mitochondrial citrate produced by the tricarboxylic acid (TCA) cycle is exported to the cytosol and converted to AcCoA by ACLY. Acetate is converted to AcCoA by ACSS2 (65). The commitment step of DNL catalyzed by ACC1 is negatively regulated by AMPK. (B) Strategy for purifying CoA-binding factors present in extracts from total testis or fractionated spermatogenic cells. After the incubation of extracts with CoA-coated Sepharose beads and successive washes, bound proteins were eluted with either free CoA or water as a control. (C) Silver-stained electrophoresis gel of proteins eluted from CoA beads with either water (Ctrl) or CoA. The major proteins captured by CoA are indicated. (D) Total testis extracts or equivalent amounts of extracts from the indicated fractionated spermatogenic cells were incubated with CoA beads and processed as in (B). (E) The identities and abundances of proteins eluted by free CoA (CoA) and water (Ctrl) were deduced from MS-based proteomic analyses. The graphs display the log2(iBAQ) of the proteins in CoA (representative of the relative abundance of the different proteins identified in this sample) on the y axis plotted against the log2(fold change CoA/ctrl) on the x axis (representative of the differential abundance between CoA and ctrl fishing). For each representation, the black and dashed red vertical lines indicate, respectively, log2(fold change) = 0 and log2(fold change) = 3.32 [i.e., fold change (CoA/ctrl) = 10]. Black and red dots highlight proteins with a fold change (CoA/ctrl) < 10 and ≥ 10, respectively. The three most abundant proteins, NME1/2 and DBIL5, are indicated. CoA pull-downs were performed on total testis extracts in the presence of either 250 mM (left) or 500 mM (right) KCl.
Fig. 2.
Fig. 2.. NME1 binds short-chain acyl-CoA ligands in vitro.
(A) Scheme illustrating phosphohistidine-mediated NDPK activity. Only one direction of the fully reversible reaction is shown. (B) Gel shift experiments confirm NDPK activity of purified recombinant NME1. Left gel: NME1 is phosphorylated by ATP. Coomassie-stained native polyacrylamide gel of bacterially expressed NME1 incubated without (lane 10) or with (lanes 1 to 9) increasing amounts of ATP. At higher ATP concentrations, more subunits within each NME1 hexamer are phosphorylated, resulting in additional higher mobility bands on the gel. Right gel: NME1 is dephosphorylated by ADP. Native gel of phosphorylated NME1 incubated without (lane 1) or with (lanes 2 to 5) increasing amounts of ADP, illustrating phosphoryl group transfer from NME1 to ADP. (C) Native MS analysis of recombinant purified NME1 incubated with CoA, AcCoA, or SucCoA, as indicated. Peaks corresponding to charge states +22 and +21 represent the NME1 hexamer with 0 to 6 ligands bound. (D) Thermal denaturation profile of NME1 measured by nanoDSF. Representative profiles are shown for NME1 in the absence and presence of CoA ligands. Tm and ΔTm values represent the means and SD from three independent experiments. (E) Representative ITC profile of CoA binding by NME1. Differential power (ΔP) data time course of raw injection heats for a titration of CoA into NME1. Inset: Normalized binding enthalpies corrected for heat of dilution as a function of binding site saturation. Data were fit using a single-site binding model. Kd and thermodynamic parameters represent means and SD values determined from three independent experiments.
Fig. 3.
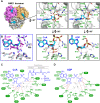
Fig. 3.. NME1 recognizes CoA via a unique binding mode dependent on the 3′ phosphate.
(A) Structural comparison of NME1 bound to CoA/SucCoA (left) and ADP (right). Direct and water-mediated hydrogen bonds are shown as red and gray dashed lines, respectively. (B) Superimposition of the CoA and ADP ligands showing rotation of the adenine base and repositioning of the α- and β-phosphate groups, relatively shifted by 2.9 and 3.9 Å, respectively. (C and D) Schematic summary of interactions for (C) CoA/SucCoA and (D) ADP. Red and gray dashed lines represent direct and water-mediated hydrogen bonds. NME1 residues mediating H bonding are indicated in white on a green background; residues mediating van der Waals or aromatic stacking interactions are labeled green. Arg58 forms a salt bridge with the CoA α phosphate in a subset of NME1 subunits. Important water molecules are numbered 1 to 6. Three of these are conserved between the ADP- and SucCoA-bound structures. In previous ADP-bound NDPK structures (PDB 1NUE and 1NDP), a Mg2+ ion replaces water molecule 2 (red asterisk). The CoA 3′ phosphate group forms direct H bonds with Lys12, Tyr52, Asn115, and His118 as well as water-mediated H bonds with Arg88, Arg105, and the Gly119 backbone. In the ADP-bound structure, these residues either hydrogen bond with the ribose 2′ and 3’ OH groups or with a water molecule H-bonded to the β phosphate. Because the CoA ribose is displaced away from the protein by the 3′ phosphate, the H bonds that NME1 residues Lys12 and Asn115 make with the 2’ OH group of ADP are replaced by water-mediated bonds that allow the larger protein-ligand distance to be bridged. Similarly, the outward shift of the CoA β phosphate is accommodated by water molecules that satisfy the H bonding potential of residues Arg88 and Arg105, which, in the ADP-bound structure, directly contact the β-phosphate.
Fig. 4.
Fig. 4.. CoA binding by NME1 is mutually exclusive with histidine phosphorylation.
(A) Native MS analysis of NME1 incubated in the absence of ligand (top left) or the presence of dephospho-CoA (bottom left), CoA (bottom right; same spectrum as in Fig. 2C), ATP (middle right), or an equimolar mixture of CoA and ATP (each in fivefold excess relative to NME1; top right), which leads to a mixture of CoA binding and histidine phosphorylation. Spectra show that the 3′ phosphate of CoA is critical for binding and that CoA binding and phosphorylation of the NME1 hexamer are mutually competitive. (B) NME1 does not promiscuously bind common ADP-containing metabolites. NME1-loaded CoA beads (input) were incubated with an excess of the indicated molecules, and the release of NME1 was visualized by an immunoblot of the flow-through probed with an NME1 antibody. dCoA is dephospho-CoA. (C) NME1 (3 μg) loaded on CoA beads were incubated in the absence or presence of either 30 or 300 μM ATP, and the amounts of bound (CoA-bound) and released (flow-through) NME1 were visualized by immunoblotting (top). Bottom panels show the same blots probed with an anti-phosphohistidine antibody.
Fig. 5.
Fig. 5.. NME1/2 repress lipogenesis in the liver.
(A) Total amounts of NME1 and NME2 were visualized in the liver of Nme2+/+ and Nme2−/− mice. Values represent the NME1/2 signal intensity relative to tubulin as measured by gel densitometry. (B) Liver extracts from three different Nme2+/+ and Nme2−/− mice were used in a CoA-bead pull-down experiment as described in Fig. 1B. Input (0.5%) and CoA-bound materials were visualized on a silver-stained gel, and a fraction was used to show the presence of NME1/2 in the corresponding samples by immunoblotting (bottom). (C) Values corresponding to the total amount of fatty acids measured in liver extracts from five different Nme2+/+ and four Nme2−/− mice are shown. Error bars represent SD. (D) The amounts of different fatty acid species (indicated as Cx:y, where x and y are the number of carbon atoms and double bonds, respectively) in liver extracts from five different Nme2+/+ and four Nme2−/− mice are shown. Error bars represent SD. Fatty acid species showing the highest increase in Nme2 ko liver are highlighted in red. (E) Nme2+/+ and Nme2−/− mice were subject to normal diet (ND; four Nme2+/+ and five Nme2−/− mice) or high-fat diet (HFD; six Nme2+/+ and seven Nme2−/− mice). Representative images of hematoxylin and eosin–stained paraffin-embedded liver sections from Nme2+/+ and Nme2−/− male mice after 6 weeks of ND or HFD are shown as indicated. Scale bar, 100 μm. (F) Triglyceride concentrations were measured in liver extracts from 4 Nme2+/+ and 4 Nme2−/− mice in ND and from 10 Nme2+/+ and 12 Nme2−/− after 6 weeks of HFD. Error bars represent SD. P values are indicated. In all panels, statistical significance is indicated by symbols * and ** for P values <0.05 and < 0.01, respectively (Student’s t test).
Fig. 6.
Fig. 6.. NME2 regulates the liver cell response to an HFD challenge.
(A) RNAs extracted from liver of four mice of each indicated genotype kept under ND or fed for 6 weeks with an HFD were subjected to RNA-seq. The expression of genes differentially expressed between the liver of HFD and ND fed Nme2+/+ mice (with a fold change absolute value >2 and a P value <0.01) is shown as a heatmap in Nme2+/+ and Nme2−/− mice for both conditions as indicated. Hierarchical clustering enables the identification of genes that escape HFD-dependent repression or activation in Nme2−/− mice (indicated on the right side of the heatmap by red and blue bars, respectively). (B) GSEA plots showing a down-regulation of the gene set corresponding to genes involved in adipogenesis in the hepatocytes of Nme2+/+ mice liver treated with HFD for 6 weeks compared with ND (reference, left). The same gene set is significantly enriched in hepatocytes of Nme2−/− mice compared to Nme2+/+ mice (reference) under HFD (right), showing that the HFD-induced repression of this gene set is abolished in Nme2−/− hepatocytes. (C) Box plots representing the distribution of the expression levels of the indicated individual genes in liver from Nme2+/+or Nme2−/− mice under ND or HFD are shown. The values correspond to the normalized RNA-seq read counts.
Fig. 7.
Fig. 7.. NME2 modulates H3K9ac distribution at gene TSSs.
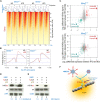
(A) Purified mouse liver nuclei (N = 2 per condition) were MNase-digested. Mono-nucleosomes were immunoprecipitated using an anti-H3K9ac antibody. Normalized read counts at the corresponding gene TSS were visualized. Normalization assumed similar total H3K9ac levels in all samples, as confirmed in fig. S12B. TSS regions are ranked by mean signal value across all conditions, from highest to lowest. (B) The mean values of two independent H3K9ac ChIP read counts from HFD (red) and ND (black) in Nme2+/+ and Nme2−/− mice were plotted over ±1.5 kb centered on TSS regions corresponding to the 25% top most highly expressed genes (according to the transcriptomic data of Nme2+/+ mouse liver samples under ND, n = 3500 TSS). (C) The difference of the mean H3K9ac ChIP-seq values between HFD and ND for each TSS-0.8 + 1.5 kb region was plotted against the differential expression values (log2 of the fold change) of the corresponding genes between the same conditions. Considering the Nme2+/+ liver samples (top), two groups of TSS/genes were selected, either presenting both an enhanced expression and an increased TSS H3K9ac level between HFD and ND (red dots) or showing a reduced expression and a decreased H3K9ac level between HFD and ND (green dots). The same genes are visualized on the plot corresponding to the Nme2−/− liver in the bottom (i.e., genes symbolized by red or green dots are the same in both panels). (D) Purified mononucleosomes and Flag-p300 were incubated with equimolar AcCoA and purified NME1 (49 μM) as indicated and histone acetylation (H4K5ac) was detected by immunoblotting. (E) The same experiment as in (D), but p300 was replaced by Flag-GCN5, and H3K14ac was immunodetected. (F) Scheme showing the proposed role for NME1/2 in releasing AcCoA in the active chromatin region harboring an ATP-rich environment in the vicinity of HATs and subsequent targeted histone acetylation.

References

    1. M. Wallace, C. M. Metallo, Tracing insights into de novo lipogenesis in liver and adipose tissues. Semin. Cell Dev. Biol. 108, 65–71 (2020). - PubMed
    1. F. Ameer, L. Scandiuzzi, S. Hasnain, H. Kalbacher, N. Zaidi, De novo lipogenesis in health and disease. Metabolism 63, 895–902 (2014). - PubMed
    1. J. E. Lambert, M. A. Ramos-Roman, J. D. Browning, E. J. Parks, Increased de novo lipogenesis is a distinct characteristic of individuals with nonalcoholic fatty liver disease. Gastroenterology 146, 726–735 (2014). - PMC - PubMed
    1. G. I. Smith, M. Shankaran, M. Yoshino, G. G. Schweitzer, M. Chondronikola, J. W. Beals, A. L. Okunade, B. W. Patterson, E. Nyangau, T. Field, C. B. Sirlin, S. Talukdar, M. K. Hellerstein, S. Klein, Insulin resistance drives hepatic de novo lipogenesis in nonalcoholic fatty liver disease. J. Clin. Invest. 130, 1453–1460 (2020). - PMC - PubMed
    1. K. H. M. Roumans, L. Lindeboom, P. Veeraiah, C. M. E. Remie, E. Phielix, B. Havekes, Y. M. H. Bruls, M. Brouwers, M. Stahlman, M. Alssema, H. P. F. Peters, R. de Mutsert, B. Staels, M. R. Taskinen, J. Boren, P. Schrauwen, V. B. Schrauwen-Hinderling, Hepatic saturated fatty acid fraction is associated with de novo lipogenesis and hepatic insulin resistance. Nat. Commun. 11, 1891 (2020). - PMC - PubMed