

Predictive models of long COVID
- PMID: 37672869
- PMCID: PMC10494314
- DOI: 10.1016/j.ebiom.2023.104777
Predictive models of long COVID
Abstract
Background: The cause and symptoms of long COVID are poorly understood. It is challenging to predict whether a given COVID-19 patient will develop long COVID in the future.
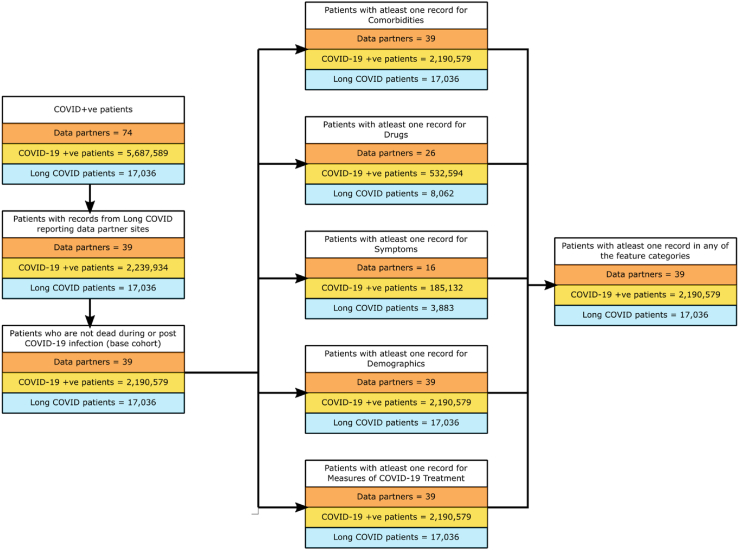
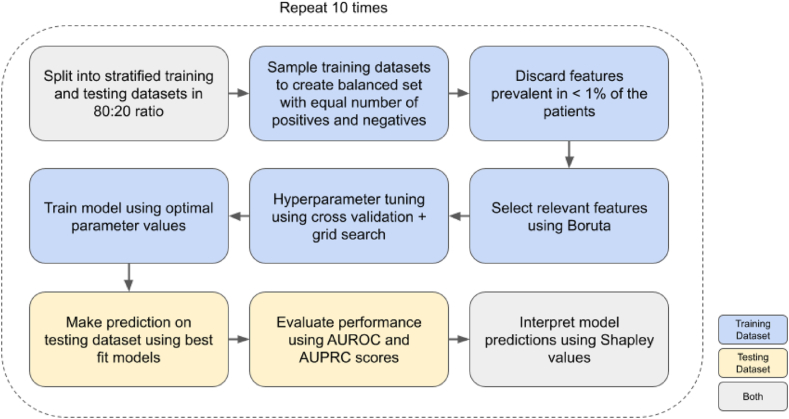
Methods: We used electronic health record (EHR) data from the National COVID Cohort Collaborative to predict the incidence of long COVID. We trained two machine learning (ML) models - logistic regression (LR) and random forest (RF). Features used to train predictors included symptoms and drugs ordered during acute infection, measures of COVID-19 treatment, pre-COVID comorbidities, and demographic information. We assigned the 'long COVID' label to patients diagnosed with the U09.9 ICD10-CM code. The cohorts included patients with (a) EHRs reported from data partners using U09.9 ICD10-CM code and (b) at least one EHR in each feature category. We analysed three cohorts: all patients (n = 2,190,579; diagnosed with long COVID = 17,036), inpatients (149,319; 3,295), and outpatients (2,041,260; 13,741).
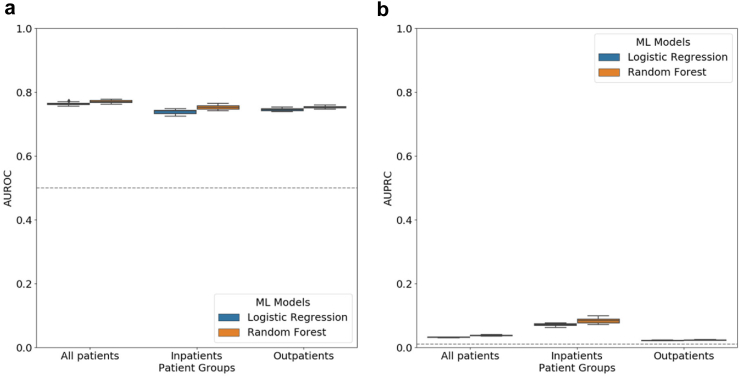
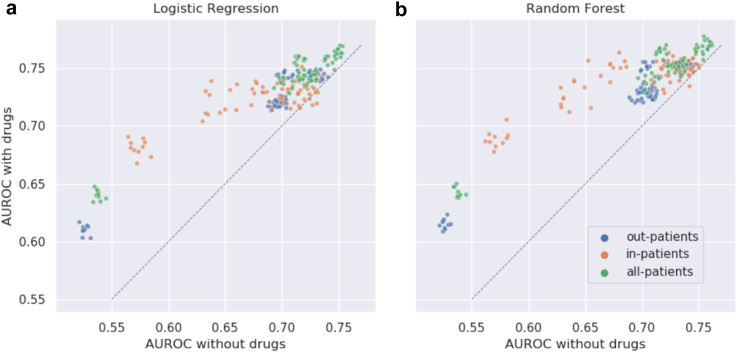
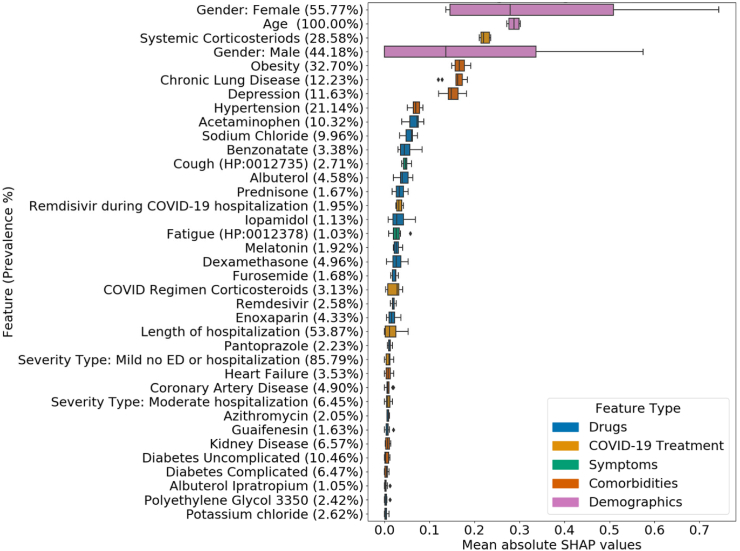
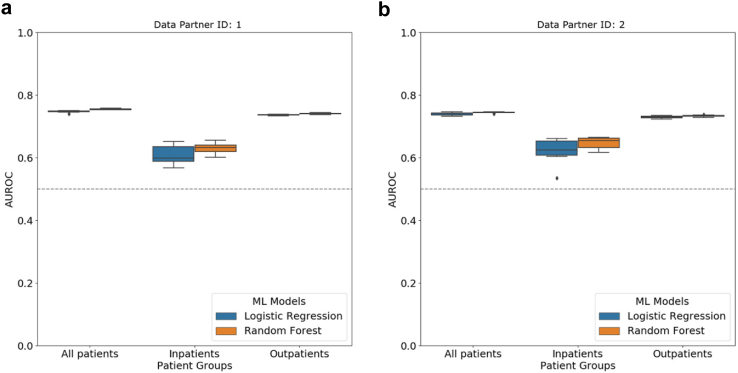
Findings: LR and RF models yielded median AUROC of 0.76 and 0.75, respectively. Ablation study revealed that drugs had the highest influence on the prediction task. The SHAP method identified age, gender, cough, fatigue, albuterol, obesity, diabetes, and chronic lung disease as explanatory features. Models trained on data from one N3C partner and tested on data from the other partners had average AUROC of 0.75.
Interpretation: ML-based classification using EHR information from the acute infection period is effective in predicting long COVID. SHAP methods identified important features for prediction. Cross-site analysis demonstrated the generalizability of the proposed methodology.
Funding: NCATS U24 TR002306, NCATS UL1 TR003015, Axle Informatics Subcontract: NCATS-P00438-B, NIH/NIDDK/OD, PSR2015-1720GVALE_01, G43C22001320007, and Director, Office of Science, Office of Basic Energy Sciences of the U.S. Department of Energy Contract No. DE-AC02-05CH11231.
Keywords: COVID-19; Classification; Cross-site analysis; Explainability; Long COVID.
Copyright © 2023 The Author(s). Published by Elsevier B.V. All rights reserved.
Conflict of interest statement
Declaration of interests J Loomba received consulting fees from Axle Informatics as a subject matter expert for RadxUp Long COVID computational challenge (L3C). The other authors declare no competing interests.
Figures
References
-
- CDC. Centers for Disease Control and Prevention Post-COVID conditions: overview for healthcare providers. 2020. https://www.cdc.gov/coronavirus/2019-ncov/hcp/clinical-care/post-covid-c... [cited 2022 Aug 31]. Available from:
MeSH terms
Grants and funding
- UM1 TR004404/TR/NCATS NIH HHS/United States
- UL1 TR002649/TR/NCATS NIH HHS/United States
- UL1 TR001433/TR/NCATS NIH HHS/United States
- UL1 TR001422/TR/NCATS NIH HHS/United States
- UL1 TR001860/TR/NCATS NIH HHS/United States
- UL1 TR001427/TR/NCATS NIH HHS/United States
- U54 GM104942/GM/NIGMS NIH HHS/United States
- UL1 TR001420/TR/NCATS NIH HHS/United States
- UL1 TR001439/TR/NCATS NIH HHS/United States
- UL1 TR002243/TR/NCATS NIH HHS/United States
- UL1 TR001445/TR/NCATS NIH HHS/United States
- UL1 TR003096/TR/NCATS NIH HHS/United States
- UM1 TR004556/TR/NCATS NIH HHS/United States
- U54 GM104938/GM/NIGMS NIH HHS/United States
- UL1 TR002537/TR/NCATS NIH HHS/United States
- UL1 TR001412/TR/NCATS NIH HHS/United States
- UL1 TR001872/TR/NCATS NIH HHS/United States
- UL1 TR001878/TR/NCATS NIH HHS/United States
- UL1 TR002529/TR/NCATS NIH HHS/United States
- UL1 TR001863/TR/NCATS NIH HHS/United States
- UL1 TR002494/TR/NCATS NIH HHS/United States
- UL1 TR002736/TR/NCATS NIH HHS/United States
- U54 GM115516/GM/NIGMS NIH HHS/United States
- UL1 TR002369/TR/NCATS NIH HHS/United States
- UL1 TR002541/TR/NCATS NIH HHS/United States
- U54 GM115371/GM/NIGMS NIH HHS/United States
- UL1 TR002001/TR/NCATS NIH HHS/United States
- UL1 TR002538/TR/NCATS NIH HHS/United States
- U54 GM115458/GM/NIGMS NIH HHS/United States
- UL1 TR001442/TR/NCATS NIH HHS/United States
- UL1 TR002535/TR/NCATS NIH HHS/United States
- UL1 TR001866/TR/NCATS NIH HHS/United States
- UL1 TR003167/TR/NCATS NIH HHS/United States
- UL1 TR001409/TR/NCATS NIH HHS/United States
- UL1 TR001449/TR/NCATS NIH HHS/United States
- UL1 TR001453/TR/NCATS NIH HHS/United States
- UL1 TR002489/TR/NCATS NIH HHS/United States
- U54 GM104940/GM/NIGMS NIH HHS/United States
- UL1 TR003107/TR/NCATS NIH HHS/United States
- UL1 TR003015/TR/NCATS NIH HHS/United States
- UL1 TR002733/TR/NCATS NIH HHS/United States
- U24 TR002306/TR/NCATS NIH HHS/United States
- UL1 TR002003/TR/NCATS NIH HHS/United States
- UL1 TR001876/TR/NCATS NIH HHS/United States
- UL1 TR001436/TR/NCATS NIH HHS/United States
- UL1 TR002378/TR/NCATS NIH HHS/United States
- UL1 TR002384/TR/NCATS NIH HHS/United States
- UL1 TR002553/TR/NCATS NIH HHS/United States
- UL1 TR002389/TR/NCATS NIH HHS/United States
- UL1 TR001414/TR/NCATS NIH HHS/United States
- U54 GM104941/GM/NIGMS NIH HHS/United States
- UL1 TR002014/TR/NCATS NIH HHS/United States
- UL1 TR002550/TR/NCATS NIH HHS/United States
- UL1 TR002319/TR/NCATS NIH HHS/United States
- UL1 TR001855/TR/NCATS NIH HHS/United States
- UL1 TR001425/TR/NCATS NIH HHS/United States
- UL1 TR002373/TR/NCATS NIH HHS/United States
- UL1 TR002240/TR/NCATS NIH HHS/United States
- UL1 TR002556/TR/NCATS NIH HHS/United States
- UL1 TR003017/TR/NCATS NIH HHS/United States
- UL1 TR001998/TR/NCATS NIH HHS/United States
- UL1 TR001873/TR/NCATS NIH HHS/United States
- UL1 TR001881/TR/NCATS NIH HHS/United States
- UL1 TR002645/TR/NCATS NIH HHS/United States
- UL1 TR001450/TR/NCATS NIH HHS/United States
- UL1 TR002366/TR/NCATS NIH HHS/United States
- U54 GM115428/GM/NIGMS NIH HHS/United States
- UL1 TR002345/TR/NCATS NIH HHS/United States
- UL1 TR002377/TR/NCATS NIH HHS/United States
- U54 GM115677/GM/NIGMS NIH HHS/United States
- UL1 TR002544/TR/NCATS NIH HHS/United States
- UL1 TR003098/TR/NCATS NIH HHS/United States
- UL1 TR001430/TR/NCATS NIH HHS/United States
- UL1 TR003142/TR/NCATS NIH HHS/United States
