. 2023 Oct 5;30(10):1382-1391.e5.
doi: 10.1016/j.stem.2023.08.009. Epub 2023 Sep 5.

LIF signaling regulates outer radial glial to interneuron fate during human cortical development

Affiliations

LIF signaling regulates outer radial glial to interneuron fate during human cortical development

Madeline G Andrews et al. Cell Stem Cell. .

Abstract

Radial glial (RG) development is essential for cerebral cortex growth and organization. In humans, the outer radial glia (oRG) subtype is expanded and gives rise to diverse neurons and glia. However, the mechanisms regulating oRG differentiation are unclear. oRG cells express leukemia-inhibitory factor (LIF) receptors during neurogenesis, and consistent with a role in stem cell self-renewal, LIF perturbation impacts oRG proliferation in cortical tissue and organoids. Surprisingly, LIF treatment also increases the production of inhibitory interneurons (INs) in cortical cultures. Comparative transcriptomic analysis identifies that the enhanced IN population resembles INs produced in the caudal ganglionic eminence. To evaluate whether INs could arise from oRGs, we isolated primary oRG cells and cultured them with LIF. We observed the production of INs from oRG cells and an increase in IN abundance following LIF treatment. Our observations suggest that LIF signaling regulates the capacity of oRG cells to generate INs.

Keywords: cerebral cortex; human development; inhibitory interneurons; mechanisms of differentiation; neural progenitors; neurodevelopment; organoid models; pluripotent stem cells; radial glia; signaling mechanisms.


Conflict of interest statement

Declaration of interests A.R.K. is a co-founder, consultant, and member of the Board of Neurona Therapeutics.

Figures
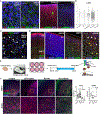
Figure 1.
Figure 1.. LIF signaling mediators are present in the dorsal, but not in the ventral, cortex, and LIF signaling perturbation impacts the ratio of oRGs and IPCs in cortical tissue
(A) During GW17 and GW18, LIFR is present in the oSVZ on NESTIN+ RG in the dorsal neocortex, but not in the ventral GE. LIF co-labels DCX+ neurons in the CP, but not in the GE. LAMININ+ vascular cells are in both cortex and GE. (B) Reanalysis of human neural tissue identified highest LIFR expression in the neocortex. (C) LIFR is present in HOPX+ oRG cells in the oSVZ (white arrowheads) of GW19 cortical tissue. (D) LIF expression overlaps with NEUN+ excitatory neurons that are CTIP2+ (yellow arrowheads) or SATB2+ (white arrowheads) during GW15–19. (E) Cortical tissue was sliced, cultured at air liquid interface (ALI), and treated with LIF, SC144, or ruxolitinib for 1 week. (F) LIF inhibition decreases HOPX+ oRG cells, whereas LIF addition reduces EOMES+ IPCs (one-way ANOVA with multiple comparisons, HOPX: vehicle vs. SC144: *p < 0.018, vehicle vs. Rux: p = 0.0539; EOMES: vehicle vs. LIF: *p < 0.0252, vehicle vs. SC144: p = 0.6552, vehicle vs. Rux: p = 0.0576, n = 7 biological samples). Data are represented as mean ± SD.
Figure 2.
Figure 2.. LIF signaling increases the number of oRG cells in forebrain organoids
(A) Protocol for dorsal forebrain organoid induction. (B) LIF treatment during weeks 6–8 increases the number of HOPX+ (unpaired t test: week 10: *p = 0.024, n = 5 differentiation batches from 3 lines) and GFAP+ (unpaired t test: *p < 0.04, n = 5 batches from 3 lines) oRG cells in week 10 organoids. No changes in SOX2+ or pHH3+ cells were observed (unpaired student t tests; p > 0.05 for all comparisons). Data are represented as mean ± SD. (C) Continuous LIF treatment increases SOX2+ (unpaired t test for control vs. LIF, week 10: *p < 0.0185, n = 3 batches from 3 lines; week 15: ****p < 0.0001,n = 4 batches from 3 lines), pHH3+ (unpaired t test, week 10: **p < 0.0034, n = 5 batches from 3 lines, week 15: **p < 0.0054, n = 2 batches from 2 lines), HOPX+ (unpaired t test: week 10: ****p < 0.0001, n = 5 batches from 3 lines; week 15: ****p < 0.0001, n = 3 batches from 3 lines) and GFAP+ oRG cells (unpaired t test, week 10: ****p < 0.0001, n = 3 batches from 3 lines; week 15: **p < 0.0018, n = 2 batches from 2 lines). Data are represented as mean ± SD. (D) Uniform Manifold Approximation and Projection (UMAP) plots separated by cluster and treatment group. (E) Feature plots showing the expression of cortical markers FOXG1, SOX2, HOPX, GFAP, EOMES, and NEUROD6.
Figure 3.
Figure 3.. DLX+ IN-like cells are present in forebrain organoids and cortical tissue and increase after LIF treatment
(A) Feature plots of IN_IPC markers, ASCL1 and BEST3, and IN markers, GAD1, GAD2, DLX1, and DLX5 in weeks 8–15 organoids. (B) Proportions of cell types in organoids captured in scRNA-seq. (C) Violin plots of IN markers (DLX1: ****p < 7.58 × 10−56, DLX5: ****p < 4.04 × 10−48, GAD2: ****p < 2.2 × 10−52) in organoids with and without LIF treatment between weeks 6 and 8. (D) Quantification of DLX5+ (unpaired t test, **p < 0.0059, n = 3 differentiation batches across 3 lines) and GABA+ (unpaired t test, p = 0.0594, n = 2 batches across 2 lines) cells (white arrowheads). Data are represented as mean ± SD. (E) Quantification of DLX5+ cells in organotypic slice cultures of GW15–19 cortical tissue (unpaired t test, **p < 0.0054, n = 6 biological samples from GW18 to GW19). Data are represented as mean ± SD.
Figure 4.
Figure 4.. CGE-like INs are present in dorsal forebrain organoids and oRG-derived cultures and increase after LIF treatment
(A) Proportions of IN subtypes in forebrain organoids captured in scRNA-seq. (B) Correlations between 3 month organoid and primary GE datasets. (C) Correlations between 6 month organoids and primary GE datasets. (D) UMAP of IN subtypes and proportions in organoids treated with LIF during peak oRG expansion. (E) In situ hybridization of PCDH9 (unpaired t test, ****p < 0.0001, n = 3 biological samples), SCGN (unpaired t test, **p < 0.0014, n = 3 biological samples), and DLX5 (unpaired t test, p = 0.0624, n = 3 biological samples) in the oSVZ of GW18 and GW19 cortical slices treated with and without LIF (white arrowheads). Data are represented as mean ± SD. (F) UMAP of FACS-isolated RGs at day 0 and progeny after 4 weeks in culture. (G) Feature plots of IPC_IN marker BEST3+, IN marker DLX5+, and MGE markers LHX6 and NKX2–1. (H) Feature plots of CGE markers SCGN, PROX1, and SP8. (I) Proportions of IN subtypes derived from FACS-isolated oRG cells captured in scRNA-seq. (J) GW16 FACS-isolated oRG cells cultured under control and LIF-treated conditions (DLX5: ****p < 0.0001; NEUN ****p < 0.0001, n = 4 biological samples). Data are represented as mean ± SD.

References

    1. Eze UC, Bhaduri A, Haeussler M, Nowakowski TJ, and Kriegstein AR (2021). Single-cell atlas of early human brain development highlights heterogeneity of human neuroepithelial cells and early radial glia. Nat. Neurosci 24, 584–594. 10.1038/s41593-020-00794-1. - DOI - PMC - PubMed
    1. Bhaduri A, Sandoval-Espinosa C, Otero-Garcia M, Oh I, Yin R, Eze UC, Nowakowski TJ, and Kriegstein AR (2021). An atlas of cortical arealization identifies dynamic molecular signatures. Nature 598, 200–204. 10.1038/s41586-021-03910-8. - DOI - PMC - PubMed
    1. Fan X, Fu Y, Zhou X, Sun L, Yang M, Wang M, Chen R, Wu Q, Yong J, Dong J, et al. (2020). Single-cell transcriptome analysis reveals cell lineage specification in temporal-spatial patterns in human cortical development. Sci. Adv 6, eaaz2978. 10.1126/sciadv.aaz2978. - DOI - PMC - PubMed
    1. Shi Y, Wang M, Mi D, Lu T, Wang B, Dong H, Zhong S, Chen Y, Sun L, Zhou X, et al. (2021). Mouse and human share conserved transcriptional programs for interneuron development. Science 374, eabj6641. 10.1126/science.abj6641. - DOI - PubMed
    1. Aldinger KA, Thomson Z, Phelps IG, Haldipur P, Deng M, Timms AE, Hirano M, Santpere G, Roco C, Rosenberg AB, et al. (2021). Spatial and cell type transcriptional landscape of human cerebellar development. Nat. Neurosci 24, 1163–1175. 10.1038/s41593-021-00872-y. - DOI - PMC - PubMed

Publication types